
Abstract
It has long been recognized that the official statistics on suicide understate the true scope of this increasing public health issue worldwide [1–3]. Similarly, in Australia, the accuracy of suicide statistics published by the Australian Bureau of Statistics (ABS) has been recently questioned by several authors [4–8]. An overall discussion of the interrelated issues is presented elsewhere [9].
More specifically with respect to ABS data, there is proof now that the ABS has been underestimating the number of suicides in Australia: the accumulation of various criticisms about ABS procedures led the Australian Institute of Health and Welfare (AIHW) to undertake a ‘recount’ of the official suicide data [8]. That recount exercise, for a single year, i.e. 2004, indicated that the ABS had underestimated suicide for Australia by 16% in that year. This recount did not implement any different concept of suicide but rather addressed the procedures of enumeration and the detection of misclassifications. In this context it is relevant also to note that one of the terms of reference for the Senate Inquiry into Suicide directs attention to this matter, i.e. ‘The accuracy of official suicide statistics in Australia, factors that may impede accurate identification and recording of possible suicide (and the consequences of any under-reporting)’ [10].
Concern over the accuracy of the ABS data is implied by the fact that the ABS has recently introduced significant changes to its procedures for recording and reporting suicide. The following indicates one change: ‘For 2006 deaths the ABS relied totally on information available on the National Coronial Information System (NCIS) for information related to deaths certified by a coroner. In previous years the ABS had sought additional information on coroner certified deaths [where] information was not available on NCIS by undertaking personal visits to coroner offices to extract information from paper records’ [11].
ABS data collection processes can involve many procedural, or systemic, factors. As a result, various sets of circumstances can become not just singly, but jointly, obstacles to data accuracy ‘at the coalface’. An example of this is the co-occurrence of the reliance by the ABS on electronic data recorded on the NCIS (as mentioned above) with that electronic source becoming increasingly inaccurate. This inaccuracy arose from the lack of staff resources in the coroners’ offices in the states and territories, thus creating a backlog of closed cases to be entered on the electronic system.
Another procedural factor leading to inaccuracy of ABS published data relates to the temporal processes. When the ABS ceases processing cases for a particular year, possible suicides may still be open cases on the NCIS. Such open cases are then coded by the ‘intent of notification’ recorded on the NCIS. Subsequently, the Coroner may close the case and record suicide as the cause of death, but no revision of ABS data is undertaken: ‘The causes of death statistics are not revised once a coronial enquiry is finalised’ [11].
The ABS warns about the quality of its ‘cause of death’ data in general, and particularly its ‘suicide’ data. For some years the ABS has published a ‘caution’, and in 2006, it reads as follows: ‘The level of recorded deaths attributable to suicide, and observed changes over time, are likely to have been affected by [coronial] delays in finalising a cause’ [12]. A more recent ABS warning is: ‘Care should be taken in using and interpreting suicide data contained in this publication due to concerns regarding data quality’ [13].
Little is known about the magnitude of the underestimation and its trend through time, and whether or not it is statistically significant. An added difficulty is that there has been, until recently, an absence of an alternative data set. In 1990 such a dataset was established in Queensland, the Queensland Suicide Register (QSR). The purpose of this paper is to compare the ABS count of Queensland suicides with this alternative data set, with particular reference to the time-series data.
Queensland suicide data, from the ABS and the QSR
Official data on suicide, as published by the ABS, are produced as part of a more general collection process associated with external causes of death. ‘External causes’ is a general term that covers falls, poisoning, transport crashes, etc., in contradistinction to deaths arising from natural causes (e.g. ischaemic heart disease, cancer, etc.). In Australia, approximately 80% of deaths from external causes are reported to the (state/territorial) coronial services for investigation [9]. Other agencies involved in this process are police, and sometimes funeral directors the medical/scientific community (for autopsy and toxicology reports), the (state/territorial) Registrars of Births, Marriages, and Deaths, and more recently, the NCIS. For more detail on the coding of suicide deaths, see Technical Notes 1 and 2 in Causes of Death, 2007 [13].
The quality of the data published by the ABS is affected by different jurisdictional practices relating to definitions of suicidal intent, coding of causes of death, management of incomplete information, time lags, etc. The explanatory notes accompanying the ABS's annual suicide statistics have, for several years, cautioned that the quality of cause of death coding, in particular coding of deaths due to external causes, can be affected by several factors. These include the availability and clarity of information needed to determine the suicidal intent, changes in the way information is reported by certifiers, lags in completion of coronial cases, and time needed for processing of the findings [11–15].
The ‘recount’ exercise by Harrison et al. [8] (mentioned in the introduction) indicated a total underestimation of suicide in Australia of 16% for 2004. For Queensland, the underestimate was 24.9% for that year. Magnitudes of underestimation of these orders are not unique to Australia: it has been determined that official suicide data for France have been underestimated by about 20% [16].
Following various criticisms of its procedures, in 2006 the ABS established a Suicide Coding Review Group to consider classification and collection problems. As a result, various internal ABS processes have been addressed to improve the quality of coding and publication of suicide deaths, as outlined in Technical Note 1, ABS Coding of Suicide Deaths in Causes of Death, 2007 [13]. A very important procedural change was also introduced, involving a different, and better, trade-off between timeliness and accuracy of releasing mortality data; a revision of data was to be undertaken for all coroner-certified deaths from 1 January 2007 onwards. It is expected that the new processes will improve the reliability and usefulness of ABS data on suicide.
For the State of Queensland, the QSR provides an alternative source. The QSR is a comprehensive data base of suicide mortality, managed by the Australian Institute for Suicide Research and Prevention (AISRAP) at Griffith University. Information on possible deaths by suicide is gathered for all Queensland residents from the following three sources: the police report to the Coroner following a possible suicide, the post mortem report, and toxicology results. The police report, previously called ‘Form 4’, and since December 2003 called ‘Form 1’, contains demographic details and the circumstances surrounding the death. In 1994, a psychological autopsy questionnaire was added, which collects information not simply on medical history, but also the psychological history of the deceased and relevant critical life events. Form 1 is completed by a police officer during the police investigation of a possible suicide, and involves interviews with people close to the deceased. It is important to note that Form 1 was jointly devised by the Office of the State Coroner, the Queensland Police Service and AISRAP.
Uncertainty exists in many dimensions of health and medicine. With respect to suicide, there may be uncertainties about the intent of the deceased and the general circumstances surrounding the death. In compiling Australia's suicide data, the ABS applies a high standard of proof: there must be ‘specific documentation from a medical or legal authority… regarding both the self-inflicted nature and suicidal intent of the incident’ [13]. This may well be a statement of current ABS practice; however, it is somewhat misleading in that it is not applicable to the publication of ABS data (which have not been revised) for prior years. This is clear from the following statement: ‘The interpretation of what constitutes a ‘medical or legal authority’ has been inconsistently applied by the ABS over a number of years’ [13]. The text of the three paragraphs following this statement clearly indicates the lack of clarity of definition in the ABS regarding the determination of suicide. In other words, the ABS ‘standard of proof’’ for suicide has been subject to variation and inconsistency.
It must be noted also that if there are uncertainties about intent and circumstances, such deaths may be attributed by the ABS to other internal or external causes, or be classified as accidental or undetermined. On the other hand, in compiling the QSR, AISRAP applies a decision tree which recognizes three different levels of certainty that the deaths occurred due to suicide: Beyond Reasonable Doubt, Probable, and Possible (See the suicide classification flow chart in De Leo, Klieve and Milner [19]). Given the higher level of uncertainty that defines the Possible cases, most analyses of QSR data involve the summation of deaths classified as Beyond Reasonable Doubt and Probable only. It is the aggregation of these two categories which are considered in this paper.
Method
Data
Suicide data for males and for females were obtained from the two sources, the ABS and the QSR, for the period 1994 to 2007. The AIHW's GRIM Books [17] provide Queensland's ABS mortality data, although the data for the year 2007 was requested directly from the ABS. At the time of writing (at the end of March 2010), the most recent published data are for 2007. Hence, the study period 1994–2007 involves 14 observations. All suicide data reported in this study are expressed as rates per 100 000 population [18] and are age-standardized by the direct method using the 2001 age-distribution in Australia.
Figure 1 shows age-standardized suicide rates for Queensland collected and published by the ABS and AISRAP (QSR data) for the period 1994 to 2007. There are also two additional observations for the year 2004 in Figure 1, indicated by the two black dots and the notation ‘ABS+24.9%’. These observations are the two suicide rates for males and females as calculated from the Harrison et al. [8] re-count of the ABS data for the year 2004. In the case of Queensland, the relevant underestimate to apply is not the national 16% mentioned previously, but that for Queensland, which is 24.9% [8]. This difference was explained by the very large numbers of open coronial cases in Queensland (Table T1.2 in Causes of death, 2007) [13]. It is relevant to note that the two observations from the Harrison et al. [8] re-count study are close to, but less than, the rates estimated from the QSR. This is not surprising, as the authors were adopting the ABS approach to suicide rather than the medical/psychological approach adopted in the compilation of the QSR.
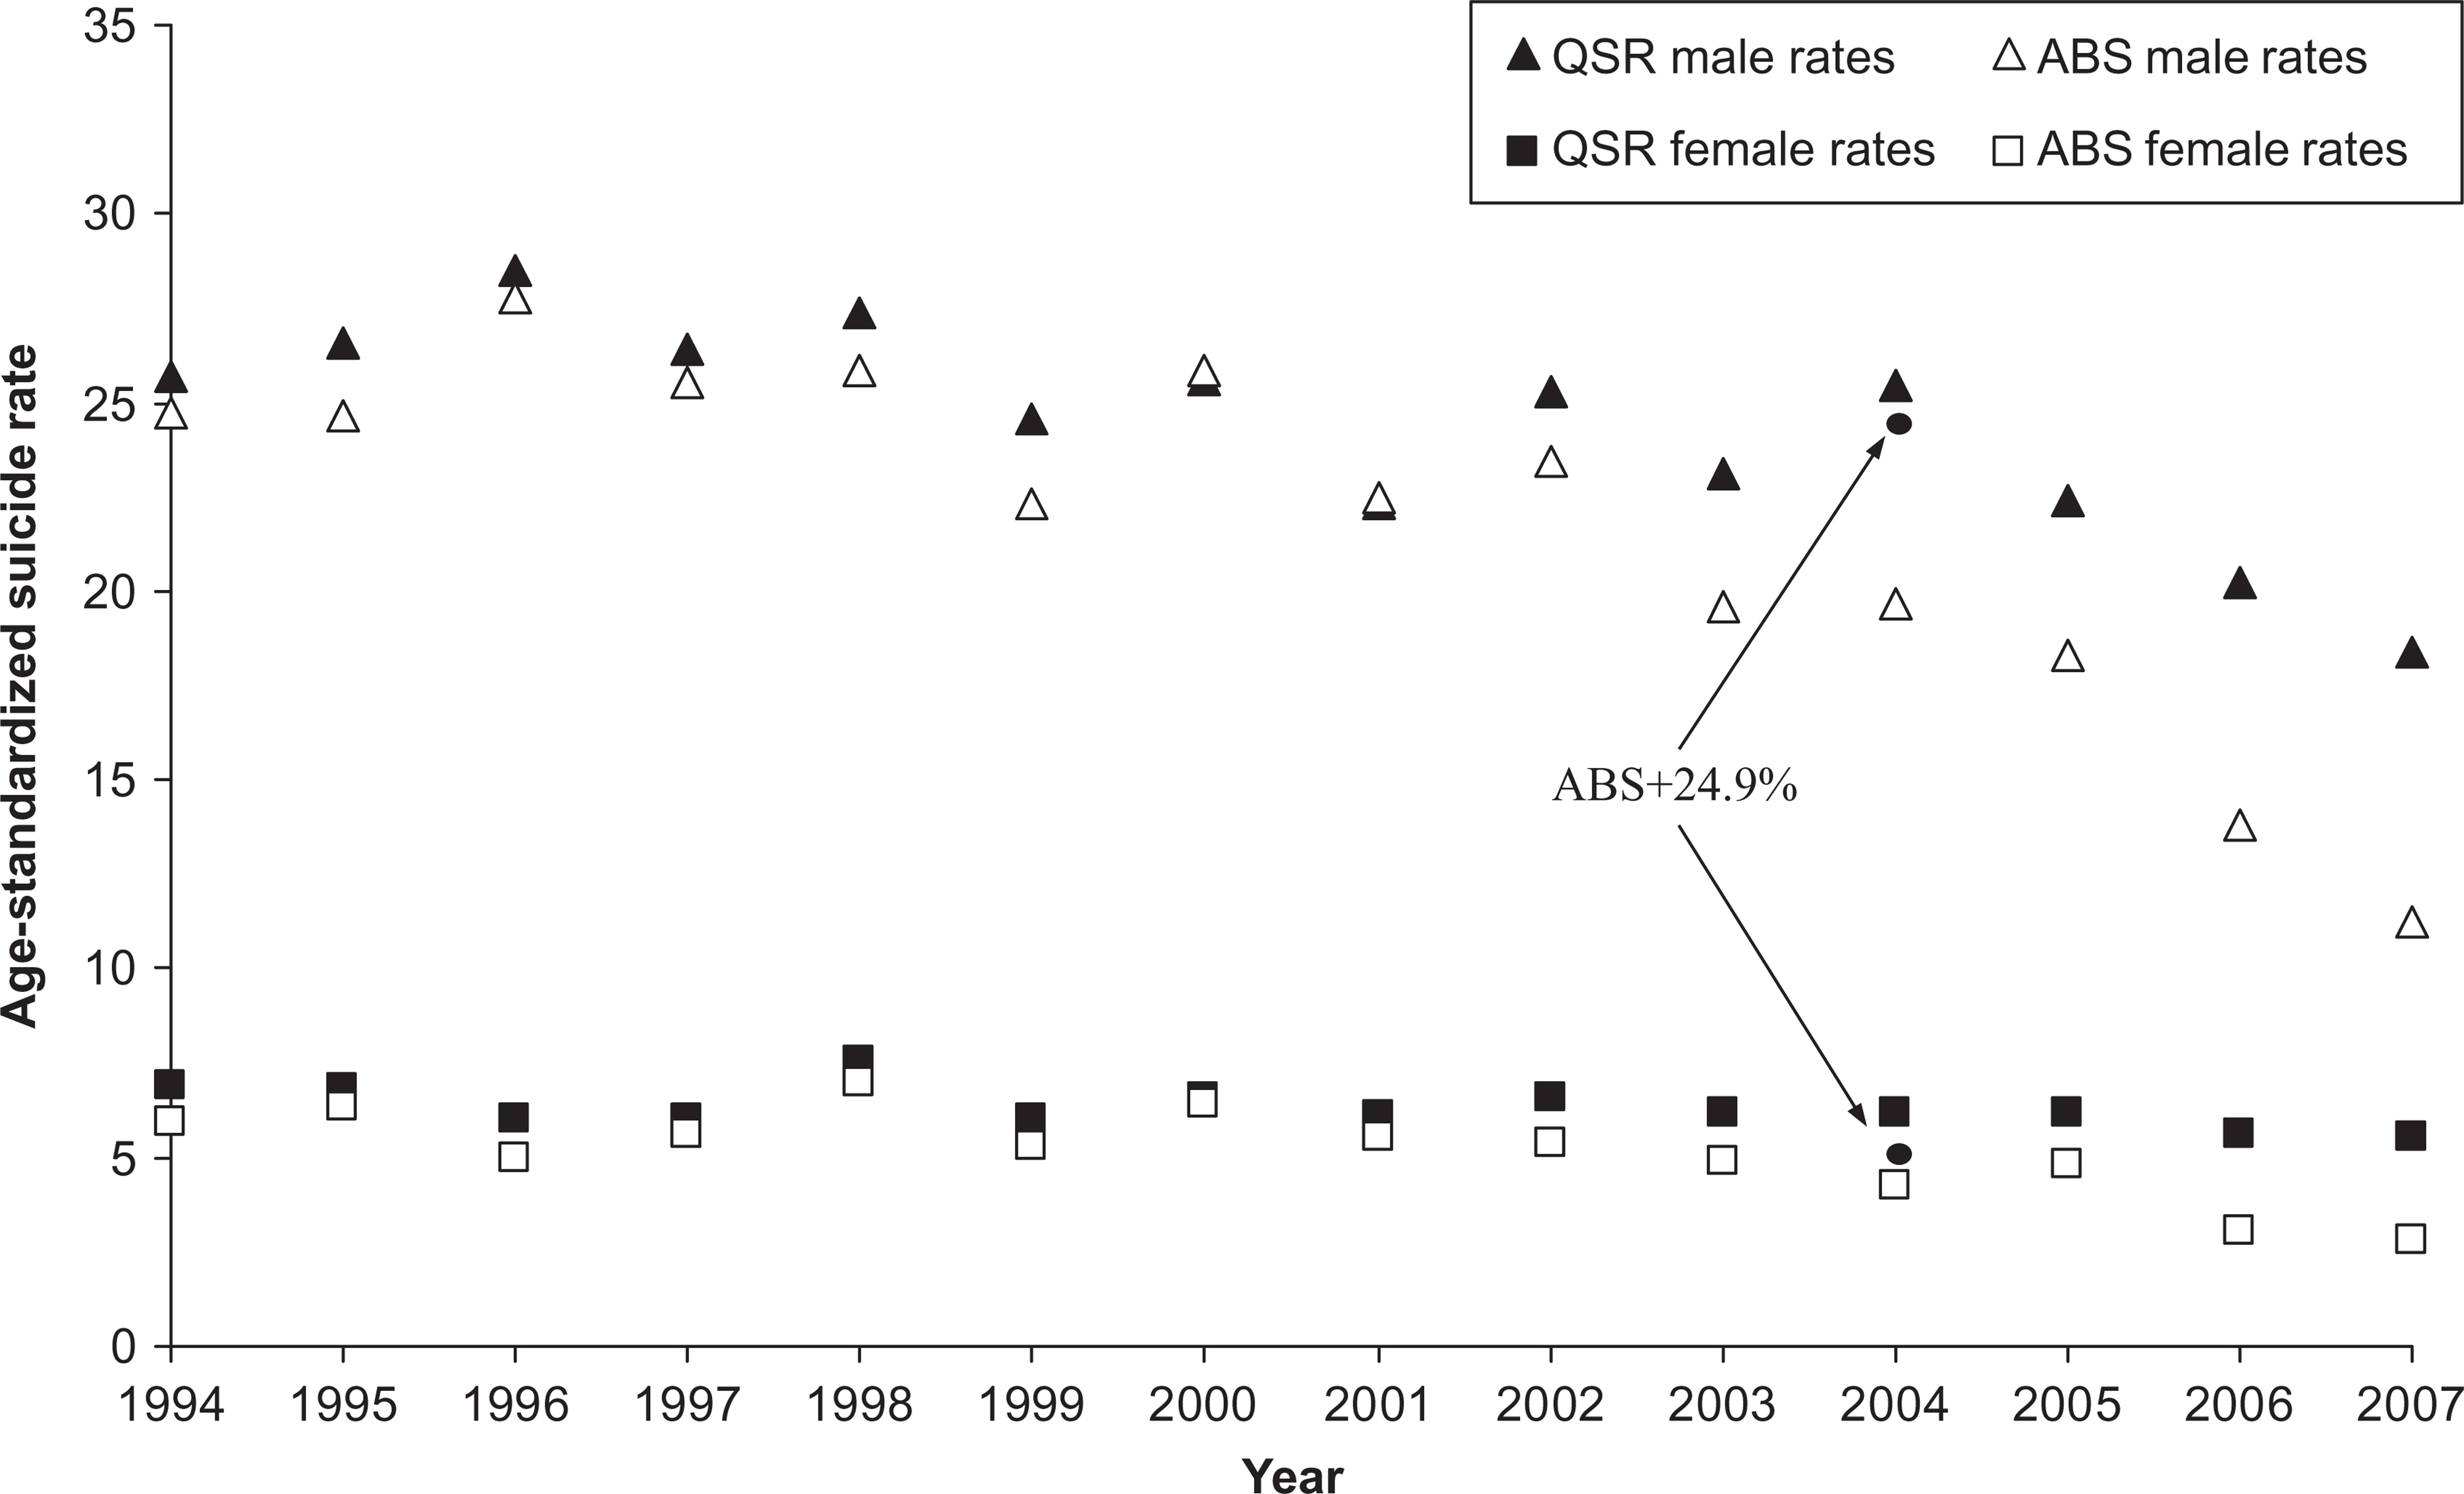
Actual suicide rates for males and females from the ABS and the QSR, and two recounts of ABS data for 2004, Queensland, 1994–2007. Queensland Suicide Register, ABS [13], AIHW [17], Harrison et al. [8]. The two circles for the year 2004, with the notation (AB+24.9%), indicate two re-calculations of the male and female suicide rates for the ABS data set, undertaken by using results in Harrison et al. [8] The suicide rates reported here are age-standardized (by the direct method) to the 2001 age distribution, and are the number of suicides per 100 000 people.
For both males and females the suicide rates based on QSR data in Figure 1 are higher than the rates derived from the ABS data. This suggests an underestimation of suicide in Queensland by the ABS. Note that the difference between the two sets of rates has been increasing since 2002, an observation emphasized before by De Leo and colleagues [5,19]. Figure 2 depicts the increasing trend in the difference between the two data sources by calculating for 1994 to 2007 the arithmetic difference between the ABS value and the QSR value for a single year, and expressing that difference as a percentage of the QSR value, in that year.
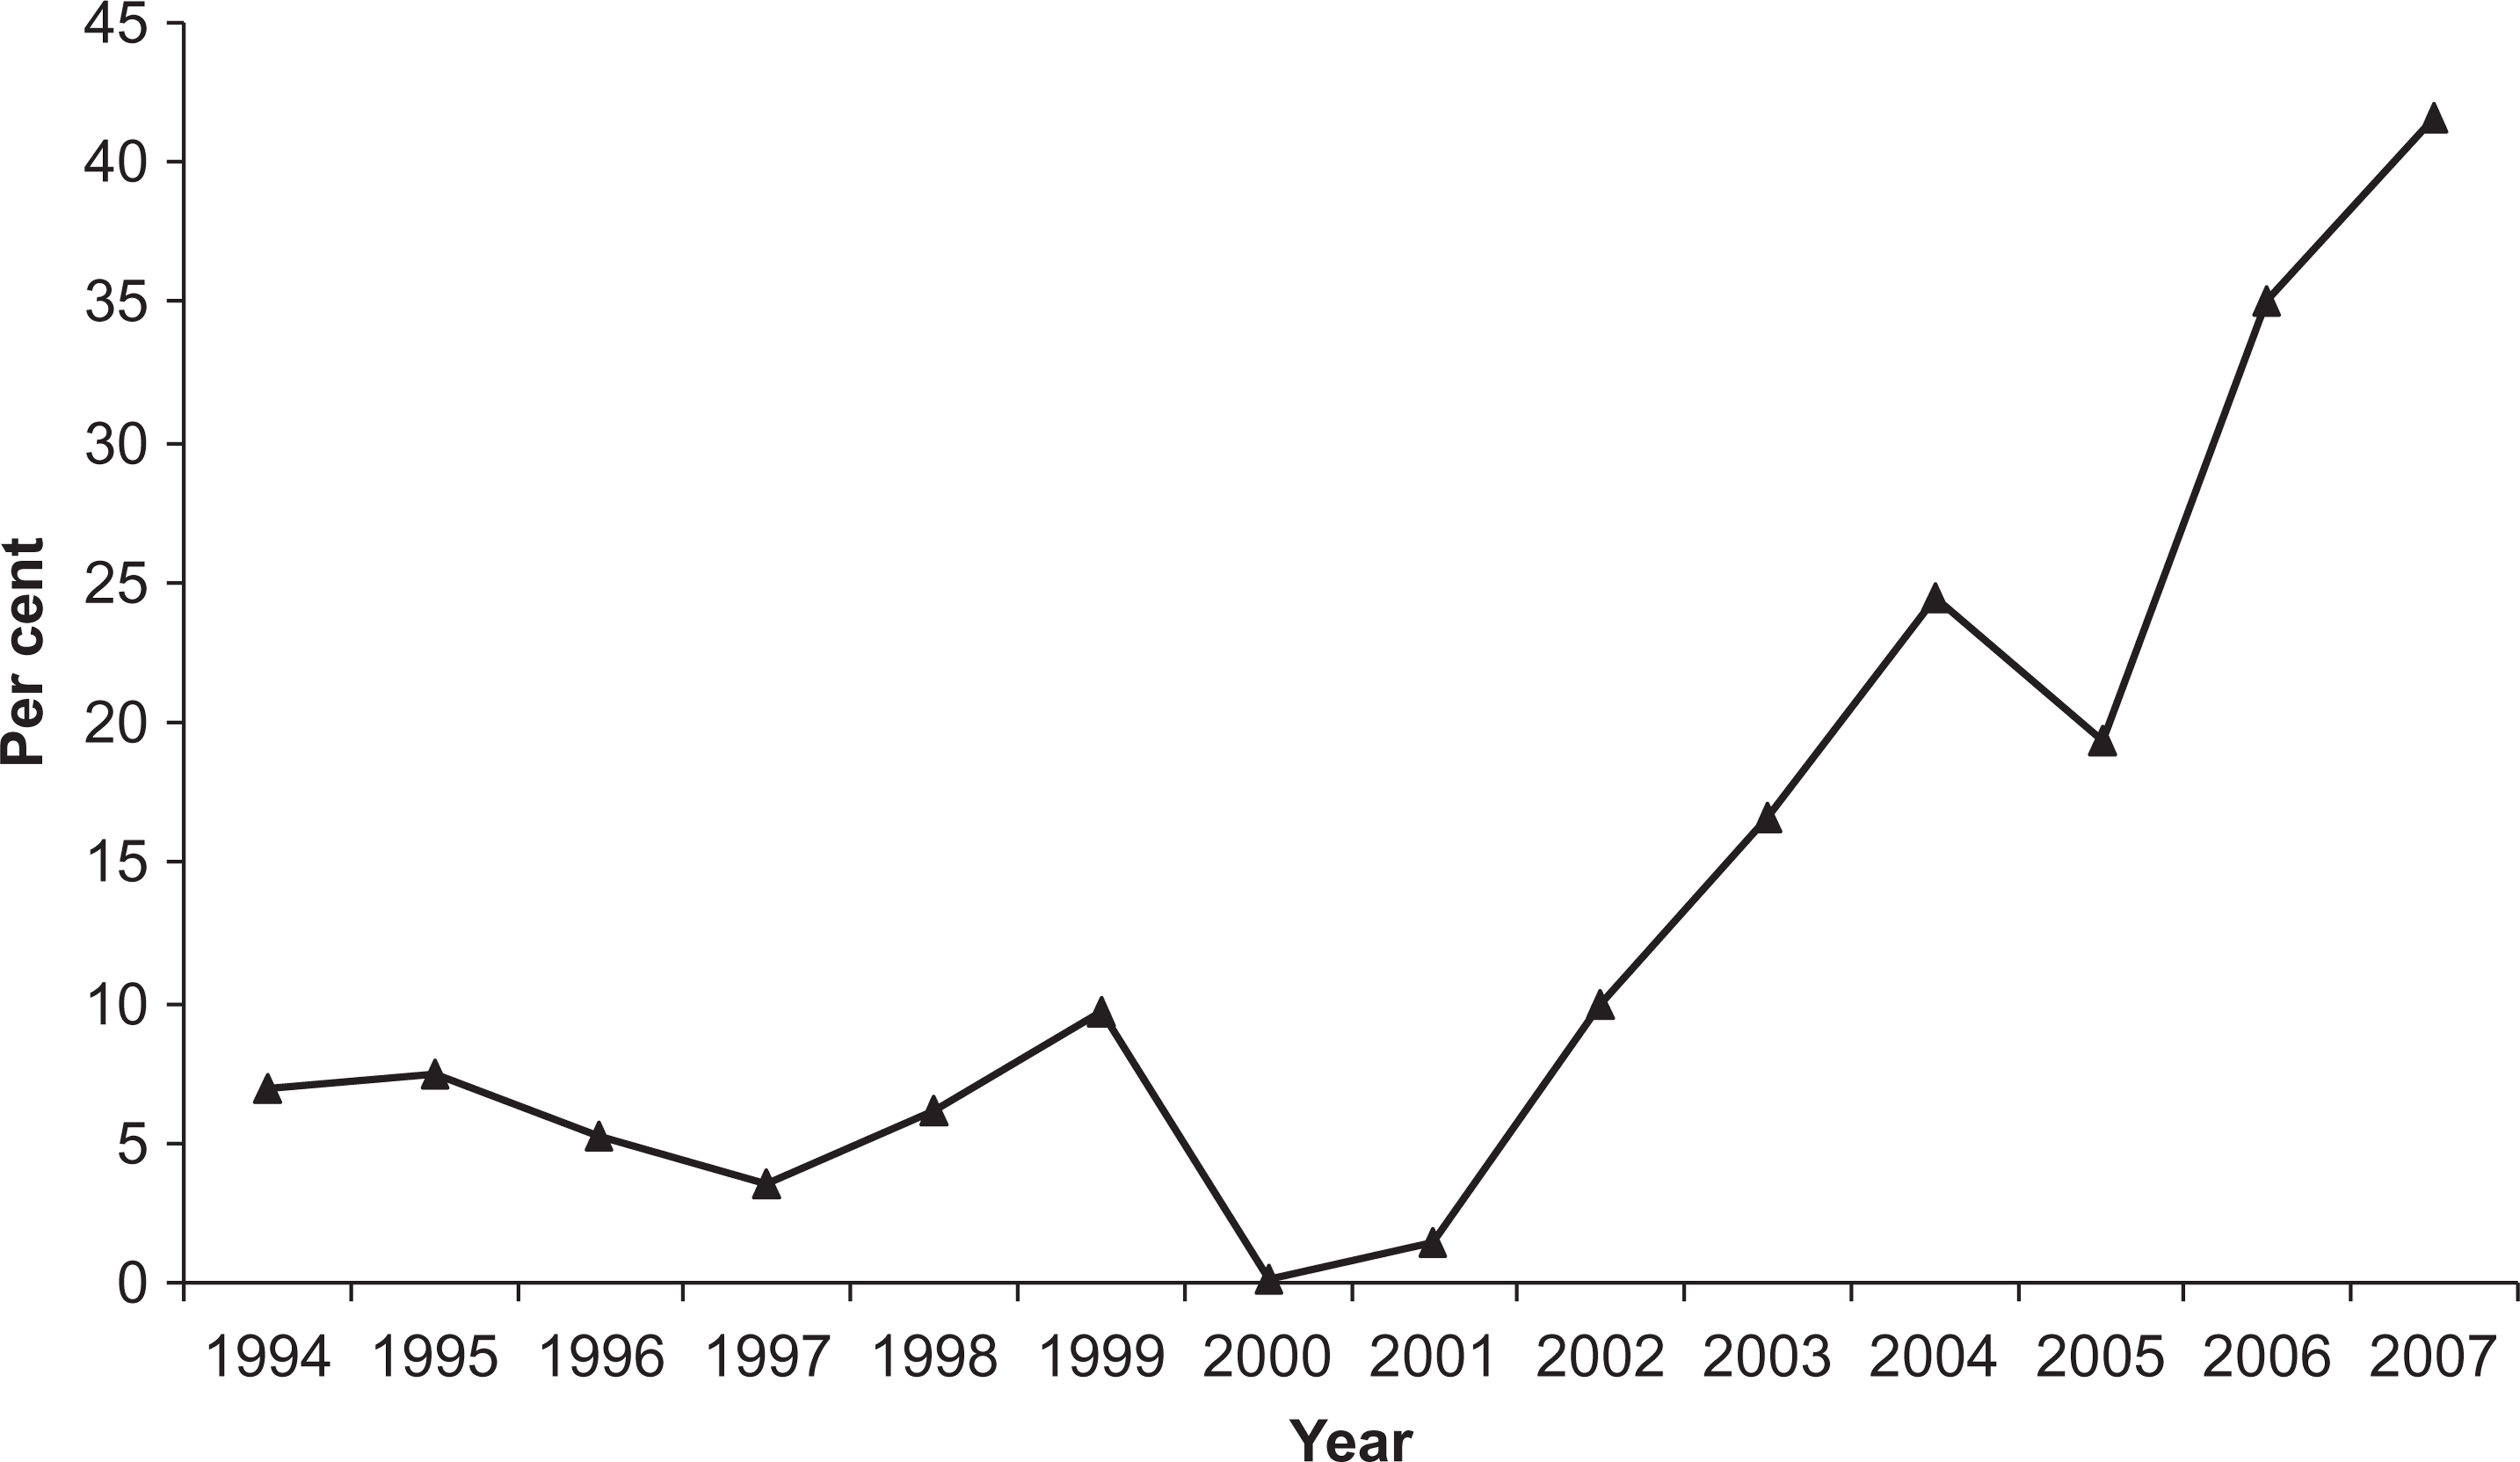
Percentage differences between ABS and QSR suicide data, persons, Queensland, 1994–2007. Queensland Suicide Register, ABS [13], AIHW [17]. The percentage differences reported here have been calculated as follows: [{[(QSARi−ABSi)/QSRi] × 100}}, where QSR
Analysis
To answer our research question we adopted the following two-stage process. First, we estimated by ordinary least squares (OLS) equations of best fit, separately for males and females, for the age-standardized suicide rates. The purpose was to obtain best fit equations that describe the data accurately, two equations for males, one for ABS data and the second estimated on QSR data and, likewise, two equations for females. The econometric package that we use is EViews [20].
To guide our statistical modelling, five diagnostic tests were applied, involving tests for serial correlation, normality of the residuals, heteroscedasticity, correct specification (of functional form) and stationarity of the residuals. We also applied the Akaike information criterion (AIC) and the Schwarz criterion. The interpretation of the results of these criteria guides model selection. The results of all diagnostic testing on the equations are important: goodness-of-fit results are a necessary, but not sufficient, indicator of the confidence that can be placed in equations from OLS estimation. For details of such processes, and the rigorous diagnostic testing which was applied to guide the modelling exercise refer, for example, to Pindyck and Rubinfeld [21] and Greene [22].
The second stage of our testing procedure is to apply the Wald test to determine whether the fitted values obtained from the two equations for males, and the two equations for females, are statistically the same. More specifically, we use the equations estimated in the first stage to obtain the fitted values for each of the 14 years of the analysis, and the Wald test was then applied to each pair of fitted values. A ‘pair’ in any year, for males, is the QSR fitted value for that year and the ABS fitted value for that same year. Thus, a pair of fitted values (QSR and ABS) was tested for difference. This testing was also undertaken for each year of the data sets of female suicide, also using the Wald test.
Results
With respect to the first step of our data analysis, equations of best fit were determined for male suicides published by the ABS, male suicides recorded in the QSR, female suicides published by the ABS, and female suicides recorded in the QSR. The estimated equations, the goodness-of-fit results, the results for the five diagnostic tests and the model selection criteria are reported in detail in Williams et al. [23]. Tables 1 and 2 summarize these results, reporting only the equations and the goodness-of-fit statistics, including the two information criteria (see above) for model selection.
Estimated time trends for suicide rates (using two measures of suicide), males. Queensland 1994–2007
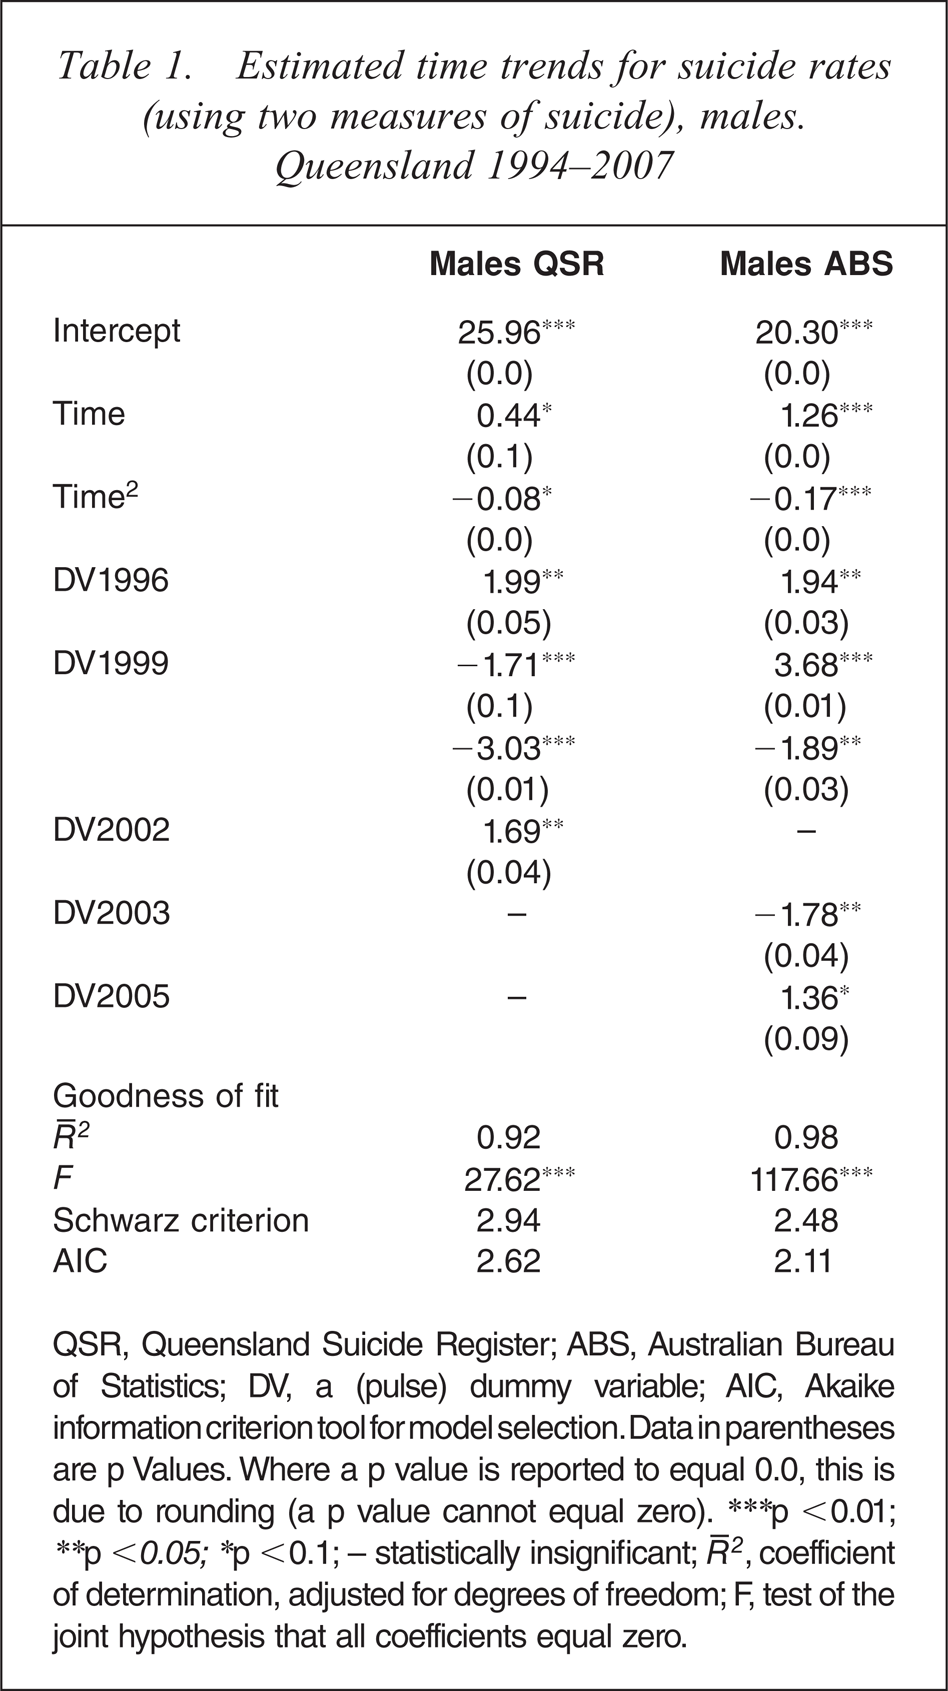
QSR, Queensland Suicide Register; ABS, Australian Bureau of Statistics; DV, a (pulse) dummy variable; AIC, Akaike information criterion tool for model selection. Data in parentheses are p Values. Where a p value is reported to equal 0.0, this is due to rounding (a p value cannot equal zero). ∗∗∗p <0.01; ∗∗p <0.05; ∗p <0.1; − statistically insignificant;  , coefficient of determination, adjusted for degrees of freedom; F, test of the joint hypothesis that all coefficients equal zero.
Estimated time trends for suicide rates (using two measures of suicide), females. Queensland 1994–2007
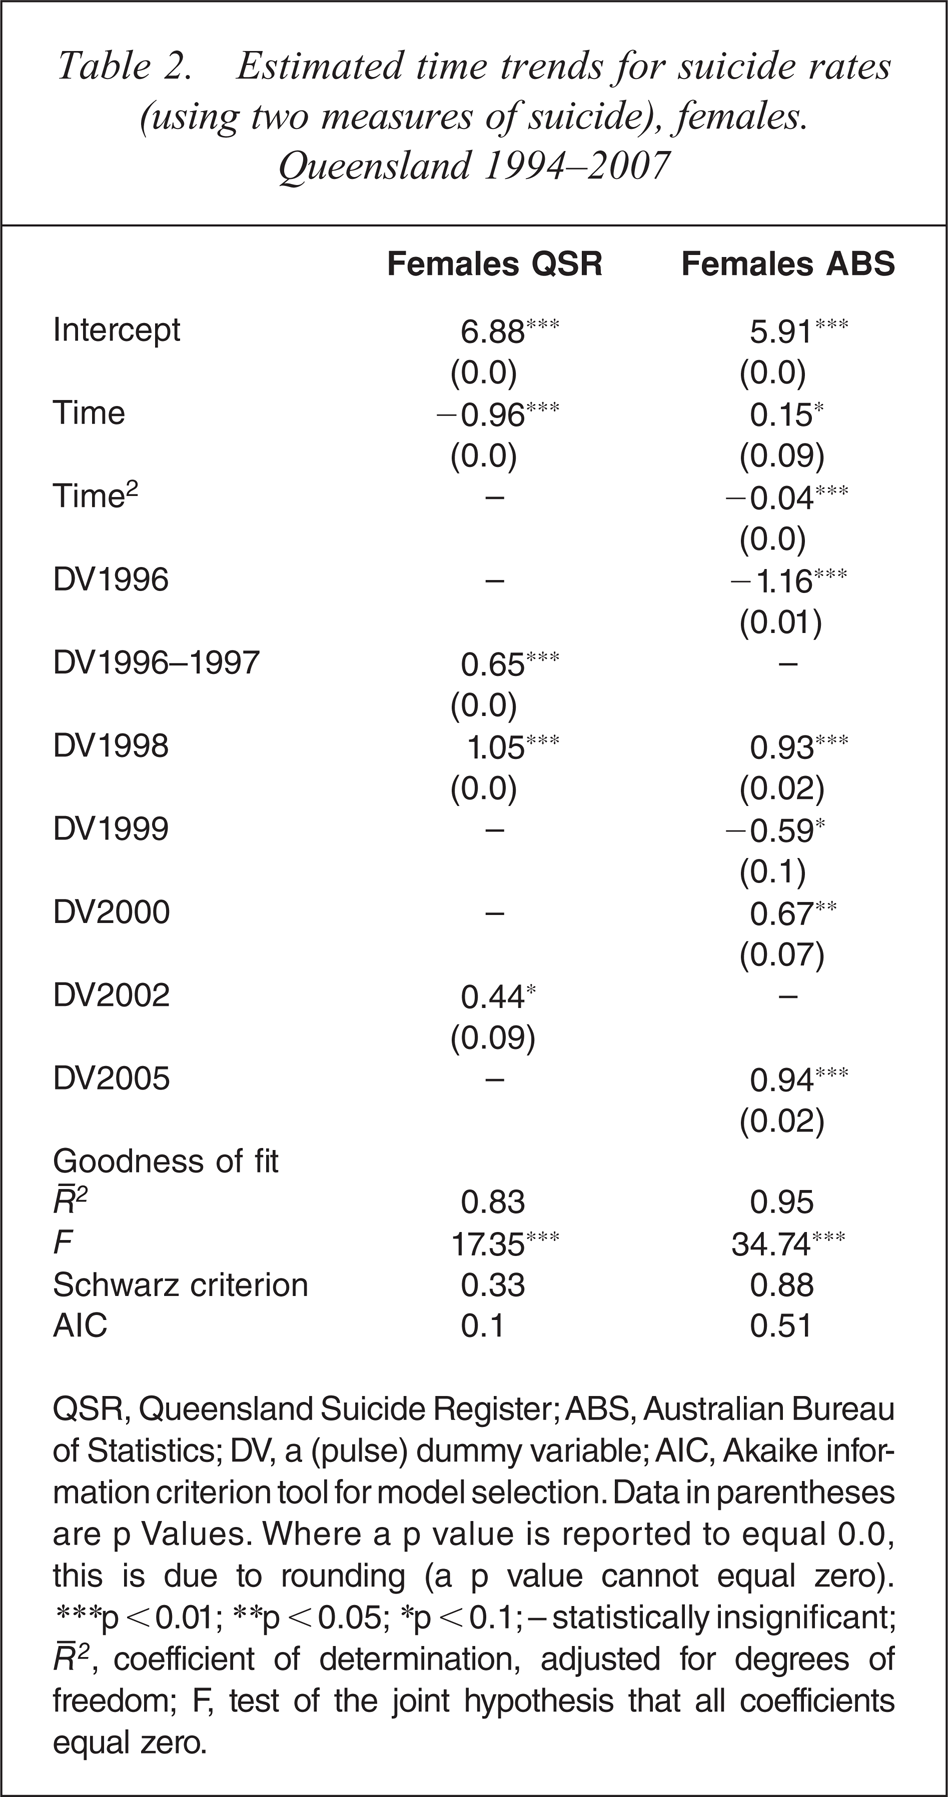
QSR, Queensland Suicide Register; ABS, Australian Bureau of Statistics; DV, a (pulse) dummy variable; AIC, Akaike information criterion tool for model selection. Data in parentheses are p Values. Where a p value is reported to equal 0.0, this is due to rounding (a p value cannot equal zero). ∗∗∗p < 0.01; ∗∗p < 0.05; ∗p < 0.1; − statistically insignificant; , coefficient of determination, adjusted for degrees of freedom; F, test of the joint hypothesis that all coefficients equal zero.
These Tables indicate that the four data sets are best described by three quadratic equations and one linear equation. The estimated equations are also indicated diagrammatically. See the two continuous, and two dotted, lines in Figure 3. That the fitted lines from our estimated equations are close to the actual observations is a manifestation of the high values of our goodness-of-fit statistics, and applying diagnostic testing to guide our estimation of the four equations.
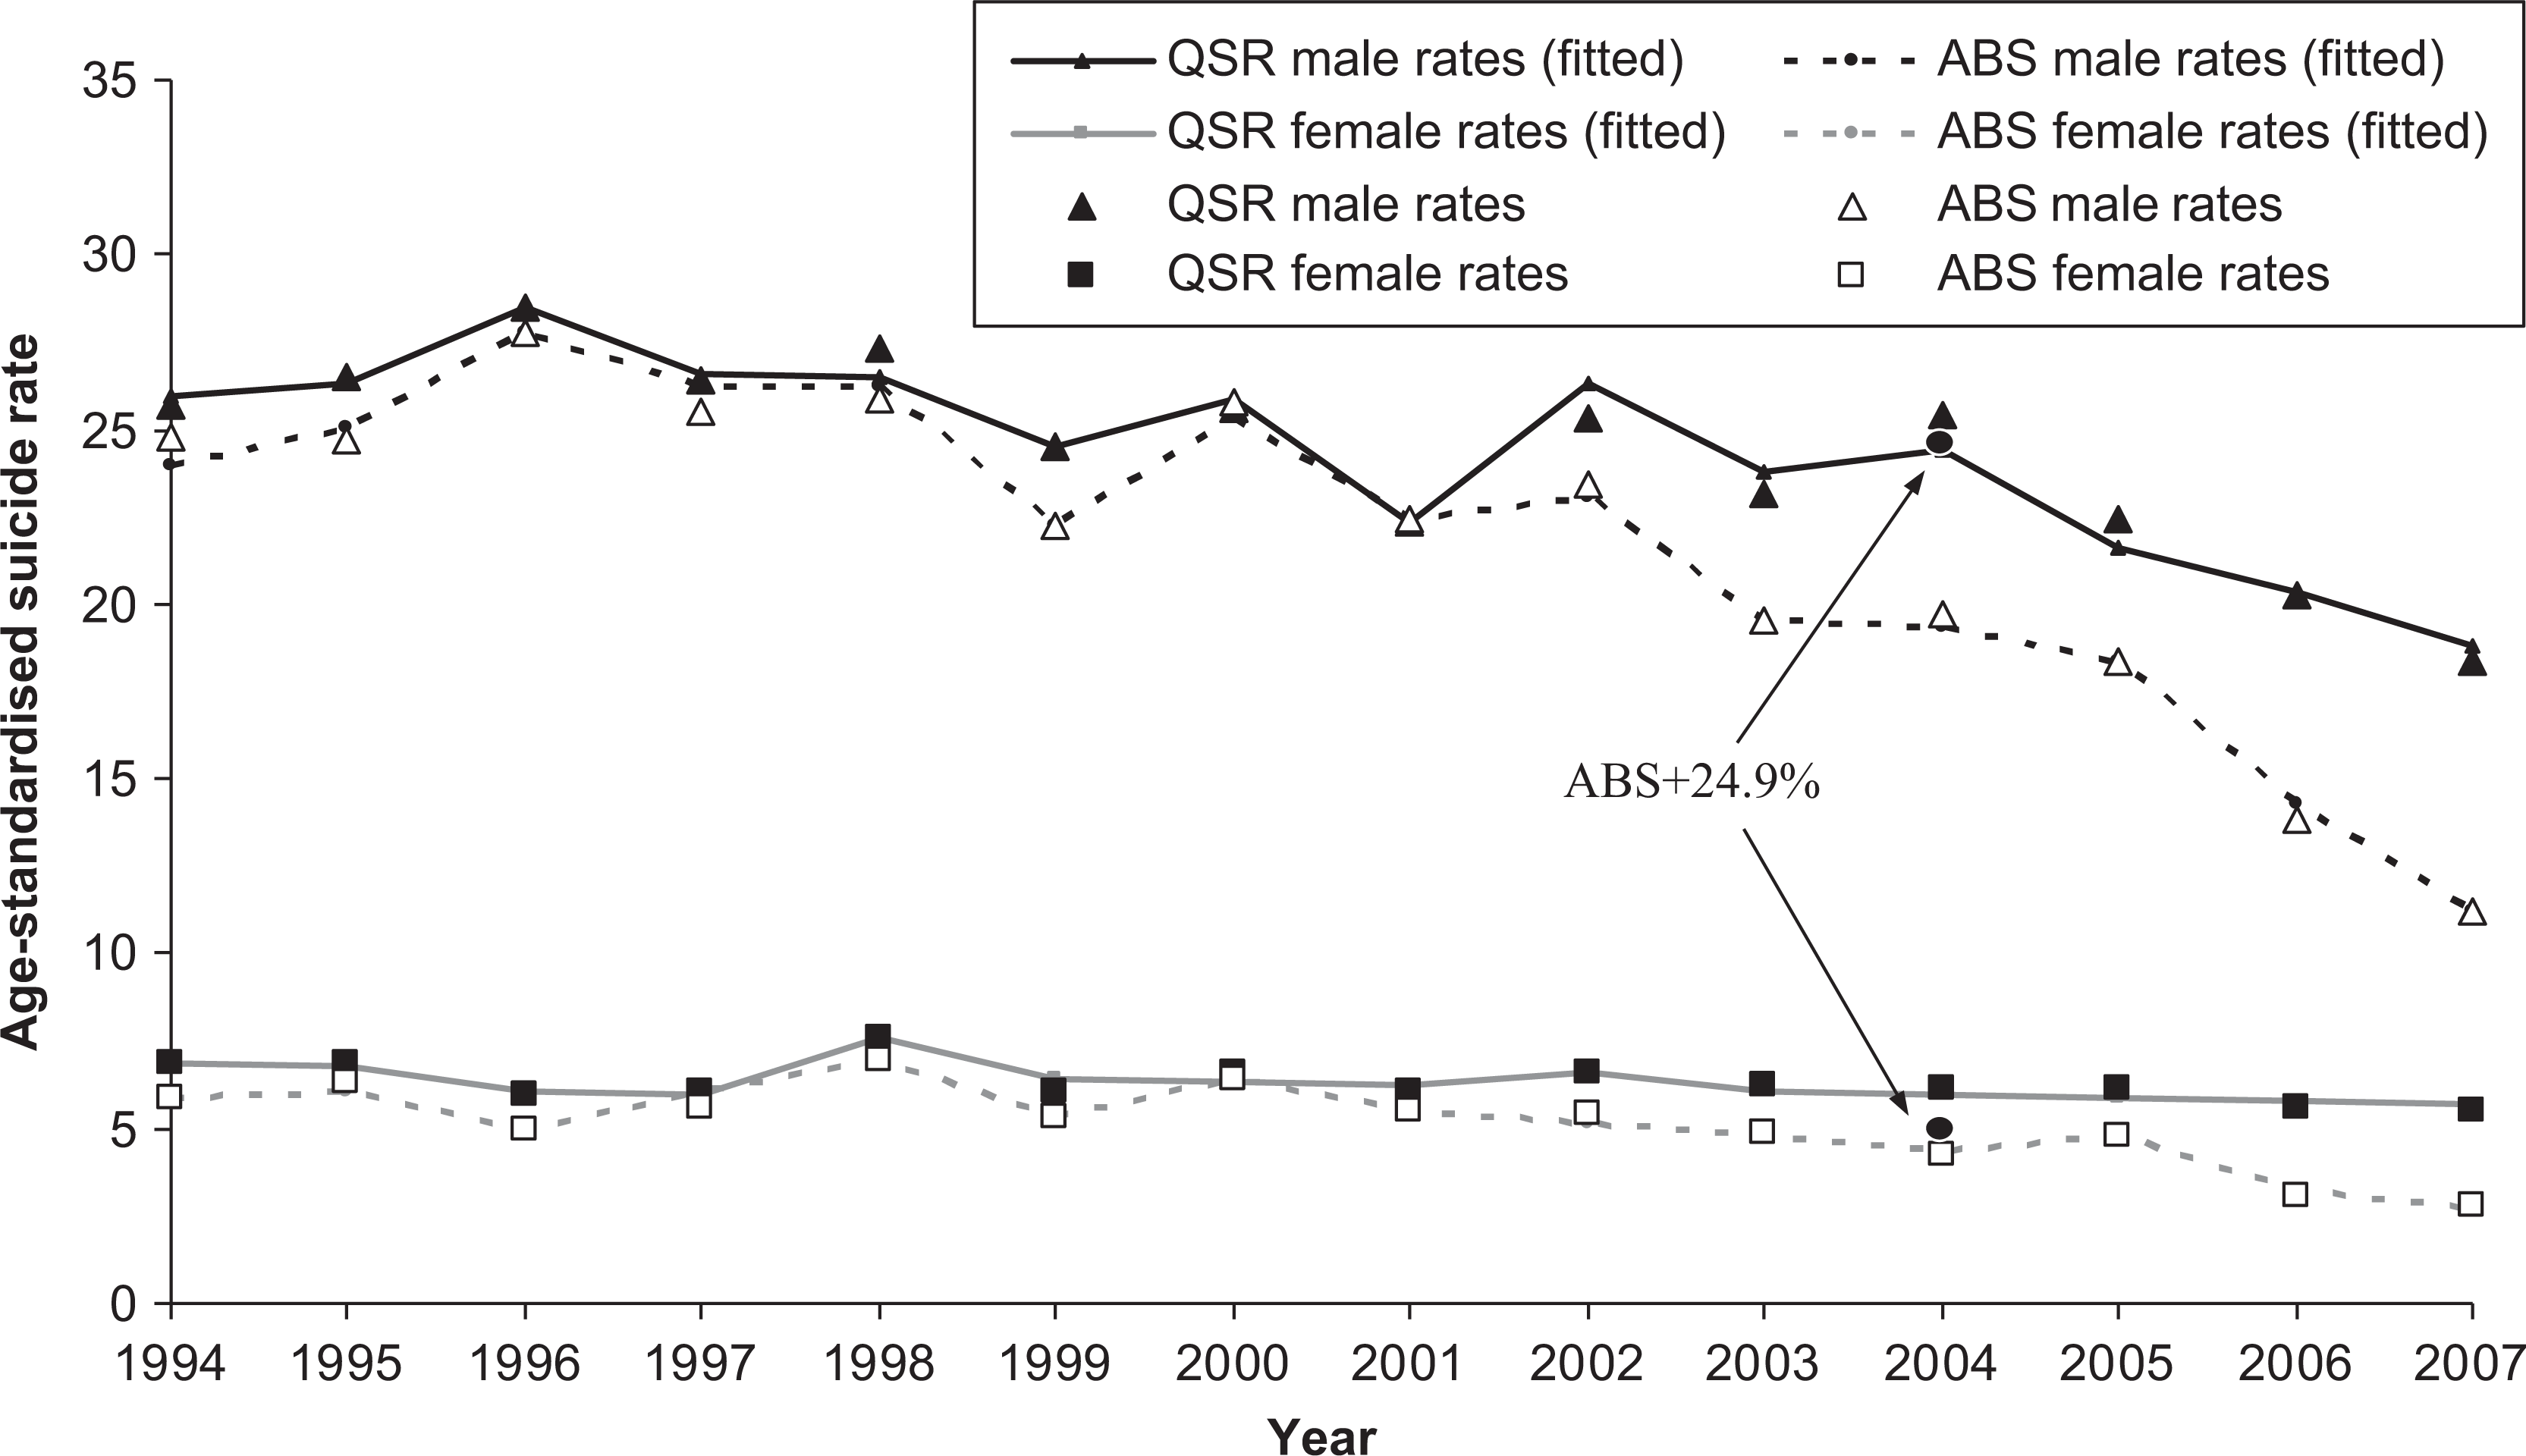
Actual suicide rates, fitted trends of suicide rates for males and females from two data sets (the ABS and the QSR), and two suicide rates based on a recount for 2004, Queensland, 1994–2007. Queensland Suicide Register, ABS [13], AIHW [17], Harrison et al. [8]. The two circles for the year 2004, with the notation (ABS+24.9%), indicate two re-calculations of the male and female suicide rates for the ABS data set, undertaken by using results in Harrison et al. [8]. The suicide rates reported here are age-standardized (by the direct method) to the 2001 age distribution, and are the number of suicides per 100 000 people. Calculated from equations reported in Tables 1 and 2.
An important characteristic of our estimated equations is that they all have falling trends through time. This is true for all equations, i.e. for the three quadratics, and for the single linear equation. It is important to keep in mind that our analysis is restricted to 14 relatively recent years: there are quite different trends for longer time-series data on Australian suicide rates [24, for the second stage of our analytic strategy, the estimated equations reported above were used to produce two sets of pairs of fitted values (QSR and ABS), for males and for females, for the 14 years analysed here. The Wald test results for both males and females are presented in Table 3. Columns (ii) and (iii) present the p values for the 14 comparisons. In the case of male suicide, the QSR data set produces statistically different results (higher) compared to the ABS in 11 of the 14 comparisons. For females, the results are even more striking: there are statistically different results for 13 of the 14 years analysed here. These tests clearly indicate that the extent of the differences, believed to exist between the ABS and QSR data sets, is not trivial.
Wald test results for the hypothesis that fitted values from estimated equations of suicide rates, from ABS data and QSR data are equal, Queensland, males and females, 1994 to 2007
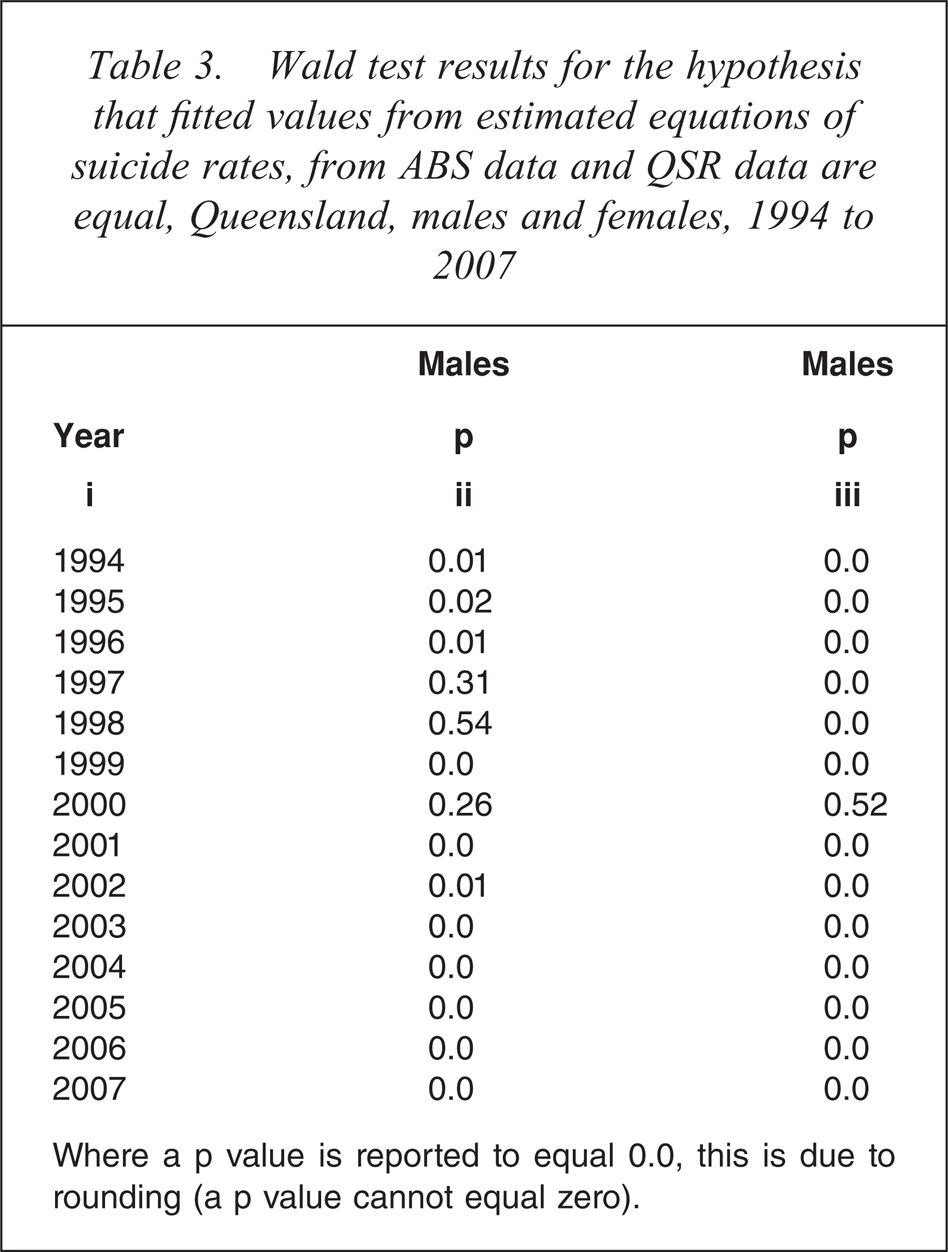
Where a p value is reported to equal 0.0, this is due to rounding (a p value cannot equal zero).
Discussion
There has been disquiet for some years about the accuracy of Australian suicide data as published by the ABS. The Australian Government, like many comparable countries (the USA, the UK, New Zealand, etc.), has instituted a suicide prevention programme to address the problem of suicide. Not surprisingly, governments look at suicide rates as the main outcome measure to determine the efficacy of their policies. In a policy evaluation context, the place and importance of accurate data must not be under-rated. It is important also to keep in mind that this study has been concerned with the accuracy of the conventional suicide measure (the headcount) in Australia. Elsewhere, it has been established that the potential years of life lost (PYLL) measure is another important measure of suicide in the policy evaluation context [26, 27].
This study has provided a unique test of the accuracy of published ABS suicide data for Queensland. This state is the only jurisdiction for which an independent data set for suicide mortality exists. The QSR explicitly recognizes various uncertainties surrounding suicide, and in cooperation with various governmental bodies, implements a process involving psychological autopsy information. The differences between the ABS and the QSR are several, and include distinctions in definitions of suicide (the former involves a legalistic or jurisprudential approach whereas the latter applies a more suicidological conception), coding of suicide cases, and timing of data collection processes.
However, despite these changes, in recent years the divergence in the datasets has increased. From 2002 on, sharp divergences became evident. It is hypothesized that the creation of the NCIS, a much-needed institution for the process of standardizing death certification procedures in the country, might have induced some growth-related problems which interfered with routine management of mortality data. Governmental funds, resource allocation, and recording procedures, could have all been influenced by the development of the NCIS. As openly stated by the ABS, for example, visual inspection at coroners’ offices to control for uncertain cases had completely ceased in 2006 [13]. This procedural change meant that the ABS was relying entirely on NCIS computerized data for their classification of suicide.
In any case, for all 14 years analysed here, the QSR indicated higher Queensland suicide rates than the ABS. Statistical tests undertaken to determine whether the differences between the two data sets are significant indicated that, in very large measure, those differences are indeed significant. Of the 28 pair-wise comparisons reported here (14 for males and 14 for females), 24 were found to involve statistically significant differences. In addition, it should be noted that the QSR produces a slightly higher suicide rate also for the year 2004, a year for which a recount of ABS suicide data has been undertaken by Harrison et al. [8].
It is hoped that a system similar to the QSR is adopted for the rest of Australia. The need for standardized reporting of suicide in Australia is recognized [9] and thus a study of the obstacles to such reporting, particularly those that exist across Australia's States and Territories, would be a useful exercise.
Footnotes
Acknowledgements
We are very grateful for a point of technical advice provided by Abbas Valadkhani, School of Economics, University of Wollongong, in analysing the data herein. The paper has also been revised in the light of the detailed comments by two anonymous reviewers. Needless to say the authors are solely responsible for any remaining errors.