
Abstract
Guided by QuantCrit, we examine academic outcomes and access to opportunity for Native Hawaiian and Pacific Islander (NHPI) students. Using a longitudinal administrative dataset from a large urban district in California, we find that NHPI students are significantly underrepresented and disadvantaged across all achievement measures (e.g., grade point average, standardized test scores, scholastic assessment test [SAT]), and opportunity indicators (e.g., advanced coursework and SAT participation), with disparities persisting over time. By uncovering these overlooked inequities, we advocate for more thoughtful, nuanced understandings of NHPI students’ educational experiences—grounded in the distinct racialization of Asian American and NHPI communities. This study highlights the need for positioning data equity as foundational to social justice.
Keywords
While existing qualitative research highlights the challenges NHPI students face—and how cultural heritage, community, and identity shape their development (Mayeda & Okamoto, 2002; Vaught, 2011)—there remains a limited understanding of their academic achievement and opportunity gaps, largely due to the continued use of aggregated data. A few studies have begun to shed light on this issue. The Institute of Education Sciences reported that NHPI students perform at lower proficiency levels in eighth-grade achievement compared to other racial and ethnic groups (Hammond et al., 2011). Pang et al. (2011) found that when AANHPI subgroups were disaggregated by ethnicity, significant achievement gaps emerged in eighth-grade state standardized test scores between White and NHPI students, as well as between NHPI and their AA peers. Nguyen et al. (2019) further revealed that NHPI students experience disciplinary actions at nearly twice the rate of White students. Though limited, these studies underscore the urgent need for disaggregated data to advance data equity and more effectively support NHPI students. While some schools, districts, institutions, and states—along with federal data bases such as Common Core of Data, EDFacts, and Integrated Postsecondary Education Data System—now separate NHPIs from AA, and have highlighted significant differences in areas such as poverty (U.S. Census Bureau, 2012) and degree attainment (Pillai et al., 2023), NHPI communities are still routinely folded into the broader “Asian” label in public discourse (Lee & Ramakrishnan, 2020). Moreover, even where disaggregation exists, too little attention is paid to how those data are reported and leveraged to support NHPI students, leaving them overlooked in policy and research (Morey et al., 2022).
Building on this foundation, our study contributes to the scholarship by asking: How do the academic achievements and educational opportunities of NHPI students compare to those of their AA peers? Using exploratory descriptive analysis, we examine achievement through multiple indicators—grade point average (GPA), standardized test scores, and scholastic assessment test (SAT)—representing school-, state-, and national-level achievements, respectively. We define educational opportunity as participation in advanced coursework and whether students have taken the SAT. By examining both academic outcomes and access to opportunity, this study aims to present a more accurate and nuanced picture of NHPI students’ educational experiences.
Our study is informed by the principles of quantitative critical race theory (QuantCrit), which extends critical race theory into quantitative research to illuminate and challenge systemic inequities embedded in data practices (Gillborn et al., 2018). In particular, key tenets from QuantCrit—such as categories are not natural or given, numbers are not neutral, data cannot speak for itself, and numbers can be used for social justice—have heavily informed our thinking and approach. We draw on QuantCrit to guide our approach and critically engage with how data—particularly the aggregation of AANHPI student groups—can obscure the unique experiences of NHPI students. As noted by Chou and Feagin (2015), the aggregate AANHPI category superficially groups AANHPIs when “there is no identity of nationality or cultural background among Asian and Pacific Islander Americans that creates such commonality” (p. ix).
Moreover, grounded in QuantCrit—which treats racial categories as social constructions—our NHPI–AA comparison reveals disparities obscured by data aggregation, avoids cross-racial benchmarks that can inadvertently reinforce deficit views of minoritized communities, and challenges dominant racial narratives. By doing so, our study seeks to advance data equity in a way that not only raises awareness of NHPI students’ diverse educational journeys but also promotes equity-driven solutions that address systemic barriers and ensure these students receive the support they need to thrive (Shih et al., 2019).
Method
Data
This study draws on longitudinal data from a large urban school district in California that serves a racially and ethnically diverse student population. Hispanic students comprise the largest racial/ethnic group in the district, followed by Black and White students. AA students account for approximately 5% of the district student population, and NHPI students represent approximately 0.5%. Our data span 8 years, from 2015 to 2022, and include students from Grades 6 to 12.
Aligned with QuantCrit’s tenet that data reflect power structures, we included both academic performance and opportunity indicators to capture often-overlooked dimensions of educational experience. To examine NHPI students’ academic performance, we used three measures: students’ cumulative GPA by 11th grade, the state’s standardized test—smarter balanced assessment (SBA)—in English language arts (ELA) and Mathematics at 11th grade, and students’ highest SAT score during high school years. These measures capture school, state, and national-level academic performance. To assess NHPI students’ educational opportunities, we focused on two measures: the percentage of students who never earned credits in AP courses and the percentage who never took the SAT during their entire high school years (hereafter called Never AP% and Never SAT%, respectively). These measures reflect disparities in access to college preparatory coursework and assessments.
For the analysis, we used samples based on the nature of the measures. For GPA and SBA scores, we constructed repeated cross-sectional data by year, including all NHPI and AA students in 11th grade from 2016 to 2022, to ensure consistency in grade comparison and capturing trends over time. On average, the district serves approximately 25,000 11th grade students each year, including about 1,400 Asian students and 120 NHPI students. For students’ highest SAT scores, never AP%, and never SAT%, we constructed data by cohort, based on five public high school cohorts for which we have complete transcript data, allowing for a comprehensive evaluation of students’ high school trajectories and opportunities. These cohorts entered high school between 2015 and 2019, and our data cover their full high school transcript records. A cohort is defined by the first high school each student attended, as recorded in the district’s data. Each cohort consists of approximately 31,400 students, including around 1,700 Asian students and 160 NHPI students. Please refer to Supplemental Appendix Table A1 for descriptions of the variables used in the study.
Analyses
We first provide descriptive statistics for all measures and test group differences. For continuous measures in academic performance, we conducted independent sample t-tests; chi-square tests are used for binary-coded educational opportunity variables. This initial analysis allowed us to identify overall patterns and variations in academic performance and educational opportunities between AA and NHPI students. Second, we present these patterns across years and cohorts to provide a more comprehensive longitudinal view of trends in educational outcomes and access to opportunities. This step highlights whether disparities in NHPI and AA students persist, widen, or narrow over time. Lastly, we employed regression analyses to examine disparities while accounting for key individual and contextual factors. In particular, we incorporated student-level control variables, including gender, poverty status, English learner status, and special education status, to account for individual differences. The selection of these variables is in line with QuantCrit, which recognizes that such factors are shaped by broader structural inequalities. Inclusion of these variables is not intended to control away such inequalities but to acknowledge how multiple dimensions of disadvantage influence students’ academic opportunities and outcomes. We used AA students as the base group to reflect their shared classification with NHPI students in public and policy discourse. Importantly, while this article centers NHPIs and compares them to AAs, “Asian American” is not monolithic, comprising ethnic roots from more than 20 countries. Readers should avoid interpreting AAs as a uniform “model minority” and recognize the substantial intra-group diversity and educational disparities (Lee et al., 2025).
Additionally, we employed fixed effects models—we first included high school fixed effects to account for variations in unobserved attributes across schools, such as facilities or AP course availability; we then incorporated either year or cohort fixed effects depending on the outcomes. For GPA and SBA scores, we applied year fixed effects, reflecting the year in which students were tested in 11th grade; for highest SAT score and opportunity measures of never AP% and never SAT%, we used cohort fixed effect, reflecting each student’s full high school experience based on their entry cohort. This approach allowed us to adjust for unobserved characteristics consistent across groups of students and to account for structural differences in school contexts, aligning with QuantCrit’s recognition that inequality is embedded in educational systems.
For ease of interpretation and comparison, measures of GPA, SBA scores, and SAT scores were standardized in tables and figures. Standardization was computed by year across our analytic sample with a mean of zero representing the average of AANHPI students for a particular year. For binary outcome measures—never AP% and never SAT%—we employed logistic regression and report odds ratios for better interpretation. Descriptive statistics for AA and NHPI students on the original scale are provided in Supplemental Appendix Table A2.
Results
Overall, we found that disparities in educational outcomes for NHPI students persist across all measures when compared to AA students throughout their schooling. As shown in Table 1, NHPI students exhibit lower average GPA, SBA, and SAT scores compared to their peers, scoring on average 0.7 standard deviation (SD) below AA students. Results from independent sample t-tests indicate statistically significant group differences, highlighting disparities in academic performance. Notably, the percentage of NHPI students who have never earned AP credits is nearly double that of AA students; and the percentage of NHPI students who have never taken the SAT is 20% higher than that of AA students, further underscoring these opportunity gaps. Chi-square test results confirm statistically significant differences between AA and NHPI students in educational opportunities.
Educational Outcomes of NHPI and AA Students

Note. N represents the overall sample, which includes both AA and NHPI. For GPA and SBA, N refers to 11th-grade students from the 2015 to 2022 cohorts. For SAT, Never AP%, and never SAT%, N refers to students from the 2015 to 2019 cohorts. N is rounded up to the nearest 10. NHPI = Native Hawaiian and Pacific Islander; AA = Asian American; AP = advanced placement; GPA = grade point average; SAT = scholastic assessment test; SBA = smarter balanced assessment; ELA = English language arts.
To examine the persistence of such disparities, we present longitudinal data on the educational outcomes of NHPI and AA students. Figure 1 illustrates these disparities over time, highlighting gaps in both academic performance and educational opportunities. Specifically, disparities in GPA, SBA scores in ELA and Math, and SAT scores are displayed in Panels A, B, C, and D, respectively, while Panels E and F depict gaps in educational opportunities, capturing the percentage of students with no SAT experience and no AP credits earned. The results reveal that gaps between NHPI students and their AA peers persisted over 7 years, underscoring the systemic nature of these inequities. Notably, the gap in the percentage of students who never took the SAT between NHPI and AA students narrowed for the 2019 cohort, coinciding with this district’s new policy that year to offer the SAT free of charge. While disparities remain, removing financial and logistical barriers may have contributed to increased SAT participation among NHPI students, helping to narrow opportunity gaps.
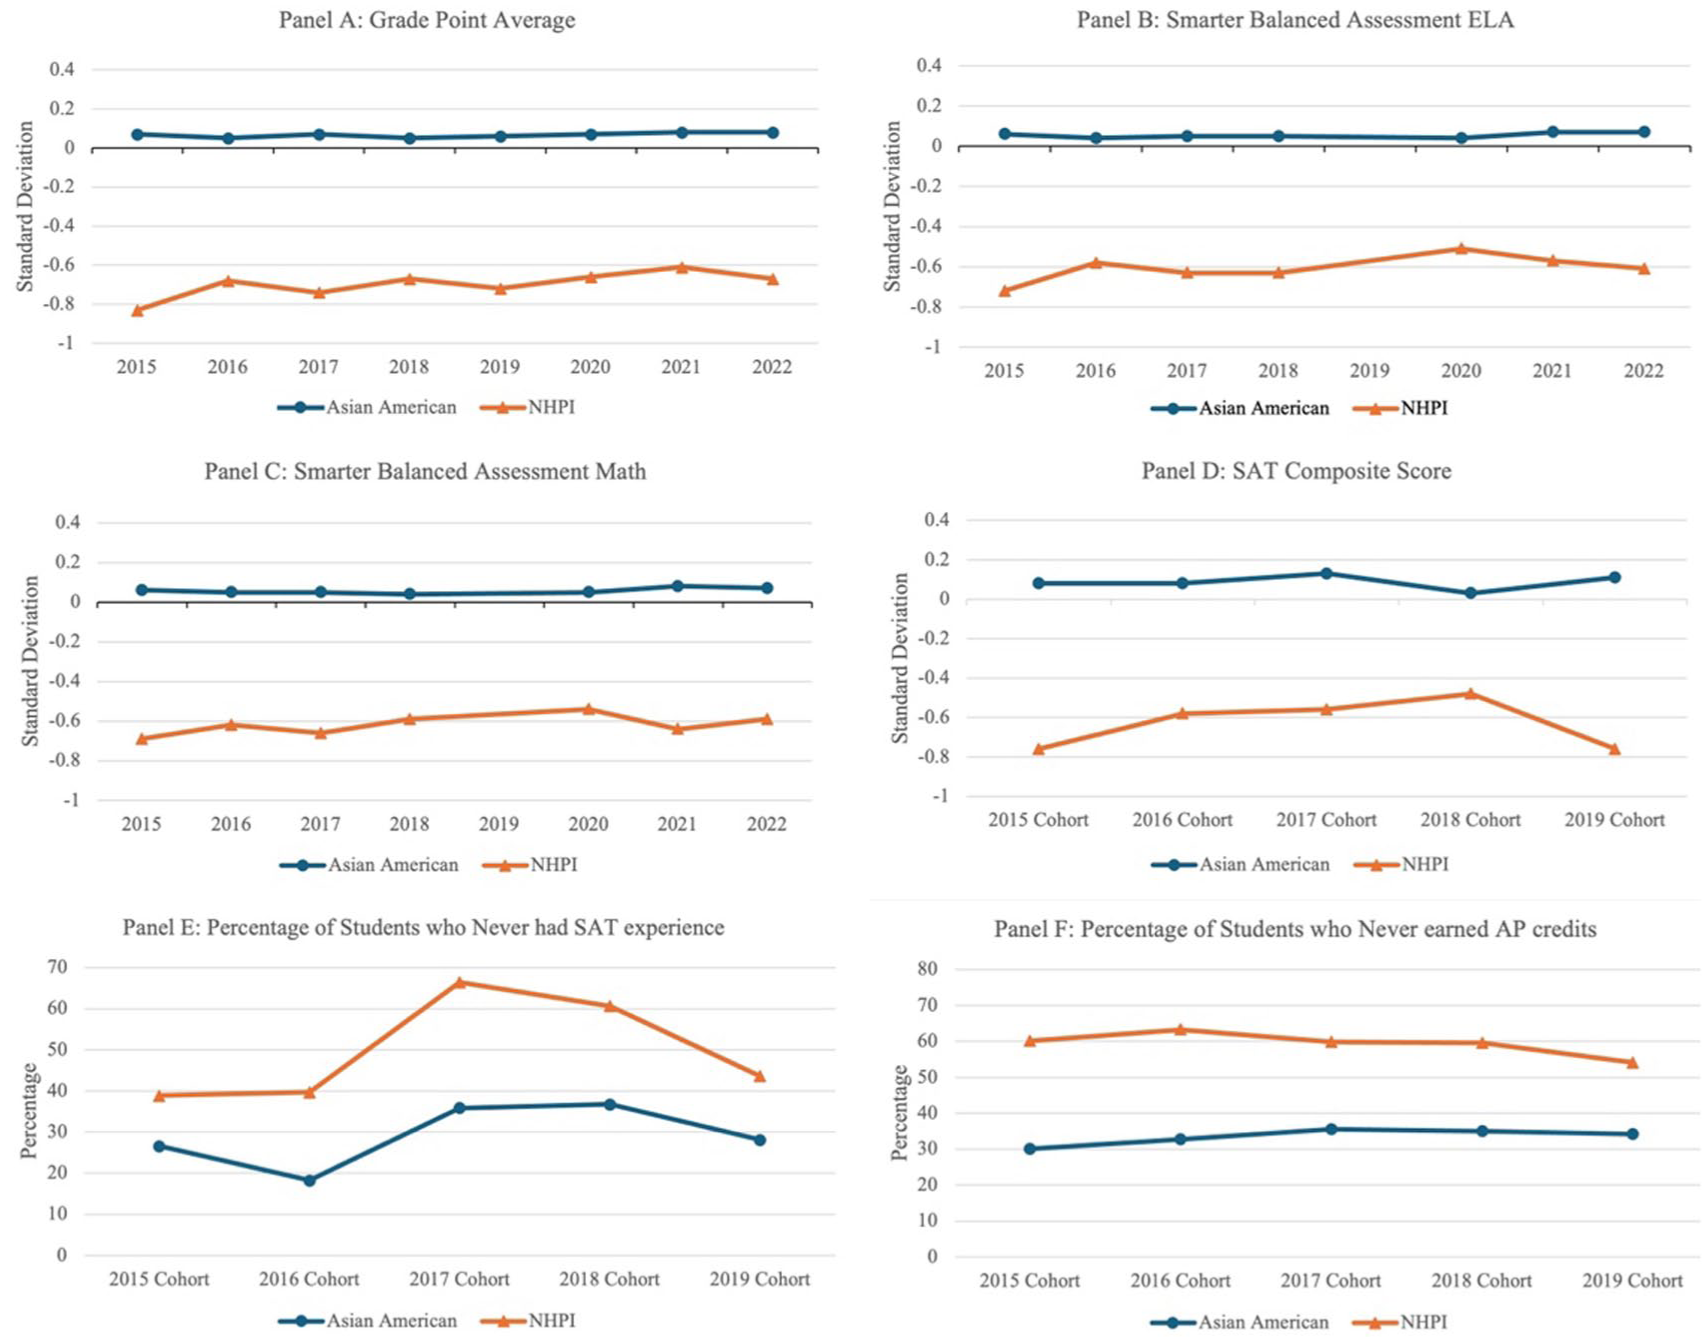
Educational outcomes of NHPI and AA students by year/cohort. Six Educational Outcomes: Panel A: Grade Point Average, Panel B: Smarter Balanced Assessment ELA, Panel C: Smarter Balanced Assessment Math, Panel D: SAT Composite Score, Panel E: Percentage of Students who Never had SAT experience, Panel F: Percentage of Students who Never earned AP credits
Our regression analysis, which incorporated student control variables and year/cohort and school fixed effects, is presented in Table 2. Findings align with the t-tests and chi-square tests results in terms of mean differences between NHPI and AA students. Specifically, we found that NHPI students had a GPA 0.58 SD lower than AA peers. The gaps in SBA scores were substantial as well, with NHPI students scoring 0.42 SD lower in ELA and 0.37 SD lower in math. SAT scores followed a similar trend, with NHPI students scoring 0.37 SD lower than their AA students. Disparities also existed in AP and SAT participation, where NHPI students were over 2.8 times more likely to have no AP credit earned and about 1.8 times more likely to never take the SAT during their entire high school years compared to AA students, highlighting opportunity gaps in advanced coursework and college entrance exam participation. We conducted additional analyses using school-by-year and school-by-cohort fixed effects to better account for time-specific variations. The results and overall narrative remained consistent, please see Supplemental Appendix Table A3.
Regression Results of NHPI Students’ Educational Outcomes

Note. AA students serve as the reference group; standard error in parenthesis. NHPI = Native Hawaiian and Pacific Islander; AA = Asian American; AP = advanced placement; GPA = grade point average; SAT = scholastic assessment test; SBA = smarter balanced assessment; ELA = English language arts.
p < .05. **p < .01. ***p < .001.
Discussion
Our study highlights the often-overlooked educational disparities faced by NHPI students, whose voices and experiences remain underrepresented in educational discourse. NHPI students consistently underperform compared to their peers in GPA, SBA, and SAT scores and are significantly less likely to enroll in AP courses or take the SAT. Our results also reveal that these disparities in comparison to AA students persist over time, indicating entrenched systemic inequities. Engaging with QuantCrit perspectives, our study recognizes the power of data in shaping discourse, revealing and defining problems, and informing equity-driven solutions (Hammond et al., 2011; Morey et al., 2022; Shih et al., 2019). QuantCrit challenges quantitative research by emphasizing how data practices are often rooted in racialized systems that obscure the lived experiences of marginalized communities. In the context of NHPI students, the aggregation of AANHPI students under a single category often masks significant differences within the group, perpetuating oversimplified narratives that fail to account for the distinct racialization and experiences of NHPI students. Even with disaggregated data, systemic barriers can persist unless racialized data are analyzed intentionally and critically—otherwise, cycles of marginalization are reinforced (Gillborn et al., 2018).
Historically, the aggregation of NHPIs with AAs reflects intersecting dynamics: (a) statistical and administrative logics around small NHPI sample sizes and disclosure thresholds, which led agencies to collapse categories under “Asian or Pacific Islander” until the Office of Management and Budget’s (OMB, 1997) revision created a separate NHPI category implemented in Census 2000. However, major educational agencies including the Department of Education have continued to prioritize feasibility and still use the collapsed category (U.S. Department of Education, 2010); (b) bureaucratic practices shaped by U.S. imperial governance in Hawaii and the Pacific that obscured Indigenous specificity in policy and data (Nasser, 2020); and (c) panethnic mobilization in the 1960s–1970s that strategically united Asian and Pacific groups for political visibility and resource claims, institutionalizing the AAPI umbrella (Okamoto, 2014). However, decades of hard-fought advocacy and relentless community commitment—from the Civil Rights movement to the efforts of researchers and organizations such as the Empowering Pacific Islander Communities and the Asian and Pacific Islander American Health Forum—have secured the meaningful separation of NHPI and AA data, culminating in the U.S. OMB’s 2024 update to Directive No. 15, which expands ethnic subgroup disaggregation (Lao, 2021; Lott, 1998).
Building on this advocacy and legacy, contemporary coalitions have advanced “data equity” statutes—for example, California’s AB1726, also known as the AHEAD Act (California Legislature, 2016), New York’s Invisible No More initiative (Gundanna et al., 2023), and Washington’s K-12 disaggregation tied to House Bill 1541 via the Office of Superintendent of Public Instruction guidance (Flores & Callahan, 2017). Yet despite progress in separating NHPI and AA, public reporting and use of NHPI–AA disaggregated data remain uneven at the district level: capacities, mandates, and analytic practices vary, leaving NHPI students underexamined in local decision-making. As a result, the challenges and struggles NHPI students face remain unseen, reinforcing their invisibility in policy and resource allocation. To advance equity, data should not only be disaggregated but also used as a tool for action—to reveal inequalities, drive changes, and amplify students’ experiences and strengths.
Research has emphasized the importance of understanding the historical, colonial, and structural forces that have shaped—and often constrained—NHPI communities’ educational trajectories (Froiland et al., 2016; Lee et al., 2025). Without such critical engagement, disaggregated data risks being co-opted into reinforcing, rather than dismantling, existing inequities (Gillborn et al., 2018). Policies and evidence alone rarely shift dominant narratives; systemic change demands deliberate, sustained efforts to name, confront, and redress these structures. This study calls on practitioners, researchers, and educational leaders, as street-level bureaucrats, to engage critically with data, challenge stereotypes and narratives, and advocate for data justice. By applying disaggregated data to local planning, these actors can advance meaningful implementation that ensures NHPI students are no longer overlooked but meaningfully supported.
Though the goal of this study is to bring attention to, raise awareness of, and amplify NHPI voices by uncovering the discrepancies and hidden trends in aggregate data, it is important to acknowledge several limitations of this study. First, in this study, the district’s classification practices group all NHPI students into a single NHPI category. Yet NHPI composition varies by region—one district may enroll primarily Samoan students, while others have larger Tongan, Chamorro, or other NHPI subgroups (Prior, 2022). Given the substantial heterogeneity across socioeconomic and demographic indicators (Quint et al., 2023), our findings are not necessarily generalizable across districts, states, or all NHPI communities—nor is that the study’s aim. Rather, this study advances the scholarship by centering NHPI students in educational experience, advocating for data disaggregation, and positioning data equity as foundational to social justice.
Second, we recognize that, in practice, disaggregation is not always feasible or appropriate—particularly when subgroup sizes are small and may raise concerns about statistical reliability or student privacy. Disaggregation is not a solution for all contexts, and in some cases, aggregating data at the classroom or school level may be necessary to protect individual identities. However, the decision to (dis)aggregate and how to approach and interpret “small N” is not merely a technical one (Gogue et al., 2022), but a political act that can reinforce systemic inequities (Gillborn et al., 2018). In response, we echo Espiritu and Omi’s (2000) call for “a delicate balancing act between the needs/interests of the larger category and that of the individual subgroups” (p. 90). Achieving this balance requires intentionality, transparency, and a sustained commitment to equity. We urge practitioners and institutions to adopt thoughtful methodological and ethical practices that ensure NHPI students are not rendered invisible in educational research and policy (Stage, 2007; Teranishi et al., 2020).
Supplemental Material
sj-pdf-1-epa-10.3102_01623737251413226 – Supplemental material for Disaggregating Data, Amplifying Voices: Academic Outcomes and Opportunity of Native Hawaiian and Pacific Islander Students
Supplemental material, sj-pdf-1-epa-10.3102_01623737251413226 for Disaggregating Data, Amplifying Voices: Academic Outcomes and Opportunity of Native Hawaiian and Pacific Islander Students by Se Woong Lee, Xinyi Mao and Jia Grace Liang in Educational Evaluation and Policy Analysis
Footnotes
Acknowledgements
We extend our sincere gratitude to the district in this study for its support and collaboration.
Declaration of Conflicting Interests
The authors declared no potential conflicts of interest with respect to the research, authorship, and/or publication of this article.
Funding
The authors disclosed receipt of the following financial support for the research, authorship, and/or publication of this article: The research reported in this article was made possible by a grant from the Spencer Foundation (#202600023). The views expressed are those of the authors and do not necessarily reflect the views of the Spencer Foundation.
Supplemental Material
Supplemental material for this article is available online.
Authors
SE WOONG LEE, PhD, is an associate professor in the Department of Educational Leadership and Policy Analysis at the University of Missouri-Columbia. His research focuses on educational policy, leadership, and Asian American studies, with a particular focus on social inequality.
XINYI MAO, PhD, is an assistant professor in the Department of Educational Leadership and Higher Education at the University of Central Florida. Her research focuses on educational leadership and school effectiveness, with a particular focus on issues of access and opportunity.
JIA GRACE LIANG, PhD, is an associate professor in the Department of Educational Leadership at Kansas State University. Her research focuses on school leadership, equity for women and minoritized populations, and leaders’ dispositions and practices in community engagement.