
Abstract
Longstanding evidence on the importance of a diverse teacher workforce prompts policymakers to scrutinize existing recruitment pathways. Following Maryland public high-school students over 14 years reveals that early barriers require timely interventions, aiding Black and other students of color in achieving educational milestones that are prerequisites for teacher candidacy (high school graduation, college enrollment). Data projections indicate that, to bring teacher and student demographics in closer alignment, policy solutions must address multiple educational milestones, have substantial effects (20% increases or larger), and specifically target or differentially benefit Black and other students of color. Policy alternatives that rely instead on correlates of race/ethnicity (socioeconomic status, geography) fare much better than race-neutral approaches but require larger policy impacts over 30%.
Descriptive research indicates that at least part of the mismatch between student and teacher demographics stems from “leaks” at multiple stages of the “teacher pipeline” (Lindsay et al., 2017)—or what we prefer to call a “teacher pathway” that implies opportunities for re-entry. While some of the racial/ethnic disparities in who becomes a teacher are likely driven by individual preferences (Bartanen et al., 2025; Brown & Butty, 1999; Shipp, 1999), the literature identifies systemic, institutionalized barriers that Black and other students of color face when considering a career in teaching. For example, lower rates of recruitment of Black and other teacher candidates of color may be due to lower rates of graduation from high school, college enrollment, and college graduation relative to White teacher candidates (Vegas et al., 2001). The licensure process can deter Black and other teacher candidates of color who may otherwise be successful in the classroom (Goldhaber & Hansen, 2010; Petchauer, 2014; Williams & Lewis, 2020). Goings et al. (2021) found that human resource officers rely on intuitive hiring practices that lead to fewer Black and other teachers of color being considered for positions.
The lack of racial/ethnic representation in the teacher workforce is therefore a multidimensional policy problem that requires multidimensional policy solutions. Dating back at least to the 1980s (Cornett, 1990; Darling-Hammond, 1990; Madkins, 2011; Maryland State Department of Education [MSDE], 1993), scholars and policy actors have advocated and developed, for example: “grow-your-own” programs that allow high school students to gain early exposure to career options, with the hope that these students will come back to work in their home district (Blazar et al., 2026; Edwards & Kraft, 2025; Goings & Bianco, 2016); college scholarships for majoring in teaching that can address acute economic challenges that many first-generation Black and other college students of color face (Harper & Griffin, 2010; Hrabowski & Sanders, 2015); and alternative routes to teacher certification that can fast-track the time it takes to earn a license and more readily support Black and other individuals of color to balance employment with course obligations, student teaching, and other opportunity costs of teacher preparation programs (Bergey et al., 2019; Dinkins & Thomas, 2016). Nevertheless, to date, these strategies largely remain “promising practices” rather than tested solutions with known impacts (Carver-Thomas, 2018; Dilworth & Coleman, 2014; Edwards & Kraft, 2025; Gist et al., 2019).
To help inform policy, we conduct a descriptive analysis of pathways into teaching, providing insight into where barriers to entry are highest and, thus, where (and how) it may be most important for policy to intervene. We build on other similar quantitative studies (e.g., Chen et al., 2000; Kilbride et al., 2023; Lindsay et al., 2017; Putman et al., 2016) in three ways. First, our focus on Maryland is unique relative to other state-specific analyses in Massachusetts (Rucinski, 2023), Michigan (Kilbride et al., 2023), and Wisconsin (Chapman & Brown, 2020), for example, where White students and teachers make up a large majority. A study in Texas (Bartanen & Kwok, 2023) can provide insight into contexts with large shares of Hispanic students. In Maryland, 38% of public high school students in our sample are Black, with no majority race/ethnicity group (44% White, 11% Hispanic, 5% AAPI; see Table 1). Thus, our analyses can inform teacher diversification efforts in a racially/ethnically heterogeneous context with a large share of Black students. The large Black population in Maryland also allows us to examine heterogeneity in pathways into teaching not just by race/ethnicity but also by socioeconomic status and geography—two dimensions that other research identify as important given histories of schooling, (de)segregation, and teaching in Black communities (Madkins, 2011).
Student Characteristics in Maryland Public High Schools (2008–2009 to 2013–2014)
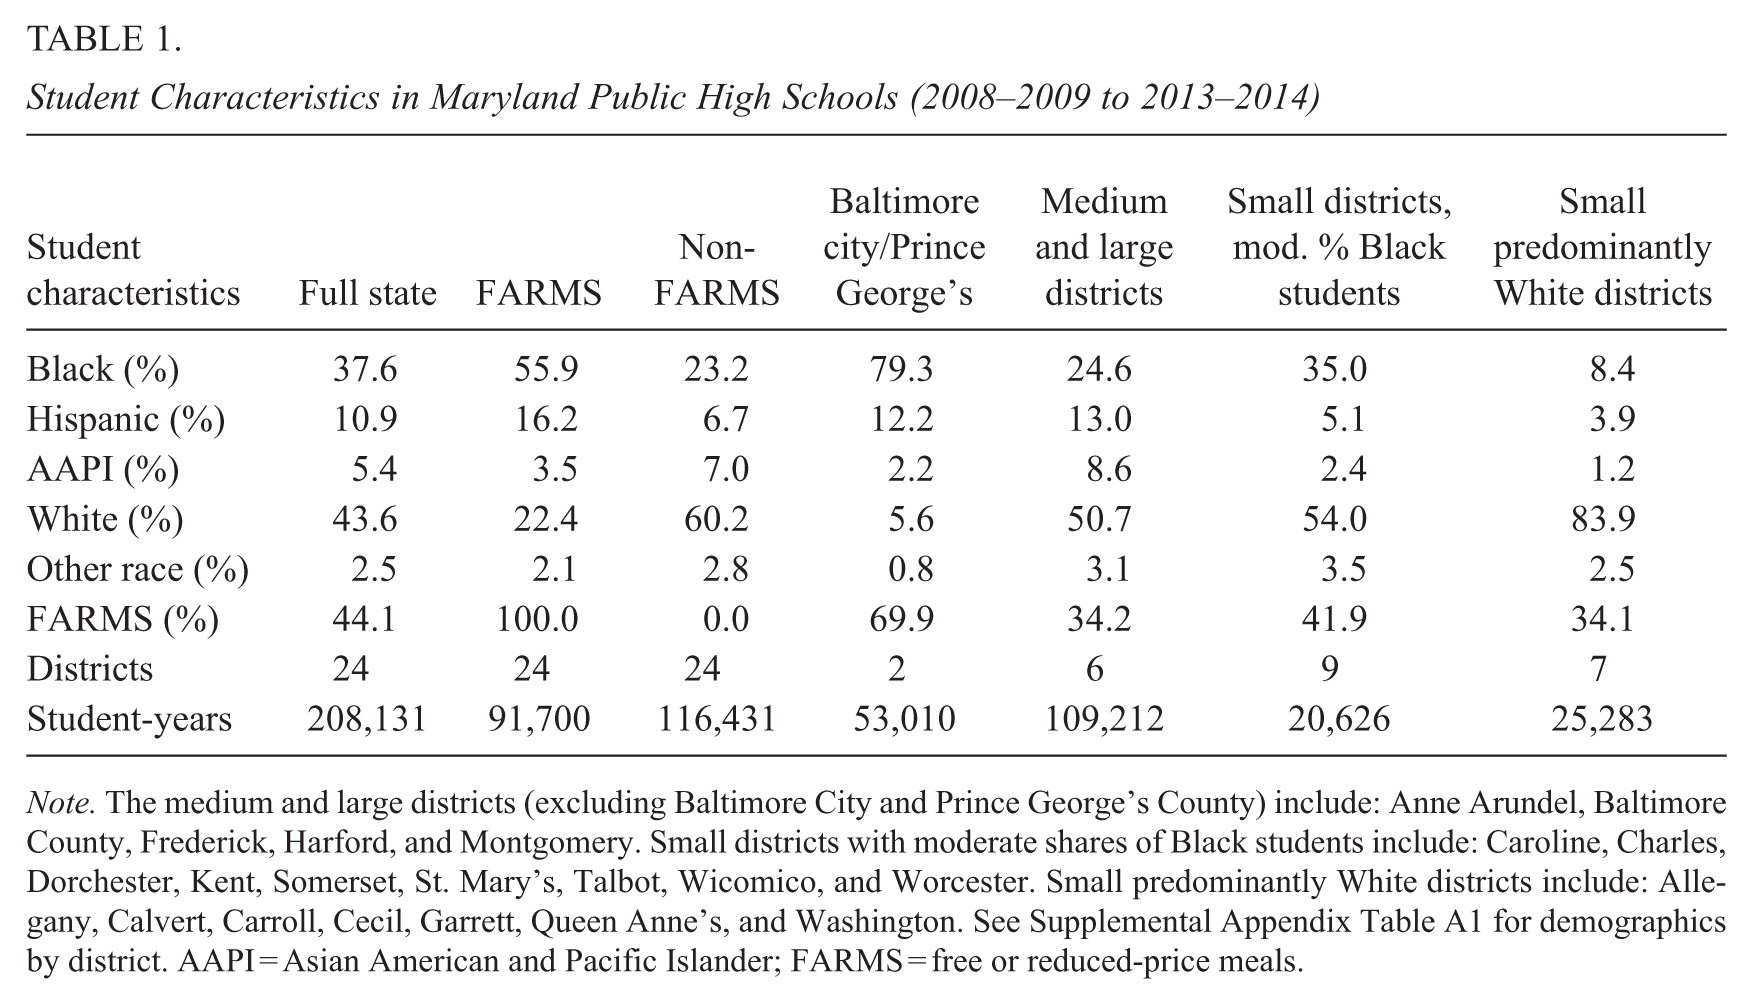
Note. The medium and large districts (excluding Baltimore City and Prince George’s County) include: Anne Arundel, Baltimore County, Frederick, Harford, and Montgomery. Small districts with moderate shares of Black students include: Caroline, Charles, Dorchester, Kent, Somerset, St. Mary’s, Talbot, Wicomico, and Worcester. Small predominantly White districts include: Allegany, Calvert, Carroll, Cecil, Garrett, Queen Anne’s, and Washington. See Supplemental Appendix Table A1 for demographics by district. AAPI = Asian American and Pacific Islander; FARMS = free or reduced-price meals.
We find, for example, that the large mismatch between teacher and student characteristics at the state level—where 38% of public high school students from the school year (SY) 2008–2009 to SY 2011–2012 were Black, compared to just 22% of those who became teachers up to 14 years later—was driven primarily by higher-income students. Roughly 3.5% of higher-income White students became teachers within 14 years of starting ninth grade, compared to 2% of higher-income Black students, or a 75% gap. Lower-income students were much less likely than higher-income students to become teachers, and Black students were overrepresented in this group. However, among lower-income students, rates of becoming a teacher were more similar for Black and White students (0.8% vs. 1%, respectively, or a 25% gap). Further, while the rate at which Black students became teachers was similar across county-based school districts in the state—perhaps reflecting within-district heterogeneity in socioeconomic status—Black students in two large, predominantly Black districts (i.e., Baltimore City, Prince George’s County) who became teachers were overrepresented relative to the share of Black students (83% vs. 79%). These patterns call attention to intersectional relationships between race/ethnicity, socioeconomic status, and geography that must be attended to when aiming to bring student and teacher demographics in closer alignment.
Second, prior literature often focuses on one or two transition periods (e.g., college graduation into career, college entry to college completion, high school to college; e.g., Dilworth & Coleman, 2014; Stohr et al., 2018). In contrast, our data allow us to follow cohorts of students over a long trajectory, from high school to career, thus providing a more complete picture of pathways into teaching and the barriers that Black and other individuals of color face. We find that because barriers appear early and accumulate over time, policy solutions must also start early to support Black and other students of color to meet educational attainment milestones that are prerequisites for becoming a teacher (e.g., graduating from high school, enrolling in college). It is insufficient to simply encourage already-enrolled college students to choose a teaching major. Similarly, expanding pathways into teaching that bypass traditional undergraduate teacher preparation programs may address some barriers to entry for Black and other individuals of color. In our sample, over 50% of newly hired Black teachers entered through an “alternative” route, with a conditional or resident teacher license that allowed them to teach full time while finishing requirements for full/standard licensure (i.e., coursework, testing). Alternative certification was particularly common among Black students from Baltimore City and Prince George’s County, likely reflecting policy approaches and partnerships at the local level. That said, substantial disparities remain even with current approaches to alternative certification.
Third, given the lack of causal evidence on strategies that work to improve recruitment of Black and other teachers of color, we follow just a handful of other studies (Goldhaber & Mizrav, 2023; Putman et al., 2016; Rucinski, 2023) that make data projections to ask where, how, and to what extent policy may intervene to meaningfully shift teacher demographics. We take a similar approach to others, altering completion rates for a given outcome/step on the pathway to a career in teaching (e.g., enrolling in college, majoring in teaching) and then examining the potential ripple effect on the likelihood of becoming a teacher and on the racial/ethnic makeup of the teacher workforce. We view these policy projections as an extension of the descriptive analyses, rather than true simulations, as modeling all factors that influence pathways into teaching (e.g., external labor market conditions and opportunities) is beyond the scope of this descriptive analysis.
That said, we extend the prior studies in policy-relevant ways by considering a range of potential impact estimates derived from extant literature. As benchmarks, we use the effects of various educational interventions (e.g., early childhood education, charter schools, college financial aid) that could be used as resources to support more students to reach educational attainment milestones that are prerequisites for becoming a teacher. Further, amidst the current pushback on diversity, equity, and inclusion (DEI)—and the recent Supreme Court case dismantling affirmative action in higher education (Students for Fair Admissions, Inc. v. President and Fellows of Harvard College, 2023)—we take up calls by legal scholars to consider policy alternatives that may be more or less permissible under the law (Menendian, 2025). We compare race-neutral approaches (i.e., policies from which all students benefit) to race-conscious ones (i.e., those that differentially target or benefit Black and other students of color), as well as policies that allocate resources based on factors associated with race/ethnicity (i.e., socioeconomic status, geography/school district) that also are predictive of becoming a teacher in our data.
Unsurprisingly, these analyses reveal that race-neutral policies are likely to have very little if any effect on shifting teacher demographics. These patterns closely align with literature in other arenas of education on the failures of race-neutral approaches that seek to address race-specific policy problems (Leonardo & Tran, 2013; Santos et al., 2010; Skiba, 2015). Conversely, race-conscious strategies can bring the share of Black students and teachers in the state in close(r) alignment, if they attend to multiple transition periods simultaneously and have impacts at each stage of roughly 20%. Prior literature suggests that these impacts are feasible with some educational interventions. However, history suggests that allocating resources specifically based on race is much less likely. Among the two policy alternatives we explore, allocating resources to large, predominantly Black districts is more likely to reach the intended goal, but requires over 30% increases to each pathway stage. With similar policy impacts of 30%, an income-conscious strategy reaches roughly 80% of the same goal. In our conclusion, we discuss existing credible evidence to address the feasibility of meeting these benchmarks.
Teacher “Pipelines” and “Pathways”: Current Trends and Historical Context
The “teacher pipeline” analogy has been central to multidisciplinary discussions on the teaching profession and teacher shortages for decades, stretching across the realms of educational research, policy, and economics. It presents a structured perspective on the trajectory of individuals transitioning from academic pursuits—both in K–12 settings and higher education—to careers in teaching. For example, Murnane and Schwinden (1989) examined the equilibrium between teacher supply and demand by tracking college graduates’ transitions from certification to classroom teaching in North Carolina, while Hanushek and Pace (1995) examined similar transition points from college degree to career using the national High School and Beyond survey.
Leaks in the Teacher “Pipeline” and High School to Career Pathway
Within this context, a critical and longstanding concern has been the so-called “leaky” pipeline for prospective Black and other teachers of color, which underscores systematic attrition at various stages of their academic and professional journeys (Ahmad & Boser, 2014; Putman et al., 2016; Stohr et al., 2018). Quantitative analyses consistently show that Black and other individuals of color are less likely than their White peers to become teachers and that gaps exist at various stages on the pathway from high school to career.
A major area of focus here has been on the transition point between college and career. Redding and Baker (2019) used nationally representative data from the 2008 Baccalaureate and Beyond Longitudinal Study, finding that White college students were nearly twice as likely as Black and Hispanic peers to major in teaching (9% vs. 4%–5%). Further, even among college graduates, White individuals were 5 percentage points (pp) more likely than Black individuals to enter teaching. Other scholars document similar trends in earlier cohorts of the same and other nationally representative surveys (Chen et al., 2000; Dilworth & Coleman, 2014; Hanushek & Pace, 1995), as well as in state administrative records including Indiana, Massachusetts, Michigan, Pennsylvania, Tennessee, Texas, and Washington state (Bardelli et al., 2024; Bartanen & Kwok, 2023; Ellison et al., 2025; Goldhaber & Mizrav, 2023; Kilbride et al., 2023; Rucinski, 2023; Stohr et al., 2018; Wan et al., 2021).
Kraft and Lyon (2024) show that, among college freshmen in the 2010s, White females were twice as likely as Black females to self-report teaching as their intended career (roughly 8% vs. 4%). Relative to the 1970s, Black females showed the steepest decline in interest in teaching. This decline was greater than that observed for White females, as well as both White and Black males. Data come from the Cooperative Institutional Research Program, which is the longest-running and most frequently collected survey of student interest in teaching.
While these studies call attention to higher education policy to recruit college students into teaching majors, a smaller set of quantitative studies point out that disparities in who is interested in, pursues, or becomes a teacher can begin much earlier. Also drawing on nationally representative data, from the High School Longitudinal Study of 2009, Cooc and Kim (2023) found that roughly 5% of White ninth graders self-reported teaching as their expected career. Black ninth graders were 3 pp less likely than their White peers to express interest in teaching (or 2% overall). The Hispanic-White gap was 2 pp, and the AAPI-White gap was 4 pp. And, all of these gaps persisted through the end of high school. White et al. (2013) pursued similar analyses in Illinois state data, finding similar between-group differences.
Operationalizing interest in teaching differently, Blazar et al. (2026) show that, in Maryland, White high school students were overrepresented in the state’s K–12 teacher-focused Career and Technical Education (CTE) program, relative to their makeup in the population of schools offering the program (roughly 50% vs. 40%). This pattern was driven primarily by the underrepresentation of Hispanic students (roughly 10% in offering schools vs. 5% in the program). While the share of Black students was similar in the program and in offering schools, Black students were substantially underrepresented among program completers (roughly 1% vs. 35%). Ellison et al. (2025) found similar patterns for a similar CTE program in Tennessee but focused on take-up rates only.
Historical Root Causes
What factors might explain these differential trends in teaching across race/ethnicity groups? Several of the researchers whose analyses are described above infer that racial/ethnic disparities in teaching and its proxies are driven, at least in part, by personal preferences and one’s “inclination” to pursue one career versus another (e.g., Dilworth & Coleman, 2014; Henke, 2001). Cooc and Kim (2023) interpret findings from their quantitative analyses through social cognitive career theory (Lent et al., 1994), positing that a combination of individual characteristics (e.g., self-efficacy) and contextual factors influences interest in and pursuit of specific occupations. The authors further describe a range of motivational factors—from intrinsic (e.g., enjoyment), extrinsic (e.g., job security, status), and altruistic (e.g., contributing to society and one’s community)—that may explain differential trends in who pursues and becomes a teacher (see also Brookhart & Freeman, 1992; Heinz, 2015).
To our knowledge, no studies examine the underlying factors that drive selection into (or out of) teaching for Black and other individuals of color in state or nationally representative data—a key strength of quantitative analyses examining trends in the pathway from high school to career. However, insights come from smaller-scale surveys and qualitative studies. In a survey of Black college students, Shipp (1999) found that both education and non-education majors described teachers’ contributions to society and intellectual stimulation as the two primary draws to the profession, while salary and prestige were the least attractive components. Unsurprisingly, Black education majors ranked these factors similarly in terms of their own career decision-making, while non-education majors were more likely to prefer job security and advancement opportunities. A survey study of Black male teachers in Prince George’s County in Maryland also emphasizes the importance of imparting knowledge (Brown & Butty, 1999), and several interview and ethnographic studies with Black male teachers echo the importance of giving back to their communities (Goings, 2015; Johnson, 2014; Lynn, 2002, 2006; Warren, 2014).
The interview data further reveal that, for Black educators, giving back to one’s own community is inherently connected to the systemic barriers that Black and other individuals of color face in schools. For example, even among students enrolled in a high school pre-collegiate program focused on teaching, many Black males indicated that they would not pursue teaching as a career given concerns that schools are unsafe spaces for Black youth and create few opportunities to learn from a teacher who looks like them (Goings & Bianco, 2016). Conversely, among individuals who had selected into a teacher preparation program in Texas, Black students indicated that experiences with adversity were the strongest reason for doing so (and a much stronger predictor compared to White teacher candidates; Bartanen et al., 2025).
While the roots of adversity and its connections to teaching and education are certainly multifaceted, historians often identify the landmark Brown v. Board of Education case in 1954 as a critical turning point. Before then, teaching was a highly accessible and respected profession for Black individuals (particularly women) in the segregated south and border states, including Maryland, where training at Historically Black Colleges and Universities (HBCUs) often instilled future educators with the mission to “uplift members of their race” (Madkins, 2011, p. 418). In Maryland, two out of four of the state’s HBCUs originated as normal schools to train teachers in predominantly Black areas, including Baltimore City and Prince George’s County (Commission for the Expansion of Higher Education in Maryland, 1962; Wennersten, 1975).
However, school integration following Brown resulted in a mass displacement of Black teachers in favor of retaining White teachers in newly integrated schools (Fenwick, 2022; Haney, 1978; Irvine, 1988). Unfortunately, their representation has seen little improvement over subsequent decades (Milner, 2020). Nationally, during the late 1960s, roughly 60% of Black college graduates became teachers after graduation, compared to <20% in the early 1980s (Murnane et al., 1991). While southern U.S. states were the primary target for school integration, meaningful compliance was concentrated, at first, in border states, including Maryland; Black teacher employment dropped most precipitously in areas where student desegregation was the highest (Thompson, 2022).
In Maryland specifically, in 1961, Black students at HBCUs accounted for roughly 18% of total enrollments across the state’s teachers colleges (Commission for the Expansion of Higher Education in Maryland, 1962). In 1969, a report from the MSDE was one of many reports from states describing how Black educators were being replaced by less qualified White individuals (Fenwick, 2022). By the early 1990s, Black and other individuals made up roughly 10% of all graduates of teacher preparation programs in the state (MSDE, 1993).
Policies and Practices for Increasing Teacher Diversity
Finally, what policies or practices may be best suited to offsetting these longstanding trends? Many of the “promising practices” discussed today for recruiting more Black and other individuals of color into teaching are, in fact, longstanding. For example, alternative-route teacher certification programs began across the country in the 1980s (Madkins, 2011), aimed both at addressing widespread teacher shortages regardless of race/ethnicity and to decrease barriers to entry (e.g., licensure testing) specifically for Black and other teachers of color (Baratz-Snowden, 1993; Haney et al., 1987; Murnane & Schwinden, 1989; Spellman, 1988). Maryland established alternative certification programs in the late 1980s and its “Resident Teacher” pathway—which still stands today, at least in name—in 1991 (Cornett, 1990). In the mid-1980s and early 1990s, statewide task forces and teacher recruitment plans placed a strong emphasis on recruiting Black and other individuals of color, with alternative certification as a means of doing so. These plans also emphasized scholarships for teaching majors and engagement with middle/high school students in “grow-your-own” style curricular programs (MSDE, 1993).
Despite their presence across the country and dating back many decades, various “promising practices” (Carver-Thomas, 2018) for diversifying the teacher workforce largely remain untested causally—with just a couple of exceptions (Fleck et al., 2025). Redding (2022) examined whether changes in state alternative certification policies over a 22-year period were correlated with changes in characteristics of new teachers. Descriptively, a larger share of alternatively certified teachers was Black compared to traditionally certified teachers (11% vs. 7%). Causally, changes in alternative certification policies resulted in a 2 pp increase in the share of new teachers who were Black but had no impact on the share of Hispanic teachers.
In Maryland, the staggered rollout of a state-led dual-enrollment and CTE program to engage high school students around a career in teaching resulted in a 0.7 pp increase in the likelihood that Black females became teachers in public schools in the state 10 years later (Blazar et al., 2026). Given that entering teaching is a rare event observed for <1% of Black high school students in Maryland, this effect represents a large 80% increase. Notably, the effect is driven almost entirely by Black females entering the profession through an alternative route that bypasses traditional teacher education—consistent with patterns showing that Black females are much less likely than White females to finish all courses in the sequence, and suggesting that the program developed new interest in teaching rather than making the process easier through transferable college credits. Furthermore, while effects for Black females are meaningful, White students benefited from the program as well (1.4 pp/40% increase), such that statewide diversity in the teacher workforce shifted only slightly.
In place of causal analyses—and in light of these tempered findings—a handful of additional studies conduct data and policy projections that seek to identify where along the teacher pathway policy interventions may be most advantageous (Goldhaber & Mizrav, 2023; Putman et al., 2016; Rucinski, 2023). Broadly, these analyses aim to predict effects on the final composition of the teacher workforce by artificially adjusting educational attainment rates for certain groups of students to be equal to their counterparts. One example is increasing the college graduation rate of Black or Hispanic students to equal that of their White peers. This projection assumes that a Black college graduate would continue onto teaching with the same likelihood independent of the projected change in graduation rate. The findings are similar across the three studies and their various contexts: the only way to shift teacher demographics meaningfully is to attend to multiple transition points (e.g., high school graduation to college entry, college entry to major, college major to degree) with large effects that overcome all of the historical attainment gaps that exist between Black and Hispanic versus White students. Furthermore, to achieve racial/ethnic parity in representation between teachers and students, it may take 20 years or more of sustained policy attention of this magnitude.
Directions for Research
As described in the Introduction, our study builds on the longstanding inquiry on racial/ethnic disparities in teaching pathways with descriptive analyses in a unique geographic context in Maryland. We also attend to the contemporary question of how best to address a longstanding goal and policy challenge (i.e., teacher diversification) amidst rapidly changing public discourse on race-conscious policymaking. Aligned with the outright assault on “DEI” at the federal level, some states’ teacher diversity goals and strategies already are being litigated for purported discrimination against White teacher candidates (Shelly, 2025). Maryland likely is on more solid footing, given a progressive legislature and executive branch, as well as current state policy under the Blueprint for Maryland’s Future that specifically requires state and local education agencies to pursue teacher diversity goals—and provides financial resources to do so (Md. Code, Educ. § 5-401). In response to the Trump Administration’s attempts to disassemble policies like the Blueprint, in May 2025, the State Secretary of K–12 Education and the State Board President released a joint statement of continued commitment to equity in schools. 2
That said, in many ways, the Maryland Blueprint is not new and reflects much of the same policy agenda and many of the same goals as prior efforts dating back to the 1980s (described above). The similarity between the Blueprint and prior efforts reflects some scholars’ contention that the lack of teacher diversity, as a policy problem, has never been addressed in earnest. Proposed policy alternatives, such as alternative routes to certification, are only nominal band-aids if they do not attend to root causes of the problem, which are enmeshed in histories of (de)segregation (Carter Andrews et al., 2019; Madkins, 2011). The challenges or “leaks” that prospective Black and other teacher candidates of color face are not mere accidents; many stem from systemic biases that deliberately and disproportionately keep certain groups out of teaching (Bianco et al., 2011; Farinde et al., 2015).
We acknowledge the limitations of large-scale quantitative analyses, such as ours, in attending to all the complexities that creating a more diverse teacher workforce requires. Our data are contemporary, from 2008 to the present day, and so cannot model longstanding trends in school desegregation and employment. We are limited to census-based race/ethnicity indicators that are captured by state and local education agencies. Nonetheless, we take up calls for a richer discussion on what it would take for policy to truly shift teacher demographics by pairing descriptive analyses of the problem itself with a range of potential solutions with different policy contours—ranging from purely race-neutral (all students benefit) to purely race-conscious (only Black and other students of color benefit).
Data, Sample, and Methods
Data
Data for our study come from the Maryland Longitudinal Data System (MLDS) Center, which includes person-level state population data for: (a) Maryland public primary and secondary schools (provided by the MSDE); (b) all public and private higher education institutions in the state (provided by the Maryland Higher Education Commission [MHEC]); (c) out-of-state college enrollment data for students who graduated from a Maryland public high school (from the National Student Clearinghouse [NSC]); and (d) the teacher workforce in K–12 public schools (also supplied by MSDE). Data housed at MLDS link person records over time, beginning in SY 2007–2008 and continuing through SY 2024–2025.
In our analyses, we focus on three cohorts of entering ninth graders— SY 2008–2009 through SY 2011–2012 (n = 208,131 unique students)—each of whom we can observe over a 14-year time horizon through roughly age 28, and along key stages on the pathway toward becoming a teacher: (a) high school graduation; (b) college enrollment, in either 2- or 4-year degree-seeking programs; (c) completion of a bachelor’s degree (which is a requirement for becoming a teacher, even if students start in a 2-year program) 3 ; (d) receipt of a bachelor’s degree in teaching; and (e) observed as a teacher in Maryland K-12 public schools, including their entering license and whether or not the school where they work is in the same district where they attended high school.
There are several important decision rules we make when constructing our dataset and key variables. First, we define the starting point of the pathway as the first-time students enroll in a Maryland public school in ninth grade. This means that we exclude the first year of available data (SY 2007–2008) because we cannot observe if students repeated ninth grade relative to the prior year. Second, we define high school graduation as earning a Maryland high school diploma. Students are censored from the graduation data if they transferred from a Maryland public high school out of state or to an in-state private school, neither of which is observed in our dataset. We treat these individuals as not having graduated, though overall patterns of results are the same if we instead treat these individuals as missing and exclude them from this analysis. However, these individuals can re-emerge in the data if they enrolled in a Maryland college or if they became a teacher in Maryland. In these instances, we impute high school graduation data, assuming that students who enrolled in college had to have graduated from high school beforehand. Similarly, we are missing college enrollment data for students who transferred out of a Maryland public high school and enrolled in college out of state. Our NSC data track out-of-state college enrollments, but only for students who graduated from a Maryland public high school.
Third, we define a college degree in teaching based on Classification of Instructional Program codes that are used to categorize college majors in a consistent way across the state and nationally. Fourth, we define our teacher variables somewhat narrowly as “observed as a teacher in a Maryland public school.” We adopt this approach for practical and substantive reasons. We cannot observe individuals who became teachers out of state or in a private school. That said, our definition has policy relevance because state policies often are designed to fill teacher shortages in the state and in public schools. Another benefit of this approach is that we have no missingness: a value of 1 indicates that an individual became a teacher in a Maryland public school, while a value of 0 indicates that an individual did not do so within the time period we observe (even if they became a teacher in a private school or out of state). We identify Maryland public-school teachers from job codes in human resource files. The “teacher” code is distinct from other instruction-related positions, including instructional assistants or aides, coaches, and special education support personnel. In course roster data, over 95% of instructors of record are teachers.
The teacher workforce data also include certificate/license type. To align with prior literature, we refer to certificates/licenses as one of two types: “traditional” versus “alternative,” implying different routes to enter the profession (Walsh & Jacobs, 2007). A traditional or standard certificate, which is valid for 5 years, implies entry to teaching after completing an undergraduate degree in education and through an approved teacher preparation program. Traditional routes to certification may also run through master’s degrees in teaching. In contrast, alternative certificate or alternative route refer both to Maryland’s resident teacher certificate and conditional certificate, which are given to individuals who start teaching full time before they fulfill all requirements for full certification (e.g., coursework, tests) and are valid for 2 years before individuals need to reapply for a standard certificate. In Maryland, the key distinction is that the resident teacher certificate is associated with state-approved alternative-route teacher preparation programs (e.g., Teach for America), while conditional certificates are not necessarily associated with programs. There are similarities between these pathways (e.g., fast-tracking the licensure process) but also substantive differences. Despite longstanding history in the state, described above, resident teacher certificates are rare compared to conditional certificates (3% vs. 25% of new teacher entries). Therefore, in our main analyses, we pool resident teacher and conditional certificates under the same alternative certification umbrella and then disaggregate patterns in tables shown in the Supplemental Appendix.
Sample
In choosing cohorts for analysis, we aim to strike a balance between maximizing the number of students and cohorts included in the sample 4 and maximizing the number of years we can follow students over time. Given interruptions to schooling and teacher hiring during the Covid-19 pandemic, it is important that we observe all cohorts’ labor market decisions once school systems resumed more standard routines (i.e., SY 2022–2023 onward). Because we set a fixed time horizon for each cohort, following students for fewer than 14 years would mean that our earliest cohort (i.e., SY 2008–2009) would be observed post-college in the midst of the pandemic. Further, expanding pathways into teaching requires thinking about opportunities for re-entry and that may take more time.
We take a data-driven approach to cohort selection by examining time-to-event histograms that capture the share of individuals who graduated from high school, enrolled in college, etc., across years since ninth grade, by race/ethnicity (see Supplemental Appendix Figure A1 and Supplemental Appendix Table A1). These analyses indicate that over 90% of students who graduated from high school did so within 4 years of starting ninth grade, no matter their race/ethnicity. Similarly, roughly 75% of college enrollees reached this milestone within 5 years of starting ninth grade, though a larger share of Black and Hispanic individuals (roughly 30%) took more than 5 years compared to AAPI (14%) and White students (20%).
Between-group differences in time-to-event are much larger starting with college degree receipt. Roughly 34% of White students who became teachers did so 9 years after starting ninth grade, generally implying that they took 4 years to complete high school and 4 years to complete college, majored in teaching as an undergraduate, and immediately entered the teacher workforce after college. Another 28% of White students who became teachers did so in 10 years. In comparison, roughly 11% of Black students who became teachers did so in 9 years, 23% in 10 years, 18% in 11 years, 16% in 12 years, 14% in 13 years, and 19% in 14 years. For those Black teachers in our data that entered through a traditional route, roughly 25% did so in 14 years suggesting either that they took more time or pursued a traditional license through a master’s degree program. Our analyses still censor individuals who took more than 14 years to become a teacher, but ensure that the trends we observe do not capture idiosyncrasies for a specific cohort and point in time. Future analyses, in Maryland or other data, can observe pathways into teaching over an even longer period. That said, when we limit the sample to just one cohort with 16 years of data, the primary patterns we document below regarding between-group differences in the likelihood of becoming a teacher do not change substantively.
Compared to the national population of public-school students in this timeframe (National Center for Education Statistics, 2020), Maryland has some distinct features (see Table 1): a larger population of Black students (38% in Maryland vs. 16% nationally) and smaller shares of Hispanic students (11% vs. 23%) and White students (44% vs. 52%); the share of AAPI students is similar (5%). We view the large share of Black students as an asset for our analyses, particularly relative to prior state-based analyses with much smaller populations of Black individuals. In the experimental literature, there is robust evidence that Black teachers have large effects on varied student outcomes, not just for Black students (Dee, 2004; Gershenson et al., 2022) but also for all students (Blazar, 2024).
The large Black population in Maryland is quite heterogeneous, and we incorporate two additional dimensions into our analyses: socioeconomic status and geography. For socioeconomic status, we identify students who were eligible for free and reduced-price meals (FARMS) at any point in high school, which includes 45% of students in our full state sample. 5 Of these students, roughly 40% were FARMS-eligible in all high-school years, and over three-quarters were FARMS-eligible in at least 2 years. Following national trends, a larger share of Black and Hispanic students in Maryland were FARMS-eligible (65%) compared to AAPI (28%) and White students (23%). There is also substantial variation in race/ethnicity and FARMS status across geographies and county-based school systems, where over 90% of Black students in Baltimore City were FARMS-eligible, compared to 42% in Charles County. Baltimore City and Charles County, as well as Prince George’s County, are the three school districts in the state where at least 50% of public high school students in our sample are Black (see Supplemental Appendix Table A2).
In our analyses, we attend to intersectional relationships between race/ethnicity, FARMS, and geography in two ways. First, we examine whether pathways into teaching—and barriers to entry—differ not just by race/ethnicity but also by FARMS and geography. Second, given the correlation between these dimensions, in the policy projections (described below), we consider whether “FARMS-conscious” or “geography-conscious” policymaking may be reasonable alternatives for race-conscious approaches, given that the first two strategies may be less subject to legal scrutiny than the third (Menendian, 2025).
To ensure reasonable sample sizes, we cluster the 24 school systems in Maryland into 4 groups based on race/ethnicity, FARMS, and district size (see Table 1 for characteristics of the clusters, and Supplemental Appendix Table A2 for characteristics by district): (a) two large, predominantly Black districts—Baltimore City (88% Black) and Prince George’s County (74% Black)—where at least 60% of students were eligible for FARMS; (b) the six remaining medium to large districts, whose Black (25%) and FARMS (34%) student population as a group fell below the state average; (c) nine small districts, where more than 15% of students were Black and, across all nine, the Black and FARMS population (35% and 42%, respectively) reflected the state average; and (d) seven small, predominantly White districts (8% Black and 34% FARMS).
Methods
Most of our analyses involve visual presentations of descriptive statistics, which we describe below in the Results section. The policy projections require more explanation, and we provide a full accounting of our mathematical expressions and derivations in the Supplemental Technical Appendix. Broadly, our “policy shock” thought experiment asks: If a policy were to increase high school graduation rates—or college enrollment rates or college graduation or college degree receipt or receipt of a teaching degree—of Black (or Hispanic or AAPI) students by 10%—or 20% or 30%—how much would teacher demographics shift?
We make several key assumptions in these analyses. First, we assume that the magnitude of potential policy shocks ranges from 0% (status quo) to a maximum value based on the value that brings the share of individuals meeting that stage in the pathway to 100%, as well as on prior literature describing reasonable policy impacts. For example, if the high school graduation rate were 80%, the largest possible increase would be 25% (i.e., a 20 pp increase from 80% to 100%). However, a 25% increase may or may not be realistic based on prior literature.
To gain insight into reasonable, policy-relevant bounds, we consider several benchmarks. The first, which is most specific to our context on teaching and Maryland, is a study of the effects of a teaching-specific high school CTE program (Blazar et al., 2026). The program increased the likelihood that Black females became teachers by 0.07 pp/80%, driven in part by intermediary effects on high school graduation of 2 pp/3%. The program did not result in statistically significant increases in the likelihood that Black males—or Hispanic or AAPI females or males—became teachers, but it did increase the intermediary outcomes of Black males: 1.3 pp/16% increase in high school graduation, 2.3 pp/11% increase in 4-year college enrollment, 1.7 pp/15% increase in receipt of a BA degree. Notably, relative effects on becoming a teacher for Black females are quite large—because the baseline rate of becoming a teacher is quite low—but still were not large enough to substantially change teacher demographics given that effects for White females also were large. Furthermore, to the extent that effects on intermediary educational attainment outcomes (i.e., high school graduation, college-going, degree) drive career outcomes, then intervening on these intermediary outcomes in various ways—and with larger impacts than observed in this study—could have meaningful ripple effects. Thus, roughly 15% increases in high school graduation, college-going, and degree receipt likely serve as reasonable but lower-bound estimates to consider.
Second, because we hypothesize ripple effects, we consider effects of a broader set of educational interventions, beyond those focused specifically on teaching. In a meta-analysis of randomized controlled trials looking at effects of various PK12 interventions on the outcomes of Black, Hispanic, and low-income students, Blazar et al. (2025) find average effect sizes of roughly 3 pp/4% on high school graduation and 5 pp/11% on 4-year college enrollment. The largest effects come from studies of oversubscribed charter schools and early demonstration projects on the effects of pre-school. (We discuss effects from specific studies in the Discussion section of the paper.) For college students, a separate meta-analysis of financial aid reports average effects of roughly 4 pp/11% on 4-year college enrollment and 2.7 pp/7% on receipt of a bachelor’s degree (LaSota et al., 2025). Together, this evidence leads us to consider a range of possible policy effects up to 30%—more than twice the average effect size observed in these prior studies.
A second key assumption we make in the policy shock analyses is that groups of newly induced high school graduates, college enrollees, etc., go on to subsequent pathway steps (e.g., graduating from college) and eventually enter teaching at the same rates we observe in the actual data. In other words, we assume that a policy shock at one step (e.g., high school graduation) does not affect the conditional probability of passing subsequent steps in the pathway (e.g., finishing college or becoming a teacher). This assumption is similar to those made in prior studies (Goldhaber & Mizrav, 2023; Putman et al., 2016; Rucinski, 2023). In a robustness check, we probe the sensitivity of this assumption by varying the marginal completion rate. For example, by definition, “marginal” completers in the policy projection—those newly induced to enroll in college due to the policy—may graduate at lower rates than their peers who would have enrolled even without the policy intervention. Conversely, to the extent that the teaching profession tends to pull from the lower end of the educational achievement/attainment distribution (Podgursky et al., 2004), it may be that marginal completers go on to become teachers at higher rates.
Third, we assume that the pool of public high school students in Maryland who become teachers can increase unbounded. This is a reasonable simplifying assumption that is particularly useful for descriptive work such as ours. U.S. and Maryland teacher labor markets experience perennial and nontrivial teacher shortages (Sutcher et al., 2016). Furthermore, the sample of individuals we focus on—public high school students in Maryland—are a primary source for recruiting future teachers in the state, but they are not the only ones. Potential teachers also come from private schools, students in other states, and later career changers, whose pathways into teaching we cannot explore due to data limitations. Maryland is a large out-of-state importer of teachers: in recent years, over 50% of teacher licensure applicants to the MSDE were prepared out of state (MSDE, 2024). Among students recruited from or prepared in-state (i.e., our analytic sample), a large majority are hired in public school systems (MLDS Center, 2025), suggesting that—at least in our context—the “unbounded” assumption is reasonable. We recognize that there is substantial nuance in the teacher shortages literature, including the fact that shortages tend to be local (Edwards et al., 2025). Given the descriptive nature of our analyses, we leave more sophisticated simulation models that account for these features to other analyses.
We conduct these data projections under several scenarios that match a range of potential policy approaches we may expect to see given historical trends, and that may be more or less permissible given the current policy and legal landscape (Menendian, 2025). The first scenario increases the proportion of students who complete certain steps in the pathway equally for all races, which we refer to as “race-neutral.” On the other extreme is a fully “race-conscious” approach that only increases the proportion for a specific race/ethnicity group and, thus, assumes that a given policy differentially targets or differentially benefits Black or other students of color. We argue that race-conscious approaches are more likely than other strategies to recognize histories of (de)segregation and the displacement of Black teachers following Brown, though whether that message is overt is in the hands of policymakers.
Two additional policy alternatives lie in the middle of this continuum. One increases educational attainment rates for students eligible for FARMS, which we show above is correlated with race/ethnicity but is less subject to legal scrutiny. Reardon et al. (2017) provide a proof of concept for this approach when thinking about higher education admissions, where race-conscious admissions are now illegal. The second considers a policy that targets resources to all students in specific districts, where we focus on the two large districts in Maryland with the largest shares of Black students: Baltimore City and Prince George’s County. Similar to policy intervention based on FARMS, this approach also avoids using race as an explicit basis for intervention. However, Black students are likely to benefit disproportionately, given the demographics of the districts. And, the rest of the state may benefit too, if some of the newly induced teachers seek jobs in other districts.
Results
Our analyses highlight the large disconnect between the racial/ethnic composition of Maryland’s ninth-grade students and that of the few ninth graders who went on to become teachers. Figure 1 (and Supplemental Appendix Table A3) shows that 38% of the public high school students in our sample are Black. In contrast, only 22% of these students who eventually became teachers are Black. The corresponding proportions for Hispanic students are 11% and 8%, respectively; for AAPI students, they are 5% and 4%, respectively. White teachers, meanwhile, were overrepresented: the student body was 44% White, while 65% of the eventual teachers were White. We order race/ethnicity groups based on their share in the Maryland public-school population, from largest to smallest—Black, Hispanic, AAPI—with White students listed last because diversifying the teacher workforce means increasing representation for Black and other students of color only. Here and throughout our analyses, we exclude the 3% of students identified in the data as another race/ethnicity, multiple races/ethnicities, or missing.
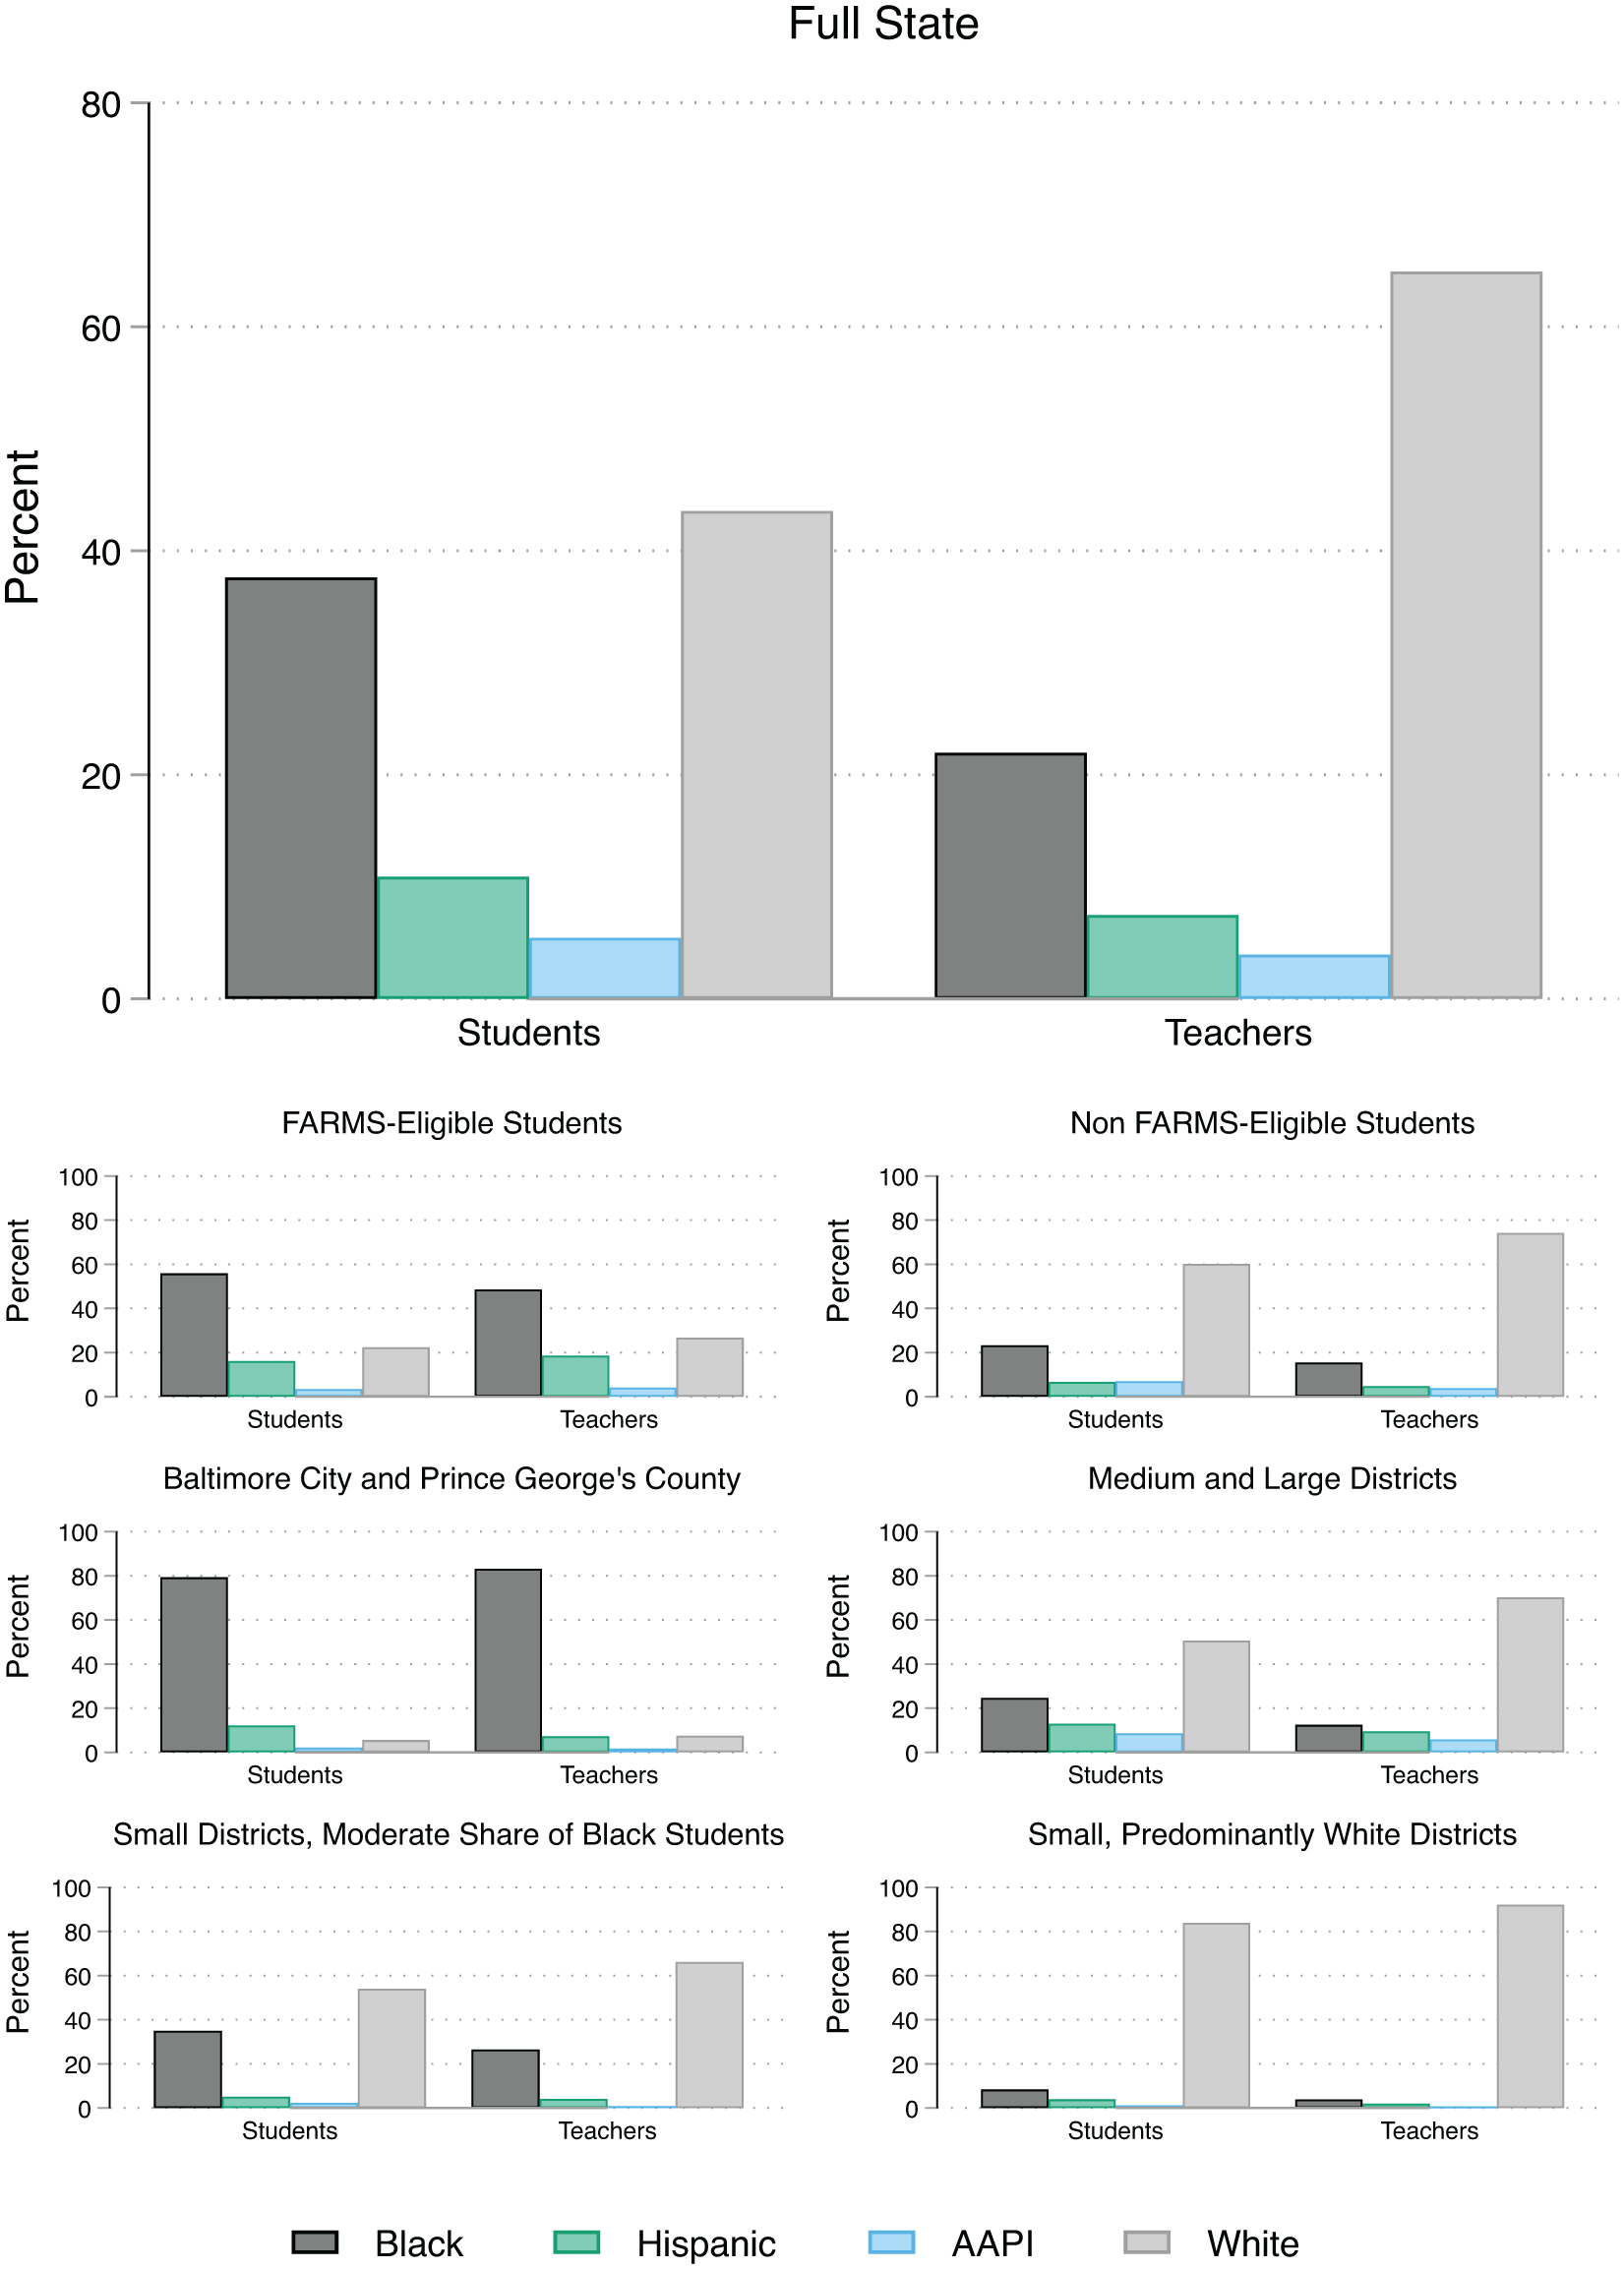
Demographic characteristics of students and those who became teachers.
The mismatch between teacher and student demographics is not a single phenomenon and instead varies substantially across socioeconomic status and geography. Figure 1 shows that, among low-income students eligible for FARMS, demographic gaps between students and those who became teachers were much smaller: 56% of FARMS-eligible students were Black, compared to 49% of FARMS-eligible students who became teachers. In Baltimore City and Prince George’s County, Black students who became teachers were overrepresented: 79% of students across these two districts were Black, compared to the 83% who became teachers. Instead, demographic mismatches came from higher-income students: 23% of higher-income high school students were Black, while 16% of higher-income students who became teachers were Black. Geographically, this pattern was driven primarily by the medium to large districts in Maryland, whose average FARMS rate was far lower than Baltimore City and Prince George’s County (34% vs. 70%). Several of Maryland’s small, more rural districts had moderate shares of Black students, though demographic mismatches here generally reflect statewide trends.
Racial/Ethnic Composition Changes Along the Pathway Into Teaching
Where along the pathway do changes in demographic representation occur? In Figure 2, we illustrate our conceptualization of the pathway into teaching—and the barriers that students from different race/ethnicity groups face—as a connected line plot that follows individuals from high school and into teaching. This approach allows us to show the proportion of students at various pathway steps in an intuitive, visual way that also allows for visualizing multiple pathways simultaneously. For example, given certification guidelines in Maryland and nationally, everyone must enroll and graduate from high school and college to continue along the pathway. Depending on college major, a student can take either a traditional path into teaching (i.e., studying teaching as an undergraduate) or an alternative one (i.e., studying something else and then re-entering the teacher pathway post degree). We also add additional information on who taught in the same district they attended high school.
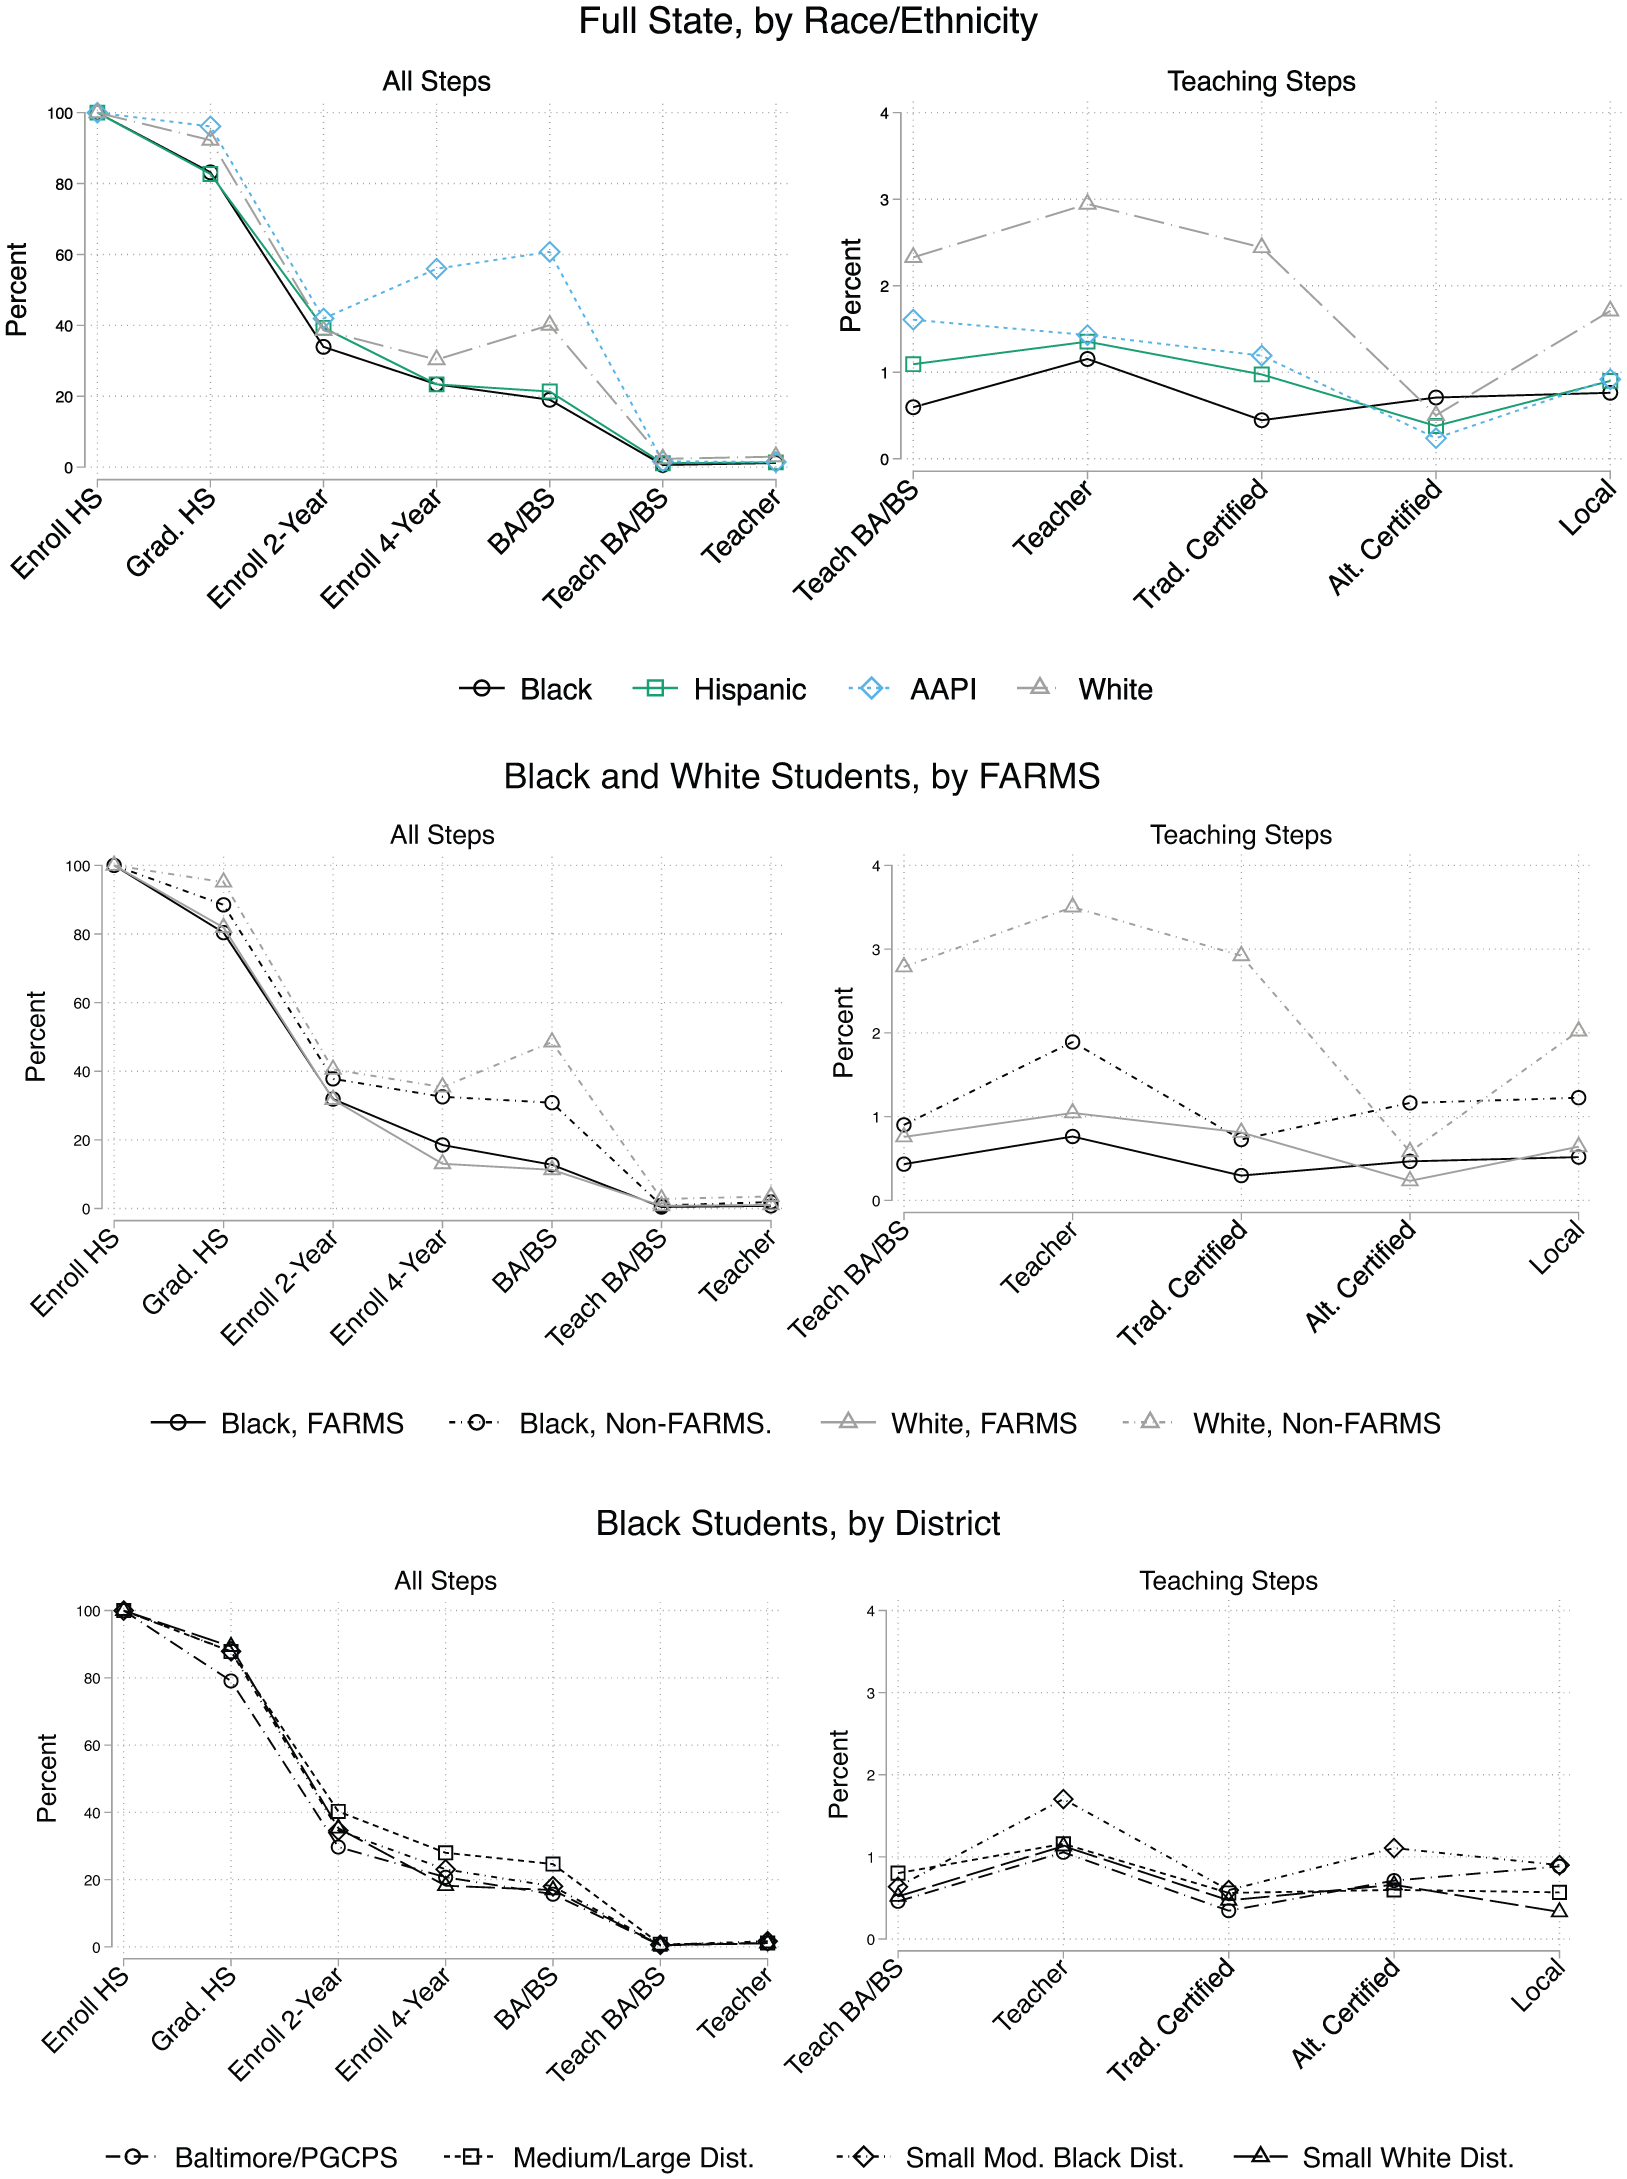
Share of ninth-grade students at each subsequent stage on the pathway into teaching.
Focusing first on statewide trends, Figure 2 (and Supplemental Appendix Table A4) shows that entering teaching was a rare outcome for students of all backgrounds: 2% of ninth-grade students in Maryland public schools went on to become teachers in Maryland public schools within 14 years. However, teaching was a particularly rare outcome for Black (1.2%), Hispanic (1.4%), and AAPI (1.4%) students. In contrast, 2.9% of White ninth graders became teachers in Maryland—at least a two-fold difference.
One way to examine differential access to pathway steps by race/ethnicity is to examine the slopes of the lines connecting one stage to another. For all race/ethnicity groups, slopes are particularly steep between earning a 4-year college degree and earning a degree specifically in teaching. This may be one reason why policy interests often focus on encouraging college students to major in teaching. However, the slope here is steepest for AAPI and White students, suggesting that intervening here may have an outsized impact on these students relative to Black and Hispanic students. The slopes of the lines are also steep between high school graduation and college enrollment, partly due to how we break out college enrollment into 2- versus 4-year institutions. For all race/ethnicity groups, 2-year institutions were a more common starting point than 4-year institutions. The connected lines between 2-year college enrollment and BA/BS degree receipt slope upwards for White and AAPI students but downwards for Black and Hispanic students, indicating that Black and Hispanic students experienced more barriers in the transition from 2- to 4-year institutions and, ultimately, to degree receipt from a 4-year college and program. For Black and Hispanic students, downward slopes are also steep between ninth-grade enrollment and high school graduation, highlighting the fact that barriers start earlier than college enrollment.
Narrowing in on steps related specifically to teaching, we observe that White students were more than two times as likely as Black students to be hired as a public-school teacher in the state, and over three times as likely to earn a bachelor’s degree in teaching. Black students who became teachers more often did so through an alternative certification route that bypassed traditional teacher education: 0.7% of Black ninth graders went on to become teachers with an alternative license, which is slightly more than the 0.5% of White ninth graders who did so (see Supplemental Appendix Table A4).
In the bottom two panels of Figure 2, we disaggregate these patterns by FARMS—narrowing the sample to Black and White students—and district—narrowing further just to Black students. (We replicate the top panel of Figure 1 for all four race/ethnicity groups and for the six subgroups by FARMS/district, in Supplemental Appendix Figure A2.) Notably, educational attainment rates for Black and White students were largely overlapping within FARMS/non-FARMS groups. For pathway steps related specifically to teaching, White FARMS-eligible students were more likely to become teachers than FARMS-eligible Black students, though the difference is not large (1% for White students and 0.8% for Black students). Patterns diverge for non-FARMS students, where 3.5% of non-FARMS White students became teachers compared to 1.9% of non-FARMS Black students. Given the correlation between race/ethnicity and socioeconomic status (Table 1), statewide patterns in the top panel of Figure 1 largely reflect the FARMS trends for Black students and the non-FARMS trend for White students.
In the bottom panel of Figure 2, differences in pathway progression for Black students across school districts are far less stark than they are by FARMS eligibility. Average educational attainment rates among Black students from Baltimore City and Prince George’s County were lower than the other six medium to large districts with smaller shares of Black (and FARMS) students. However, their rates of becoming a teacher were similar at 1.1%. Black students from small districts with a moderate share of Black students (of more than 15%) were the most likely to become teachers (1.7% of ninth graders).
Figure 2 further reveals differences in the likelihood of staying local (i.e., in the same school district they went to high school), which is a key policy goal for many school systems. Teaching locally was very common for Black students from Baltimore City and Prince George’s County (84% of those who became teachers) relative to the other medium to large districts (49%) and to the smaller districts with a moderate share of Black students (53%). Unsurprisingly, local teaching was uncommon for the small share of Black students from small, predominantly White districts (29%). On average across White students, 58% of those who became teachers did so locally, with fairly small fluctuations across socioeconomic status and geography.
The fact that Black students from Baltimore City and Prince George’s County who became teachers were the most likely to stay local helps explain the overrepresentation of Black teachers in these settings (Figure 1). These patterns also present a potential policy challenge from the state perspective, given the desire to recruit more Black teachers in other settings—particularly those with much smaller shares of Black teachers compared to Baltimore City and Prince George’s County. At the same time, the 16% of Black students who became teachers in these two districts but moved elsewhere still represents a sizable share of all the Black students who became teachers in the six other medium to large districts (roughly 25%).
Where Figure 2 documents the share of individuals from each race/ethnicity group who moved along the pathway toward teaching, Figure 3 shows demographic representation within each step (e.g., the share of individuals who enrolled in college who were Black; see Supplemental Appendix Table A3 for exact percentages), for the full state (top panel) and the six subgroups of Black students by FARMS status or district group (bottom panel). (Supplemental Appendix Figure A3 shows subgroup disaggregations for other race/ethnicity groups.) Further, Figure 4 shows step-to-step changes in demographic representation across steps (with subgroup disaggregations shown in Supplemental Appendix Figure A4). On average across the state, White students made up an increasing share of individuals along most steps on the pathway toward becoming a teacher. For example, while 44% of ninth-grade students were White, 46% of high school graduates and college enrollees were White. For White students, we observe large step-to-step changes of roughly 10 pp or more at the college graduation and teaching degree steps.
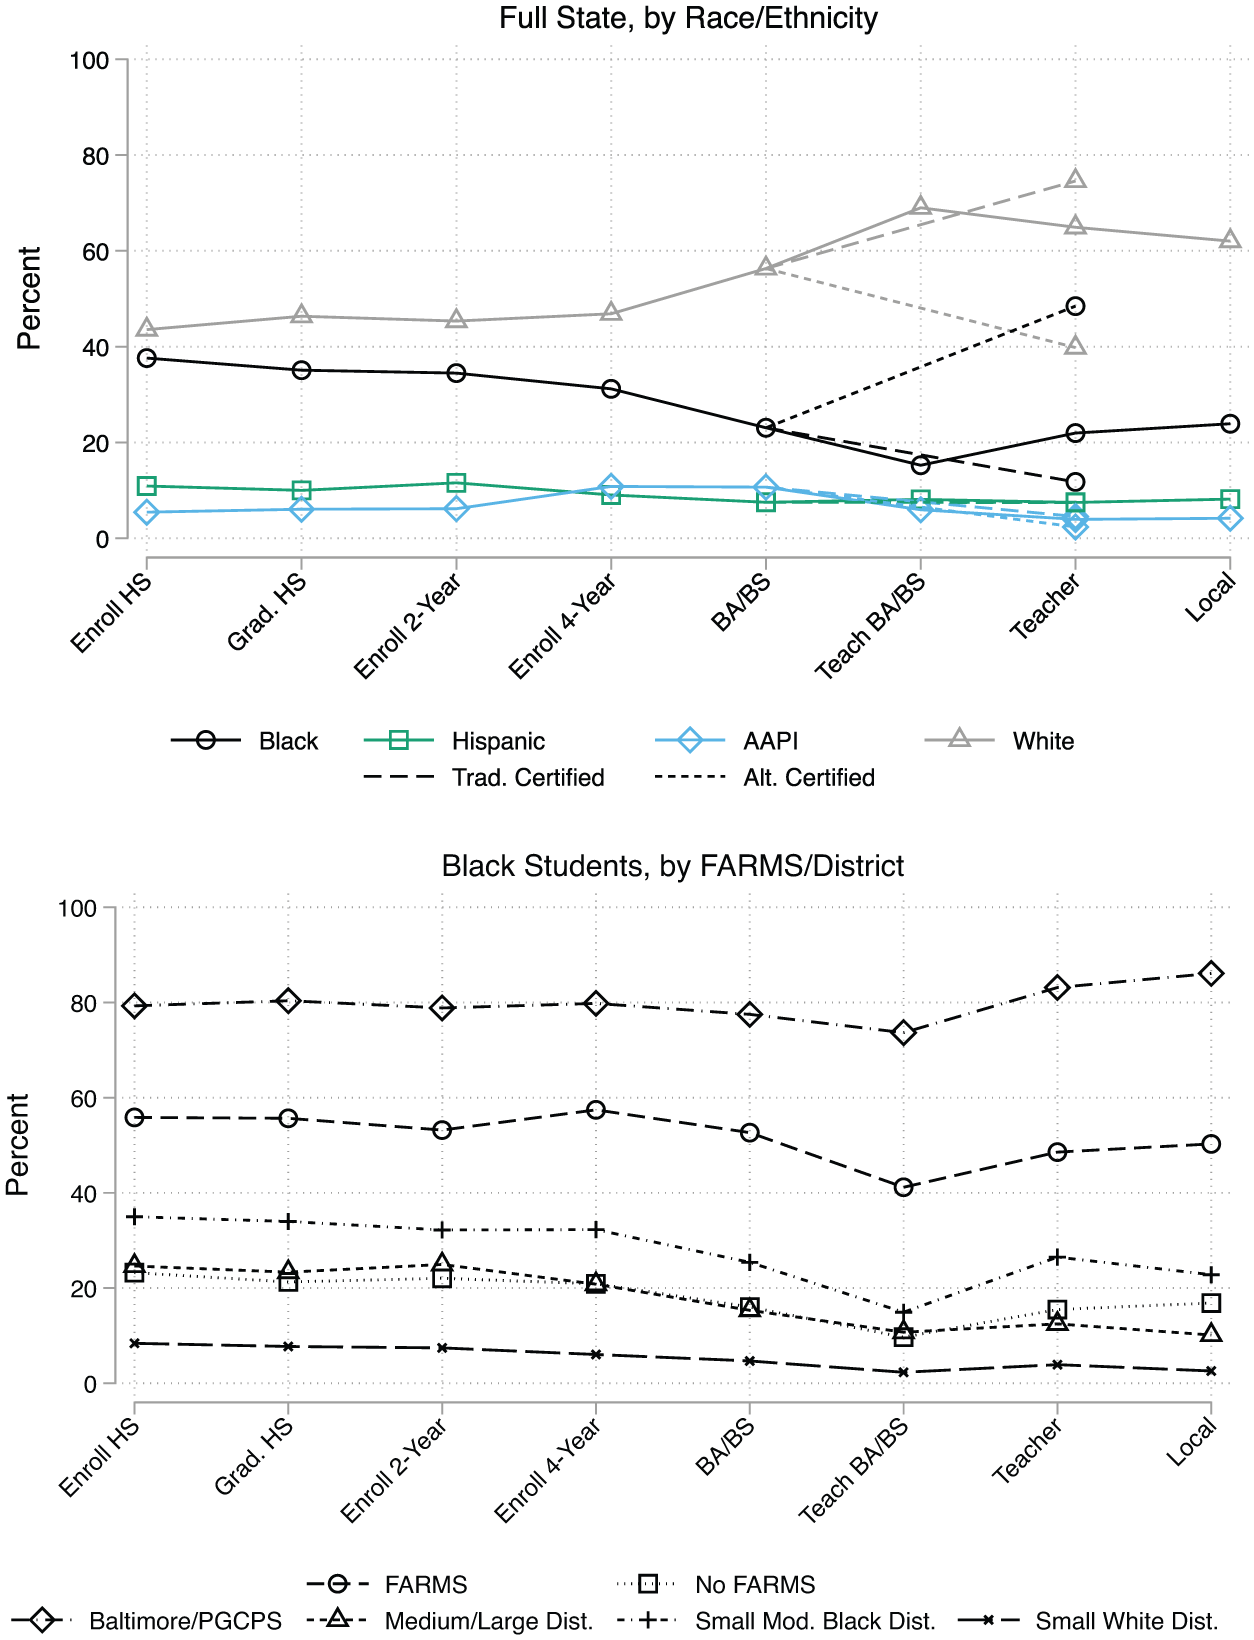
Demographic makeup of students at each pathway step.
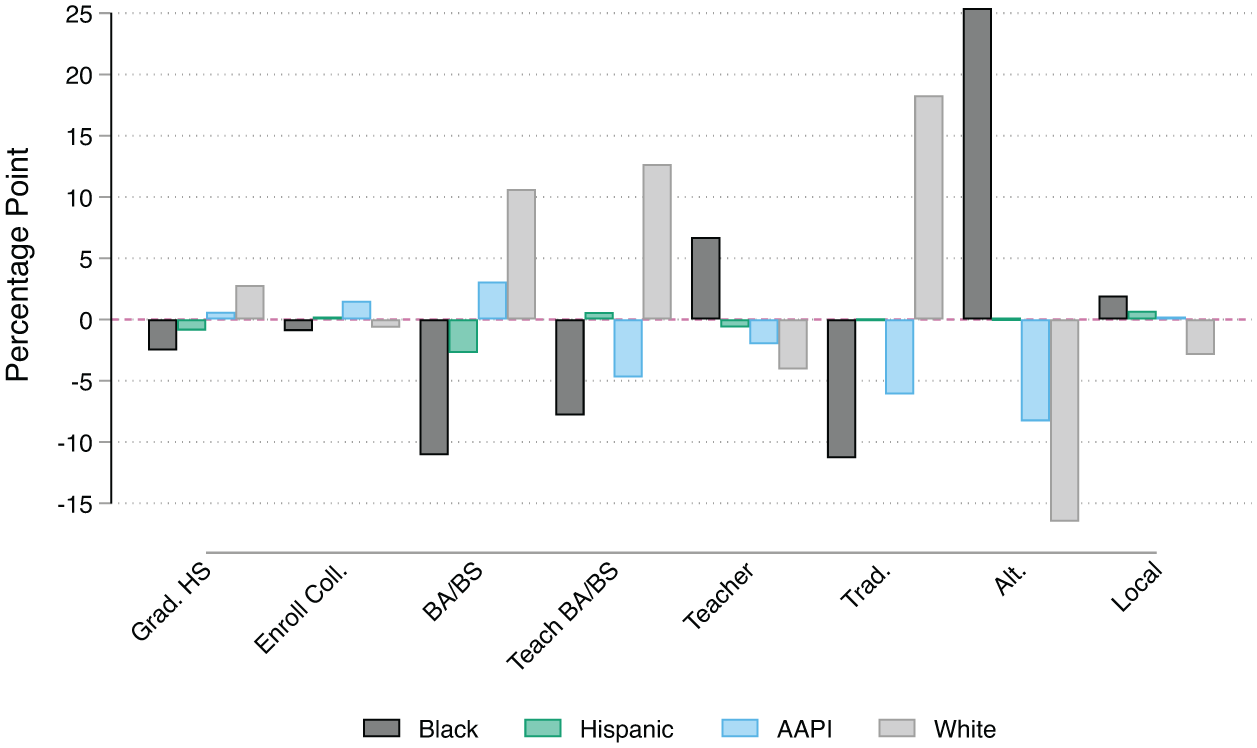
Step-to-step changes in demographic makeup for full state sample.
Trends for Black individuals mirror those of White students in the opposite direction. Intuitively, this is because representation is roughly a zero-sum game: Black and White students made up over 80% of the Maryland public school population. Once again, trends in demographic representation for Black and White students differ dramatically between traditional and alternative pathways into teaching, which aligns with our findings from Figure 2. Black individuals, who comprised 38% of ninth graders, made up roughly 15% of college students who earned a bachelor’s degree in teaching and 12% of hired teachers with a traditional license, but 48% of individuals hired to teach through an alternative pathway. In fact, Black individuals made up a plurality of alternatively certified teachers (40% were White).
That said, Black individuals from Baltimore City and Prince George’s County maintained and even increased their demographic share across the various pathway steps from high school to teaching. There was only a slight decrease in their representation among students who earned a bachelor’s degree in teaching, which is the stage where representation decreased the most for other subgroups of Black students. One explanation may be that three out of four HBCUs in the state, all of which have teacher preparation programs, are located in these two counties. We exclude representation among alternatively certified teachers from the bottom panel of Figure 3 to make the visual easier to see and interpret. For all subgroups of Black students, representation increased substantially among teachers who entered through an alternative route, and the trend for each subgroup broadly matches the average trend at the state level (see Supplemental Appendix Figure A3 and Supplemental Appendix Table A4).
In Supplemental Appendix Tables A3 and A4, we explore another potential pathway into the teaching profession that runs through an associate’s degree and the state’s associates of arts in teaching (A.A.T.). This pathway may be a reasonable policy focus given that 2-year institutions are a common starting point for postsecondary education for many students (Figure 2). Hispanic students increased their demographic representation at both stages: 13% of students who earned an associate’s degree and 14% who earned an associate’s degree in teaching were Hispanic, compared to 11% of ninth graders who were Hispanic. However, representation of Black students at these stages decreased substantially: compared to 34% of college students who were Black (and 34% of students enrolled in 2-year institutions), 20% of associate’s degree recipients were Black, and only 7% of recipients of the associate’s degree in teaching were Black.
Policy Shocks and Data Projections to Expand Pathways Into Teaching
Finally, in Figure 5, we plot our projections of the racial composition of the teaching force as a function of the size of hypothetical policy shocks to the number of students who progress through each stage of the teacher pathway. The horizontal axis measures the magnitude of the policy shock, from 0% to 30%. Thirty percent is the magnitude of the policy shock that brings the high school graduation rate for Black and Hispanic students to roughly 100%, and it is a larger effect for high school graduation, college enrollment, and college graduation than we might expect to see based on prior literature (see discussion above). In Supplemental Appendix Table A5, we convert percent changes into percentage point changes for different groups and pathway steps. For example, a 30% increase represents a 24 pp increase in high school graduation and a 14 pp increase in college graduation for both Black and Hispanic students.
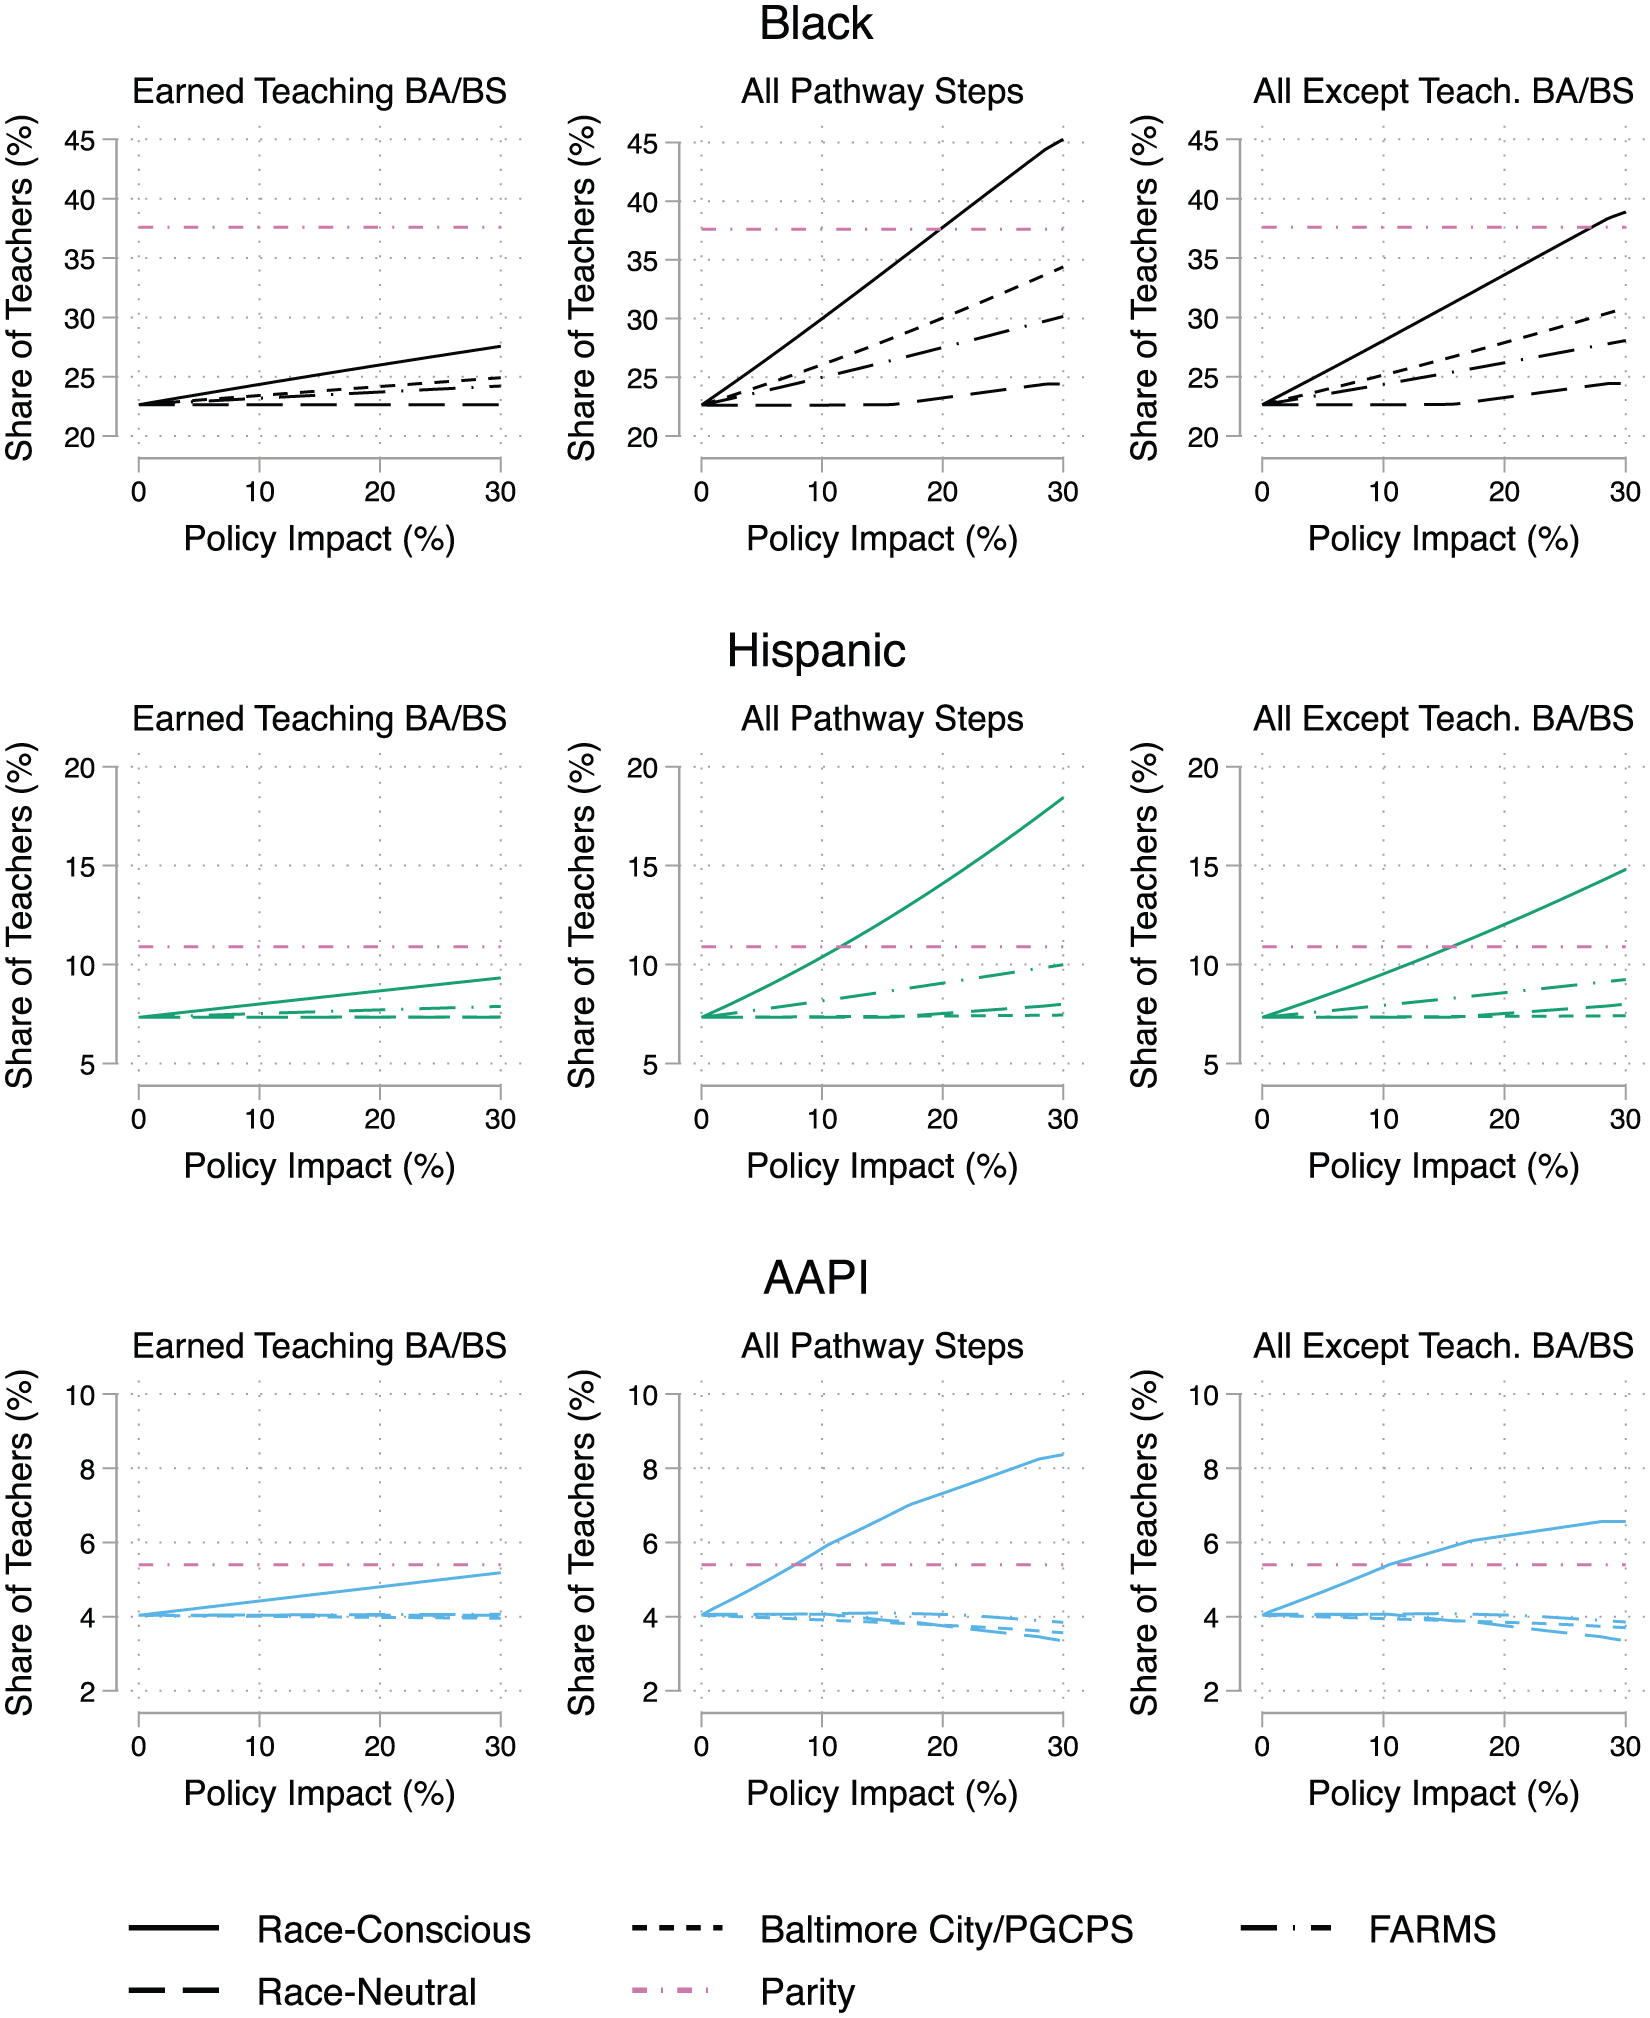
Projected effects of policy shocks on shifting teacher demographics.
The vertical axis shows the racial/ethnic composition of the teaching force. The Y intercept reports the status quo (i.e., no policy shocks, or X = 0). Moving from left to right on the X-axis shows how successively larger policy shocks to pathway transitions alter the demographic composition of the teaching force. For each race/ethnicity group, the horizontal dotted line identifies the share of students from that group. White individuals are excluded, as they are not the focus of policy intervention (i.e., there is no need to increase the share of White teachers).
The first column focuses on a single-stage policy shock that only targets receipt of a bachelor’s degree in teaching—a focus of many prior studies and policy interventions, given the immediate proximity between this stage in the pathway and eventually becoming a teacher. No matter the magnitude of the policy shock, we see minimal increases that fall far short of parity between Black or Hispanic teachers and students. This is true for other single-stage policy shocks that target high school graduation, college enrollment, and college graduation, etc. (see Supplemental Appendix Figure A5).
Therefore, we instead focus on multi-stage policy shocks that simultaneously target and impact multiple steps on the pathway toward becoming a teacher. Given the centrality of certification pathway in our earlier findings, we consider a multi-stage policy shock aligned to a traditional route that includes earning a bachelor’s degree in teaching (i.e., “All Steps”) versus a multi-stage policy shock that bypasses traditional undergraduate teacher education in favor of an alternative route. It does not make sense to design a policy projection specifically targeting alternative certification because, at least in Maryland, the vast majority of alternatively certified teachers do not engage in a specific program. Instead, they earn a bachelor’s degree in a non-teaching field, are hired by a school district under a conditional license, and then pursue full licensure requirements (e.g., coursework, testing) while they work full time. There are visual differences between these second and third columns in Figure 5. However, a multi-stage strategy that bypasses traditional undergraduate teacher education entirely does much more to diversify the profession than focusing solely on this stage.
Figure 5 further reports policy effects under four scenarios. “Race-conscious” policies only affect the transition of Black, Hispanic, or AAPI students through pathway stages. These are “affirmative action”-like policies that use race/ethnicity as a determining factor for receipt. Alternatively, “race-neutral” policies benefit all students, including White students, equally—for example, a statewide intervention that has homogenous effects. Two alternative policies fall somewhere in between by allocating resources based on correlates of race/ethnicity but not based on race/ethnicity directly: allocating resources based on FARMS or by district (focusing on Baltimore City and Prince George’s County). For both alternative scenarios, the policy shocks are conducted by increasing pathway completion rates for all FARMS or Baltimore City and Prince George’s County students, regardless of race/ethnicity, and then projecting the share of teachers across the entire state that are Black (or Hispanic or AAPI). These approaches are commonly proposed alternatives when race-conscious approaches may not be feasible (or legal, in the case of higher education; Menendian, 2025; Reardon et al., 2017). These approaches also align with our earlier findings showing that pathways into teaching vary not only by race/ethnicity but also by socioeconomic status and geography.
Unsurprisingly, fully race-neutral policy shocks have only modest effects on shifting teacher demographics and fall woefully short of achieving anything close to a representative teaching force. For example, race-neutral policies that impact all pathway stages (and for all groups) by 30% only increase the share of Black teachers by roughly 2 pp. The reason is intuitive: by improving everyone’s transitions along the teacher pathway, including that of White students, the substantial amount of White students’ pre-existing overrepresentation proves insurmountable when policy shocks add to their success on the teacher pathway. Only when all White students graduate high school, enroll in college, and complete college would race-neutral policies generate meaningful changes in the racial/ethnic composition of the teaching force. But, at that point, the policies would be race-neutral in name only. We can see this result in Figure 5, where the race-neutral trend is roughly flat. Small inflection points only occur at points of saturation (e.g., all White students graduated from high school or enrolled in college).
Race-conscious policy shocks provide some reason for optimism. Here, the solid lines show that the growth in teacher diversity is approximately linear in shock size. There are two reasons for this. First, a (potentially non-intuitive) finding from our mathematical derivation is that the rate at which individuals go on to become teachers after the policy shock is similar in magnitude to that of the policy shock itself, largely because the likelihood of going on to become a teacher is so low (see Supplemental Technical Appendix). For example, if high school graduation rates increase by 10% but only 1% of high school graduates go on to become teachers, the increase in teachers is only 0.1%. Second, by definition of our policy shock derivation, the policy intervention effects are independent across steps. This means that increasing the completion rates across five steps by 10% is approximately equivalent to increasing the completion rate of one step by 50%.
Figure 5 demonstrates that race-conscious policies can meaningfully alter teacher demographics, but only when multiple policy solutions simultaneously address various educational milestones and when each demonstrates substantial effects. For example, for Black individuals, parity between teachers and students (roughly 38%) is achieved with approximately 20% increases in each pathway stage. Parity is not the only benchmark to consider, but is discussed as one policy benchmark by several scholars (Dilworth & Coleman, 2014; Putman et al., 2016). For Hispanic students, parity is achieved with smaller policy effects of roughly 12%, while necessary policy effects for AAPI students are even smaller (roughly 8%) because student and teacher demographics for these groups already are in fairly close alignment (see Figure 1).
For Black students, a policy approach that specifically supports students from Baltimore City and Prince George’s County comes closest to the race-conscious benchmarks, while the approach that supports FARMS students lags behind but still fares much better than a race-neutral one. This finding may be intuitive, since Black students made up roughly 80% of the population in Baltimore City and Prince George’s County, while Black students made up 56% of FARMS students across the state. Our policy projections consider how demographics across the entire state shift under these two scenarios. Black students from Baltimore City and Prince George’s County made up 54% of the Black population across all 24 school districts, while Black FARMS students made up 65% of Black students in the state. The projections we visualize are driven by these two factors, as well as differential educational attainment and teaching rates across these subgroups. Hispanic students benefit from a FARMS-focused policy approach, but not from a strategy targeting Baltimore City and Prince George’s County—even though they were overrepresented in both groups relative to the state as a whole (Table 1). Neither policy alternative works for AAPI students—and both result in a decline in the share of AAPI teachers relative to baseline—because AAPI students were underrepresented in both groups.
In Supplemental Appendix Table A6, we probe the sensitivity of our data projections to one of its assumptions: that projected groups of newly induced high school graduates, college enrollees, etc., go on to subsequent pathway steps (e.g., graduating from college) and eventually enter teaching at the same rates we observe in the actual data. This assumption simplifies the mathematical work and makes interpretation straightforward, though it may not be reasonable since these newly induced students are, by definition, “marginal” completers who likely differ on other characteristics as well. These other characteristics may predict entry into teaching. To relax this assumption, we respecify our data projection to vary the marginal completion rate. A marginal completion rate <1 indicates that newly induced high school graduates, college enrollees, etc., go on to subsequent stages and eventually become teachers at lower rates than the actual data. In contrast, a marginal completion rate above 1 indicates that these newly induced students go on to subsequent stages at higher rates. In Supplemental Appendix Table A6, we vary the marginal completion rate and conduct the data projections for the race-conscious approach only. However, patterns for policy alternative (e.g., FARMS-conscious, geography-conscious) follow similar patterns.
The findings are intuitive: marginal completion rates <1 shift teacher demographics to a smaller degree than shown in Figure 5, while marginal completion rates >1 shift teacher demographics to a larger degree. For example, with a race-conscious approach targeting all pathway stages, a marginal completion rate of 0.75, and a policy shock of 20%, our model predicts that the share of Black teachers would be 32%, compared to 38% for a marginal completion rate of 1. With a marginal completion rate of 1.25 and a policy shock of 20%, the share of Black teachers would be 52%. Though we do not have concrete evidence, we posit that marginal completion rates <1 are more realistic than marginal completion rates >1. Students who are on the margin of graduating from high school may face additional barriers once they enter college, compared to students for whom high school graduation was easier to attain. If this is true, then our main results that use a marginal completion rate of 1 are likely lower bounds on what policy needs to achieve.
Discussion: Are These Policy Contours and Benchmarks Achievable?
The data projections presented in the previous section suggest that increasing Black students’ high school graduation, college enrollment and completion, and teacher-entry rates each by upwards of 20% may yield a representative teaching force in Maryland but only under race-conscious approaches that differentially target or differentially benefit Black students. A strategy that allocates resources to Baltimore City or Prince George’s County—rather than all Black students across the state—would require policy impacts above 30% to achieve similar teacher demographic changes, while a strategy that allocates resources to FARMS students across the entire state would require even larger impacts. The contours of these alternative policy strategies come from descriptive analyses showing that: (a) rates of becoming a teacher were far lower for Black versus White ninth graders; but that (b) among FARMS-eligible students, gaps were much smaller; and (c) in Baltimore City and Prince George’s County, Black individuals maintained their representation at each stage on the pathway from high school to teaching.
To what extent are these policy approaches and benchmarks feasible? We view the geography- or FARMS-focused policy approaches as more realistic than fully race-conscious approaches, given the longstanding failure of U.S. education systems to address race-specific policy problems with race-conscious strategies (Leonardo & Tran, 2013; Santos et al., 2010; Skiba, 2015). Teacher diversification efforts, in Maryland and elsewhere, date back to at least the 1980s (Madkins, 2011), with state policy documents describing strategies that, at least in theory, were meant to be race-conscious (MSDE, 1993). However, the demographic makeup of the teacher workforce has shifted very little. In contrast, providing interventions specifically to low-income students already is common practice in the U.S., through Title I and other federal and state policies. Allocating resources to specific districts is also common, such as with the Community Eligibility Provision that provides free meals to all students in a school or district when a certain share of students meets the required threshold. With these alternative approaches, policy impacts would need to be above 30%.
The roughly 30% goal is at the very top end of policy impacts derived from extant literature. When designing the policy projections, we thought broadly about educational interventions, drawing on impact studies both related to and more tangential to teaching. Here, we discuss specific approaches and strategies that Maryland (and other states) has or could engage.
Interventions Specifically Focused on Teaching
Maryland’s statewide high school CTE and dual-enrollment program, the Teacher Academy of Maryland, is a useful starting place for thinking about the reasonableness of the estimates we project. Its effects are now documented (Blazar et al., 2026), and it is one of the few studies to causally test the effects of a teacher recruitment program on career outcomes (Fleck et al., 2025). The authors find that the program positively impacted the high school graduation and college enrollment rates of Black students, but with impacts closer to 15% at each stage. It is possible that alterations to the program and scale-up in predominantly Black districts—including Baltimore City and Prince George’s County, where the program is offered in just a handful of high schools—could help increase effect sizes.
That the Teacher Academy program had both medium- and longer-term effects also is an indication that a singular intervention may increase the educational attainment of Black and other students of color at multiple points along the pathway to becoming a teacher. This makes the assumption of observing shocks (improvements) at each level reasonable.
PK12 Educational Interventions
Among a broader set of educational interventions that we reviewed, expanding access to pre-K can also increase critical educational attainment milestones, with potential spillover effects on becoming a teacher. For example, Campbell et al. (2008) estimated large short-term impacts of the Abecedarian program on Black students’ kindergarten readiness, which translated into sustained long-run effects on high school graduation (15 pp/23%), college enrollment (just under 30 pp/over 100%), and college graduation (17 pp/over 100%). This specific study is a bit of an anomaly, and the massive results on long-run outcomes have not been replicated in other intensive pre-K interventions (Burchinal et al., 2024). For example, universal pre-K in Boston increased college enrollment by roughly 6 pp/12%, on average across the district, but produced smaller college enrollment effects specifically for Black students and no effects on college graduation (Gray-Lobe et al., 2023). Nonetheless, the findings suggest that supporting the academic success and educational attainment of Black and other students of color very early in their schooling careers—long before students and their families think about career options—could go a long way in setting the foundation for movement along the teacher pathway once they reach high school.
Another prominent PK12 educational intervention that our literature review identifies can produce meaningful educational attainment effects for Black and other students of color is oversubscribed charter schools. In Boston (Angrist et al., 2016), Chicago (Davis & Heller, 2019), Los Angeles (Reber et al., 2024), and New York City (Dobbie & Fryer, 2015), charter schools that primarily serve Black or Hispanic students increase 4-year college enrollment between 10 and 20 pp, representing relative increases upwards of 47%. Furthermore, public charter schools hire many more Black and other teachers of color than traditional public schools (Gershenson, 2019), potentially because of their strong presence in urban districts. As with pre-K, though, the effects are not universal, and some charter studies document negative effects on high school graduation for Black students (Cullen et al., 2006). In Maryland, charters represent a small fraction of public schools, at <4%.
Beyond these examples, other PK12 interventions—in isolation or in combination—have the potential to make substantial progress toward the goals we lay out in this study. Reducing the frequency of chronic absence would increase school engagement and ultimately increase educational attainment, particularly among Black and other students of color, who have higher absence rates. Liu et al. (2021) suggest that eliminating 20 student absences would increase both high school graduation and college enrollment rates by about 40%. Class size reductions are another example. Random assignment to a small classroom in elementary school increased Black students’ college enrollment rate by about 20%, an effect that is more than twice as large as that for White students (Dynarski et al., 2013).
College Interventions
Interventions implemented with college students, including financial aid, miss the opportunity to impact educational attainment at multiple education levels (i.e., secondary, postsecondary) simultaneously but tend to produce meaningful effects across studies and contexts. LaSota et al. (2025) find that a variety of types of aid—including state, institutional, and merit—increase degree completion, with average effects across multiple studies in the range of 3 to 5 pp/10% to 15%. By definition, need-based financial aid programs target low-income students, which also differentially benefit Black and other students of color. College scholarships focused specifically on incentivizing students to major in teaching have long been described as a strategy for diversifying the teacher workforce (Carver-Thomas, 2018; MSDE, 1993). To our knowledge, though, their effects on career outcomes have not yet been identified—overall, let alone for Black and other students of color.
When it comes to influencing postsecondary students’ choice of major and college graduates’ choice of occupation—specifically selection into teaching—less is known. Indeed, this is a motivating factor for the current study. College students’ choice of major does respond to information about earnings, albeit inelastically, though this type of intervention is unlikely to be helpful in the context of teaching since education often is considered a relatively low-paying major (Wiswall & Zafar, 2015). Indeed, an information experiment focused specifically on the pecuniary and non-pecuniary benefits of teaching moved students’ college minor/major decisions very little (Christian et al., 2024).
Increasing the Likelihood of Teaching Through Teachers Themselves
Teachers provide a useful bookend for this discussion, as teachers are generally considered the most important school-provided input and are known to improve student outcomes in both the immediate and long term. For example, Jackson (2018) shows that in North Carolina, a 1 SD increase in ninth-grade teachers’ “non-cognitive” value-added increases students’ graduation rate by about 2%. Because graduating high school is a prerequisite to attending college, it is perhaps unsurprising to see that these teachers also increase behaviors associated with enrolling in postsecondary education, such as taking a college entrance exam (2%) and stating an intent to attend college (3%). Similar effects are documented for elementary and middle school teachers (Chetty et al., 2014). Papageorge et al. (2020) show that a malleable teacher behavior—holding high expectations of students—significantly increases educational attainment: a modest 15 pp increase in college expectations increases the likelihood that a student will earn a 4-year college degree by about 5%. These impacts are modest compared to the benchmarks we describe as necessary for shifting teacher demographics, but access to high-quality teachers across multiple school years can magnify the effects.
Similarly, while the current study is motivated by a general belief that students of all backgrounds would benefit from a more diverse and representative teaching force, Black and other students of color would benefit disproportionately. Black students in particular benefit from exposure to Black teachers. As early as elementary school, having a Black teacher significantly increases Black students’ long-run educational attainment: Gershenson et al. (2022) show that having at least one Black teacher between kindergarten and third grade increases high school graduation and college enrollment rates by 13% and 19%, respectively—much closer to the (roughly) 30% goal our data projections identify. There is admittedly a “chicken and egg” problem here. Increasing access to same-race teachers for Black students requires that we have more Black teachers to start. That said, there are also classroom assignment and teacher retention policies that could increase the odds that students of color experience same-race or same-ethnicity teachers at least once in elementary or middle school.
Conclusion
In sum, while there is no silver bullet, we have a robust body of credible evidence regarding interventions that could be deployed at every level of schooling—particularly in elementary and middle school—that improve achievement and attainment in both the short and long run—and in turn could support Black and other students of color in achieving critical milestones that are prerequisites for becoming a teacher. Programs and supports that start early in students’ careers can impact multiple outcomes along the pathway from PK12 into teaching—a necessary requirement from our data projections—and those that focus specifically on teaching have the benefit of increasing these educational attainment steps while also impacting the likelihood of becoming a teacher.
At the same time, a limiting factor for policymaking is the need for race-conscious approaches—or reasonable alternatives—which have proven quite challenging in education policymaking and other contexts (Leonardo & Tran, 2013; Santos et al., 2010; Skiba, 2015). Many of the interventions described above differentially benefit Black and other students of color, which is why we highlight them. However, most are not designed through a race-conscious lens, with the possible exception of some urban teacher residency programs that adopt culturally responsive approaches (Goings et al., 2018; Herman, 2023). As described by other scholars, race-consciousness is not just about differentially providing resources to Black students, but acknowledging and seeking to address deep histories of (de)segregation and Black teacher displacement (Carter Andrews et al., 2019; Farinde et al., 2015; Madkins, 2011). In the absence of race-conscious approaches, policy effects will need to be much larger to achieve greater alignment between teacher and student demographics.
Finally, our findings call attention to alternative licensing and certification policies that bypass undergraduate (or graduate) teacher education, which is the only part of the teacher pathway where Black individuals in Maryland make up a (slight) majority. Alternative certification has been around for decades, without shifting teacher demographics on the scale that is necessary (Redding, 2022). We are not naïve in assuming that going all-in here will be a panacea. That said, the patterns we observe in Maryland suggest that it is time we start thinking of alternative certification as a true teaching pathway—one that likely starts back in PK12 schooling, as students weigh potential career options—and one that is not really “alternative” at all. Rather, majoring in a non-teaching field and then pursuing teaching upon graduation is a very common and acceptable pathway into teaching, particularly for Black and other individuals of color.
Supplemental Material
sj-pdf-1-epa-10.3102_01623737251412443 – Supplemental material for Disparate Pathways: Understanding Racial Disparities in Teaching
Supplemental material, sj-pdf-1-epa-10.3102_01623737251412443 for Disparate Pathways: Understanding Racial Disparities in Teaching by David Blazar, Max Anthenelli, Wenjing Gao, Ramon Goings and Seth Gershenson in Educational Evaluation and Policy Analysis
Footnotes
Acknowledgements
This research was supported by the Maryland Longitudinal Data System (MLDS) Center. We are grateful for the assistance provided by the MLDS Center. All opinions are the authors’ and do not represent the opinion of the MLDS Center or its partner agencies.
Declaration of Conflicting Interests
The authors declared no potential conflicts of interest with respect to the research, authorship, and/or publication of this article.
Funding
The authors disclosed receipt of the following financial support for the research, authorship, and/or publication of this article: The research reported here was supported by the Institute of Education Sciences, U.S. Department of Education, through Grants R305A210031 and R305S240013 to the University of Maryland, College Park. The opinions expressed are those of the authors and do not represent the views of the U.S. Department of Education.
Supplemental Material
Supplemental material for this article is available online.
Notes
Authors
DAVID BLAZAR, EdD, is an associate professor of Education Policy at the University of Maryland, College Park. His research examines the efficient, effective, and equitable allocation of educational resources, focusing in particular on resources related to teachers.
MAX ANTHENELLI, MEd, is a doctoral student in the Education Policy program at the University of Maryland, College Park. His research focuses on identifying policy barriers to equity in K–12 education systems, emphasizing the role of teachers in addressing those barriers.
WENJING GAO, MA, is a PhD candidate in the College of Education at the University of Maryland, College Park. Her research focuses on school discipline policies and teacher workforce diversity.
RAMON GOINGS, PhD, is an associate professor in the Language, Literacy, and Culture doctoral program at the University of Maryland, Baltimore County. His research explores the academic and social experiences of gifted/high-achieving Black males PK-PhD, diversifying the teacher and school leader workforce, and investigating the contributions of Historically Black Colleges and Universities.
SETH GERSHENSON, PhD, is a professor of Public Policy in the School of Public Affairs at American University and a Research Fellow at the Institute of Labor Economics (IZA). His research focuses on the economics of education and education policy analysis, including teacher labor markets, parents’ and students’ time use, summer learning loss, the causes and consequences of student absences, teacher diversity, and the role of expectations in the education production function.