
Abstract
Millions of community college students enroll in noncredit programs every year—most in occupational training—but there are few large-scale studies of how these programs affect students’ labor market opportunities. Here, we estimate returns to community college noncredit occupational training by applying individual fixed effects models to longitudinal administrative data from Texas. We find a modest but statistically significant increase in average quarterly earnings of approximately $2,000 per year (2019 dollars), emerging during the 2 years after training. This is a 3.8% increase over average pre-training earnings and is commensurate in magnitude with the typically short duration of the training, averaging about 90 hours. Returns vary by field of study, training type, training duration, and number of training spells. Our findings speak directly to ongoing policy discussions and rulemaking regarding the implementation of Workforce Pell Grants, which provide funding for short-term training, potentially including some community college noncredit programs. Our findings also inform state-level policy initiatives aimed at strengthening workforce readiness in priority industries—efforts that often rely on community colleges as central partners.
Open-enrollment occupational training acco-unts for a sizeable share of community college noncredit education and is aimed at preparing students with professional or vocational skills to (re)enter the workforce, maintain a position or advance in a current line of work, or transition to a new line of work (Bahr et al., 2022; D’Amico et al., 2014; Van Noy & Hughes, 2022). In some instances, noncredit training culminates in a professional certification or license (Cronen et al., 2016; Xu et al., 2024). Alternatively, noncredit education may consist of employer-contracted occupational training (or simply contract training) in which community colleges partner with employers to provide noncredit instruction to meet particular training needs for new or incumbent workers (Dougherty & Bakia, 2000).
Despite the expansive scope of community college noncredit education, there is little large-scale, empirical research on it, mainly due to data constraints at the state and national levels (Erwin, 2019; A. R. Sykes et al., 2014). This dearth of evidence on the effectiveness of noncredit training in facilitating employment opportunities and earnings gains for students has hindered efforts to expand federal student aid to noncredit programs at community colleges (Kreighbaum, 2019).
In this study, we investigate the labor market outcomes of community college noncredit students. We use longitudinal, administrative data from Texas to estimate the relationships between enrollment in occupational training and students’ post-college earnings outcomes, as observed in quarterly unemployment insurance (UI) records. We first provide descriptive statistics on noncredit students’ characteristics, enrollment patterns, earnings, and employment trends that inform our empirical strategy. We then estimate the labor market returns to noncredit attendance using individual fixed effects empirical models.
We find that noncredit occupational training is associated with meaningful earnings gains for students of about $2,000 per year by 2 years after training (2019 dollars). Gains vary substantially by field of study. For instance, gains in Transportation and Engineering Technologies are two to four times greater than the average, while gains in some other fields—Business & Marketing and Information Sciences, Communication, & Design, for instance—are statistically indistinguishable from zero. Returns are stronger for male students and for contract training participants. Returns also vary by intersecting combinations of gender, field of study, and whether students participate in contract training or open-enrollment occupational education. Earnings gains generally are larger for students who engage in training of a longer duration, although this pattern is not entirely consistent across fields of study. Finally, gains are larger for the first spell of training; gains for the second and third spells are substantially smaller, approaching zero by the third spell.
Our analysis provides some of the first evidence on the economic returns to noncredit occupational training at community colleges. The magnitudes of the estimated returns to noncredit are comparable to those of short-term, credit-bearing certificate programs in community colleges, especially with respect to the variation in returns by field of study and gender (Belfield & Bailey, 2017a). Our results are directly relevant to ongoing policy discussions and rulemaking regarding the implementation of Workforce Pell Grants for short-term, occupational training programs, which could include some noncredit programs (One Big Beautiful Bill Act, Pub. L. No. 119-21, § 83002, 139 Stat. 72, 2025)).
Background
What Is Community College Noncredit Education?
Often referred to as the hidden college, noncredit education plays a significant yet underappreciated role in higher education (Voorhees & Milam, 2005). Noncredit instruction takes place at most types of postsecondary institutions, but it is especially prominent in the community college sector (Voorhees & Milam, 2005). Estimates suggest that noncredit enrollments at community colleges total at least four million students annually (AACC, 2023) and exceed enrollments in credit-bearing certificate and degree programs in some institutions and states (Bailey et al., 2003; Iowa Student Outcomes, 2021).
Noncredit education serves a number of purposes. Chief among them is occupational training—preparing students to (re)enter the workforce, maintain or advance in their current job, or obtain a new job (Van Noy & Jacobs, 2009). Employers also may fund participation in occupational training through contractual arrangements with colleges to satisfy specific training needs for their workers (Dougherty, 2003; Dougherty & Bakia, 2000; Miller, 2022). Accordingly, we distinguish between the two types of noncredit occupational training:
Open-enrollment occupational training is professional or vocational skill development that is designed by colleges to meet student demand, is typically paid for by the student or through a student-focused financial aid program, and, in some cases, prepares students to earn an industry-recognized certification or license (D’Amico et al., 2014; Erwin, 2019; Van Noy & Hughes, 2022).
Contract training is professional or vocational skill development that is designed by colleges to meet the demand of particular employers, paid for by employers, and delivered to employers’ new or incumbent workers (D’Amico et al., 2014; Dougherty, 2003; Dougherty & Bakia, 2000; Erwin, 2019; Miller, 2022).
Open-enrollment occupational training and contract training are phrases that are prevalent in the literature on noncredit education (D’Amico et al., 2014; Dougherty & Bakia, 2000), although some states and institutions use other vernacular to refer to similar types of training (Erwin, 2019). In addition, while outside the scope of this analysis, many community colleges also provide developmental education, adult basic education, English-as-a-second-language, and recreational and personal interest learning opportunities through their noncredit divisions (Bahr et al., 2022; D’Amico et al., 2014; Van Noy et al., 2008).
Empirical research on the characteristics, enrollment patterns, and outcomes of community college noncredit students is limited due to historical data constraints (Erwin, 2019; A. R. Sykes et al., 2014). The handful of available studies nevertheless reveal that noncredit students tend to be older than students in credit programs (Bahr et al., 2022; Xu & Ran, 2020). Noncredit students typically enroll for brief periods of time, attempt few courses, accumulate a limited number of contact hours, and rarely transition into credit programs or coursework (Bahr et al., 2022; Xu & Ran, 2020). Despite the sizeable footprint of noncredit occupational training, rigorous evidence on the labor market outcomes of noncredit students is scarce (Bahr et al., 2022; Xu et al., 2024). Closer investigation of the labor market outcomes resulting from participation in noncredit occupational education is sorely needed to understand its contributions—if any—to participants’ economic opportunities.
How Is Noncredit Education Distinct From Credit Education?
Several key distinctions between credit and noncredit education warrant elaboration. First, colleges quantify credit and noncredit education in different ways. Credit education is based on the credit hour, representing 1 hour of weekly instruction along with 2 hours of related coursework outside of class per week throughout an academic term (U.S. Department of Education, 2022). In contrast, colleges quantify noncredit education in contact hours, where one contact hour is equivalent to an hour of instructional activity (U.S. Department of Education, 2022), or sometimes in continuing education units, each of which represents 10 contact hours (International Accreditors for Continuing Education and Training, 2018).
Second, noncredit divisions tend to exist as standalone entities within colleges, separate from credit divisions and having their own facilities, faculty, staff, courses, policies, procedures, and cultures (Buckwalter & Maag, 2019). Students enrolled in noncredit programs typically do not have access to the same institutional services available to credit students (Education Strategy Group, 2020).
Third, colleges customarily make noncredit courses available year-round on a rolling basis (Van Noy & Hughes, 2022). Courses may last a single day or several weeks or months (Xu & Ran, 2020), although estimates indicate that about two-thirds (63%) of community college noncredit offerings are shorter than 100 contact hours (Jacoby, 2021). While noncredit coursework does not result in credit-based postsecondary credentials, colleges frequently maintain transcripts and issue certificates of completion, and some occupational noncredit is designed to prepare students to earn third-party industry certifications or licenses (Van Noy et al., 2008).
Fourth, the features of credit-bearing courses and programs remain largely consistent across the public 2-year sector because the credit hour is enshrined in federal, state, and institutional policies, such as federal student aid, accreditation, state authorization, state appropriations, data reporting, faculty workloads, and so forth (Voorhees & Milam, 2005). Conversely, community colleges have considerable autonomy and minimal external oversight in their noncredit programs, enabling administrators to respond quickly to changes in student, employer, and community needs.
The trade-off for the autonomy is that noncredit courses rarely have been eligible for federal financial aid, usually because they do not meet minimum duration requirements. Historically, students and employers have covered the fees associated with noncredit participation, which vary widely within and across states (Oleksiw et al., 2007). Some states impose fee caps on noncredit courses, and others subsidize noncredit education to varying degrees through general funds (Van Noy et al., 2008). Noncredit students also may qualify for state grants or employer-sponsored funding (Bishop, 2019; Jacoby, 2017; Oleksiw et al., 2007; Van Noy et al., 2008). Recently, however, eligibility for federal Pell Grants has been expanded to include short-term, workforce training programs (One Big Beautiful Bill Act, Pub. L. No. 119-21, § 83002, 139 Stat. 72, 2025). The Workforce Pell Grants support students enrolled in programs with as few as 150 hours of training completed over 8 weeks, making some noncredit occupational training programs eligible if other requirements are met (e.g., job placement rate, earnings outcomes relative to program tuition and fees).
What Is the Landscape of Community College Noncredit Education in Texas?
Noncredit (i.e., continuing education) courses offered by public 2-year colleges in Texas are intended to provide “a quick and flexible response to business, industry, and student needs for intensive preparatory, supplemental, or upgrade training and education” (Texas Higher Education Coordinating Board [THECB], 2023, p. 38). Institutions may charge tuition and fees for noncredit courses (THECB, 2025). Noncredit courses are also eligible for state appropriations, though funded courses must have explicit workforce objectives and are subject to a state approval process (THECB, 2025). Funded noncredit occupational courses can include both open-enrollment occupational training and contract training (THECB, 2025).
The state requires colleges to report information on state-funded noncredit courses and students in these courses to the THECB, but reporting on other unfunded courses—for instance, personal interest or basic skills—is not required. A recent, nationwide survey of community college workforce education suggests that more than two-thirds (68%) of noncredit enrollments in Texas are in workforce education, with the remaining one-third being in remedial, recreational, or other types of non-occupational courses that are excluded from reporting requirements (Jacoby, 2021).
Students participating in funded noncredit occupational training in Texas can earn a noncredit credential conferred by the institutions called an Occupational Skills Award (previously a Marketable Skills Achievement Award; THECB, 2025). 1 Very few noncredit students earn this credential (Bahr et al., 2022), likely because students are eligible only if they complete course sequences of 144 to 359 contact hours in length (THECB, 2025). Noncredit occupational courses also are commonly a stepping stone to professional certification or licensure (THECB, 2025), but, like most state higher education agencies, THECB does not collect information on these third-party industry credentials.
What Are the Labor Market Returns to Short Community College Programs?
The existing evidence on the returns to noncredit education is largely descriptive in nature (Bahr et al., 2022). We identified one prior evaluation of a contract training partnership between a manufacturing firm, a service firm, and a community college in New Jersey (Krueger & Rouse, 1998). The authors found a small, positive relationship between participation in training and earnings for employees of the manufacturing firm, but not employees of the service firm. We identified another, more recent evaluation by Xu et al. (2024), who examined students’ earnings outcomes after completing third-party, industry-recognized credentials associated with noncredit programs in Virginia community colleges. The study found average gains of $843 in quarterly earnings (2019 dollars) among employed, credential-completers up to 6 years after enrollment. Returns varied by field, with gains as high as $1,618 for Transportation and $925 for Precision Production (2019 dollars). The authors also noted improved employment probabilities after completion. (Note that we inflation-adjusted these and all other estimates discussed in this article to 2019 dollars to ensure comparability across findings.)
Beyond these two studies, several other lines of research on CTE programs could inform expectations about earnings outcomes of noncredit students, such as analyses of the returns to secondary-level CTE pathways (Brunner et al., 2023; Ecton & Dougherty, 2023); credentials from public, sub-baccalaureate technical centers (Carruthers & Sanford, 2018); and certificates from for-profit colleges (Cellini & Turner, 2019); as well as participation in government-sponsored job training (Andersson et al., 2022; Fortson et al., 2017; Heinrich et al., 2013) or employer-provided job training (Fialho et al., 2019; Saraf, 2017). We focus our review on the closest parallel to community college noncredit education, drawing on the sizeable literature on the labor market returns to credit-bearing community college programs and credentials (Belfield & Bailey, 2011, 2017a; Carruthers & Jepsen, 2021; Lovenheim & Smith, 2022). Most relevant to our analysis of noncredit occupational training is the existing work on the returns to short certificates from community colleges and the less extensive literature on returns to community college credits.
Returns to Short Certificates
Short certificates typically are defined as those requiring no more than one academic year and 30 or fewer credits (equivalent to 900 contact hours; A. Sykes, 2012) to complete, which overlaps with the durations of some noncredit programs (Baum et al., 2021; Jacoby, 2021). Like noncredit programs, short certificates are predominantly issued in CTE fields (Baum et al., 2021), and recipients of short certificates are disproportionately older learners (Baum et al., 2021), much like noncredit occupational students (Bahr et al., 2022).
The existing evidence on the returns to short certificates from community colleges is mixed (Bahr, 2016; Bahr et al., 2015; Baum et al., 2021; Bettinger & Soliz, 2016; Dadgar & Trimble, 2015; Darolia et al., 2023; Jepsen et al., 2014; Liu et al., 2015; Minaya & Scott-Clayton, 2022; Stevens et al., 2019; Xu & Trimble, 2016). Some studies show positive economic returns for students completing short certificates (Bahr, 2016; Jepsen et al., 2014; Minaya & Scott-Clayton, 2022; Xu & Trimble, 2016). Darolia et al. (2023), for instance, estimated gains of $320 per quarter (2019 dollars) for short certificates between one and 36 credits in length in Kentucky. The authors also found that returns to very short certificate programs of one to six credits in length did not appreciably differ from those between seven and 36 credits in length. At the same time, other studies reveal null effects of short certificates on students’ earnings or even earnings declines (Dadgar & Trimble, 2015; Jaggars & Xu, 2016; Liu et al., 2015). For instance, Liu et al. (2015) estimated negative returns between –$327 and –$407 per quarter (2019 dollars) for men and women, respectively, who completed certificates in North Carolina.
The returns to short certificates notably vary by field of study. As one example, Xu and Trimble (2016) found the highest earning short certificates in North Carolina were in Protective Services ($2,964 per quarter; 2019 dollars) and Construction ($272), while in Virginia, they were in Allied Health ($443) and Mechanics, Repair, & Welding ($307). Moreover, field-specific returns to short certificates can be inconsistent across states. For instance, Xu and Trimble (2016) found negative returns to short certificates in Protective Services in Virginia, contrasting with the positive returns they found in North Carolina. This context-specific variability may be driven by state-to-state differences in demand for particular skills or the existing supply of workers with those skills in the time period under study (Lovenheim & Smith, 2022).
Returns to Credits
Other researchers have examined the returns to community college credits (Bahr, 2019; Bahr et al., 2023; Hodara & Xu, 2016; Jacobson et al., 2005; Schudde & Shea, 2022). A sizeable percentage of community college students do not complete credentials (Causey et al., 2022). Hence, understanding the economic returns to accumulated credits is of substantial interest to community college stakeholders. As a related matter, many noncredit students do not complete credentials either (Bahr et al., 2022), and it is an open question whether students realize economic value from noncredit coursework.
In a seminal study on the labor market returns to community college, Jacobson et al. (2005) jointly estimated the returns to community college attendance and the returns to credits accumulated by displaced workers in Washington. The authors found that men experienced long-run earnings effects from attending community college that approached $540 per quarter over time (2019 dollars), while women experienced gains of $77 per quarter. Returns increased by $15 for men ($14 for women) for each credit accumulated. Long-run returns were higher for groups of students who completed a greater number of credits, for instance $1,664 for men who completed 75 or more credits ($1,760 for women) as compared with $227 for men who completed five or fewer credits ($114 for women). Returns to vocational credits outpaced those from academic credits for men and women alike. Similarly, Bahr (2019) found positive returns to accumulated credits in CTE fields, such as Protective Services and Engineering Technologies, for community college students in California, as did Hodara and Xu (2016) in Virginia and North Carolina, and Schudde and Shea (2022) in Texas.
Hypotheses
Overall, the literature on the returns to community college certificates and credits provides several preliminary hypotheses for this analysis. First, we expect the returns to noncredit occupational training to be modest in magnitude, given prior evidence demonstrating the positive correlation between earnings and program length (Belfield & Bailey, 2017a; Card, 1999) and the comparatively short durations of noncredit training spells (Bahr et al., 2022; Jacoby, 2021; Xu & Ran, 2020). Second, we expect the magnitudes of the returns to noncredit training to be comparable to those of credit-bearing short certificates (Darolia et al., 2023) and, most obviously, industry credentials affiliated with noncredit programs (Xu et al., 2024) due to comparable durations of program lengths. Third, we expect returns to be positively correlated with the duration of the noncredit training programs themselves (Jacobson et al., 2005). Finally, we expect substantial heterogeneity in the returns to noncredit training by field of study (Xu & Trimble, 2016) and gender (Carruthers & Jepsen, 2021), with stronger returns in fields that correspond to occupations predominated by male workers (Ositelu et al., 2021) as well as in other fields that are in greater demand in Texas.
Economic theory informs our expectations as well. Human capital theory views education as an investment of time and resources by individuals to enhance their productive capacities (Becker, 1994; Toutkoushian & Paulsen, 2016). Human capital represents individuals’ accumulated knowledge, skills, and abilities, while productivity represents individuals’ abilities to perform tasks or services within a specified time period (Becker, 1994; Toutkoushian & Paulsen, 2016). The theory stipulates that, as individuals attain higher levels of education, they become more productive and skilled, and that employers reward more productive workers with higher compensation. Education is positively correlated with productivity, and productivity is positively correlated with earnings. Individuals with more education are expected to earn more money than those with less education all else being equal (Becker, 1994; Toutkoushian & Paulsen, 2016). By extension, completing longer programs of study should be more remunerative for students than completing shorter programs, all else equal.
The enrollment decisions of noncredit students also may be understood through a human capital perspective. Theory suggests students enroll in noncredit education when the present value of discounted benefits exceeds the costs (Becker, 1994). Put simply, the benefits include, but are not limited to, earnings gains (i.e., expected returns), while the costs include, but are not limited to, tuition and fees (i.e., direct costs) and foregone earnings during enrolled periods (i.e., opportunity costs). All else being equal, students are more likely to enroll in noncredit education when expected returns are higher, direct costs are lower, and opportunity costs are lower. Expected returns may be higher if the skills provided by noncredit occupational training are increasingly in demand for an occupation, industry, or region. Direct costs may be lower if students are eligible for financial aid or if an employer offers to cover training costs. Opportunity costs may be lower if an individual becomes unemployed, faces wage reductions, or if the broader economic environment for an occupation, industry, or region recedes. The circumstances that induce students to enroll are useful to keep in mind when modeling the returns to noncredit attendance, as factors that determine enrollment may jointly determine earnings levels later on (Belfield & Bailey, 2017b).
Data
We used state-level administrative data from the THECB and Texas Workforce Commission (TWC), accessed through a restricted-use data agreement with the University of Texas at Austin’s Education Research Center (Texas ERC). The THECB data include information on student demographics and enrollment records for both credit and noncredit coursework (the latter is referred to as continuing education in Texas) in public 2-year, postsecondary institutions in Texas, including the 50 community college districts and the state’s technical college system (hereafter referred to as community colleges or public 2-year colleges for brevity). The records were matched with TWC’s UI records to obtain information on students’ quarterly earnings.
The THECB data have two notable limitations. First, the data do not cover all community college noncredit course-taking in Texas. As mentioned earlier, THECB requires public 2-year institutions to report information only for state-funded noncredit courses, and Texas students who participated exclusively in funding-ineligible coursework are not represented in the administrative data and, therefore, are omitted from our analysis. Second, the THECB data do not contain noncredit transcript records. Rather, the data provide aggregate information about students’ noncredit enrollments measured on a quarterly basis, for instance the total number of noncredit contact hours that students attempted in each quarter in which they were enrolled in a Texas 2-year college and the field of study (Classification of Instructional Programs [CIP] code) in which students took most of their noncredit contact hours in each quarter. The data do not provide the specific noncredit courses in which students enrolled or the mixture of fields of study in which students may have participated in a given quarter. Given the discrete and terminal nature of most noncredit course-taking, however, the quarterly aggregated information for each student likely tracks closely with transcript records (Bahr et al., 2022).
Sample
Our final analytic sample totals 128,138 unique students who participated exclusively in noncredit education in public 2-year colleges in Texas and who first enrolled between Fall 2011 and Fall 2014. We observed these students for 5 years (20 quarters) before they enrolled in noncredit education and over 5 years (21 quarters) afterwards (inclusive of the entry quarter). The 5-year, post-college observation period follows Belfield and Bailey (2017b), who demonstrated that analyses employing shorter time windows understate long-run returns to sub-baccalaureate education. The resulting panel dataset spans Fall 2006 (2006Q4) through Fall 2019 (2019Q4) and totals 5,252,493 student-quarter observations.
All Texas public 2-year colleges offered at least one funded noncredit occupational course in the time periods under study. Combined, a plurality of the courses offered across all Texas 2-year colleges were in the Information Sciences, Communication, & Design field (19%) during the analysis period. The Business & Marketing and Allied Health fields each accounted for an additional 14% of all noncredit courses offered, respectively. Engineering Technologies and Protective Services accounted for 12% each.
The distribution of courses offered by field of study differed across colleges. For example, five institutions offered over half of their noncredit courses in Information Sciences, Communication, & Design. Three colleges offered more than half of their noncredit courses in Mechanics, Repair, & Welding. Three more colleges offered over half of their noncredit courses in Protective Services. Two colleges offered more than half of their noncredit courses in Engineering Technologies, one college in Transportation, and one other college in Allied Health. 2
Between 80,000 and 100,000 students per year enrolled in funded noncredit occupational training in Texas in the time periods covered by this analysis, although annual enrollments have tapered in recent years (Keller, 2021). Prior research shows that Texas noncredit occupational training students are overwhelmingly age 25 or older, majority male, and racially and ethnically diverse (Bahr et al., 2022). Demographically, the state’s population of noncredit students does not vary substantially from Texas’s adult population, although the former skews slightly younger and male than the latter (Bahr et al., 2022). Demographic differences between noncredit students and those who enroll in credit-bearing community college education in the state are much starker, especially regarding the age at which students first enroll (Bahr et al., 2022), which suggests that noncredit occupational training provides educational access to a distinctive segment of the Texas population that credit-bearing coursework is not reaching.
The analytic sample for this study is the product of several inclusion criteria. We began with a broad pool of students who enrolled in noncredit education in Texas public 2-year colleges from Fall 1999 (1999Q4) through Fall 2019 (2019Q4). We retained from this pool only the students who had valid Social Security numbers as students lacking this information cannot be uniquely identified with certainty across Texas community colleges. We also limited the sample to students who first enrolled in noncredit education between Fall 2011 (2011Q4) and Fall 2014 (2014Q4). The entry cohort criterion balanced competing considerations of recency and relevance to present day, how long we were able to observe students’ earnings after enrollment, and statistical power.
We next implemented sample restrictions that facilitate the estimation of students’ earnings outcomes (Bahr, 2016; Belfield & Bailey, 2017b; Carruthers & Sanford, 2018; Minaya & Scott-Clayton, 2022; Stevens et al., 2019). We kept only students who were aged 23 through 60 when they entered noncredit education. Students younger than 23 years at entry did not have five full pre-enrollment years of earnings history while of working age. Younger adults’ earnings patterns oftentimes are unstable, making it especially important to have pre-enrollment earnings trends of adequate length to capture their intrinsic productivity levels for the sake of individual fixed effects models (Stevens et al., 2019; Carruthers & Sanford, 2018). Students older than 60 at entry likewise were excluded as they would not have a full 5 post-enrollment years of earnings before reaching retirement age. We additionally kept only those students who had at least four quarters of nonzero quarterly earnings records before enrolling in noncredit education as well as at least four quarters of nonzero quarterly earnings records after enrolling in noncredit education. These sample restrictions further enable the modeling of earnings trends prior to noncredit entry and following noncredit exit, albeit at the expense of reducing the external validity of results to noncredit students with some level of sustained attachment to the workforce in Texas as working-age adults (Belfield & Bailey, 2017b; Carruthers & Sanford, 2018; Stevens et al., 2019).
Of the remaining 192,830 students, we excluded those who enrolled in credit education or received a credit credential from a Texas community college in the 5 years before enrolling in noncredit education (9%) as well as the 5 years after initial noncredit entry (18%). This final criterion isolates the specific relationship between noncredit attendance and post-college earnings from any correlations between noncredit attendance and credit enrollment and between credit enrollment and post-college earnings. Of note, few students in our sample (<4%) were observed to be still enrolled in noncredit 5 years after initial enrollment or to have returned to take additional noncredit more than 5 years after entry.
Table 1 provides information on the composition of our analytic sample. Noncredit students in Texas who first enrolled between Fall 2011 and Fall 2014 were majority men (57%), plurality White (38%), and an average of 38 years old at entry. In addition, almost three-quarters of the students in our sample participated in open-enrollment occupational training as opposed to contract training (72% vs. 28%). 3 Noncredit enrollees were heavily concentrated in the fields of Engineering Technologies (17%); Business & Marketing (17%); Information Sciences, Communication, & Design (16%); and Allied Health (13%). 4
Characteristics of Noncredit Students
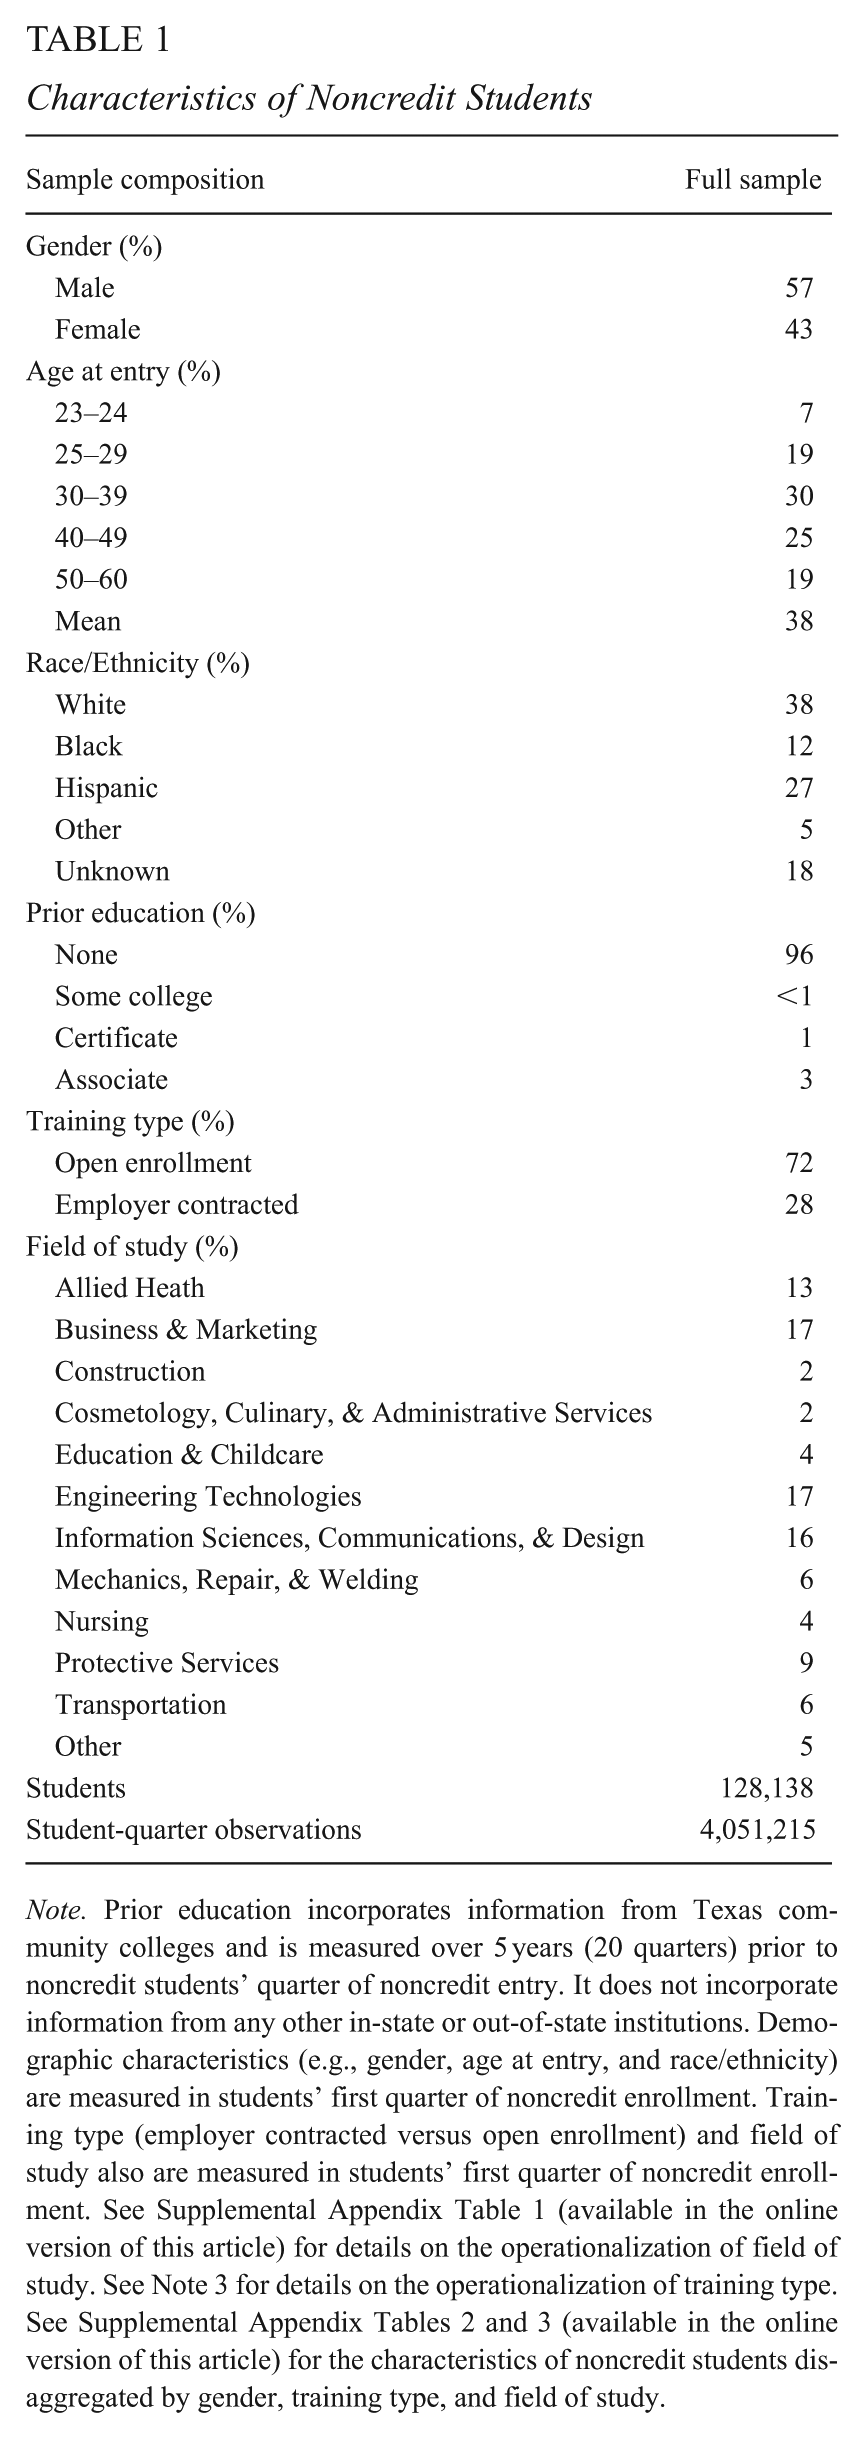
Note. Prior education incorporates information from Texas community colleges and is measured over 5 years (20 quarters) prior to noncredit students’ quarter of noncredit entry. It does not incorporate information from any other in-state or out-of-state institutions. Demographic characteristics (e.g., gender, age at entry, and race/ethnicity) are measured in students’ first quarter of noncredit enrollment. Training type (employer contracted versus open enrollment) and field of study also are measured in students’ first quarter of noncredit enrollment. See Supplemental Appendix Table 1 (available in the online version of this article) for details on the operationalization of field of study. See Note 3 for details on the operationalization of training type. See Supplemental Appendix Tables 2 and 3 (available in the online version of this article) for the characteristics of noncredit students disaggregated by gender, training type, and field of study.
Supplemental Appendix Tables 2 and 3 (available in the online version of this article) display information on the composition of selected subsamples of noncredit students. Men and women had comparable age and racial/ethnic distributions, but women were more likely to enroll in open-enrollment occupational coursework (78% of women vs. 67% of men). Women were heavily concentrated in Education & Childcare (89% female), Nursing (88%), and Allied Health (71%). Men were heavily concentrated in Transportation (92% male); Mechanics, Repair, & Welding (89%); and Engineering Technologies (86%).
There is evidence of field-specific sorting of students by age and race/ethnicity as well (Supplemental Appendix Table 3 in the online version of the article). Students aged 30 years and older accounted for about three quarters (74%) of the noncredit enrollees in our sample. They were overrepresented in Information Sciences, Communication, & Design (80% aged 30 and older) and Business & Marketing (79%) but underrepresented in Construction (66%) and Nursing (67%). Black students accounted for 12% of the sample; they were overrepresented in Cosmetology, Culinary, & Administrative Services (18% Black) and Nursing (16%) but underrepresented in Engineering Technologies(8%). Hispanic students accounted for 27% of the sample and were overrepresented in Construction (39% Hispanic) and Education & Childcare (34%) but underrepresented in Nursing (21%).
Looking more closely at open-enrollment participants, they had a similar age distribution to contract training participants, but open-enrollment participants were more likely to be Hispanic and less likely to be White than contract training participants. Also, participation in some fields was comparatively more likely to be in the form of open enrollment—Nursing (86% open enrollment); Information Sciences, Communication, & Design (84%); and Allied Health (81%). Conversely, Engineering Technologies (57% open enrollment) and Protective Services (61%) had lower shares of open-enrollment participants.
Empirical Strategy
Estimating the labor market returns to noncredit education requires consideration of students’ enrollment patterns, earnings trends, and employment status changes. In the sections that follow, we first describe the features of enrollment, earnings, and employment that inform our empirical strategy. We then turn to explaining our preferred model for estimating earnings outcomes.
Enrollment Patterns
Several observations about students’ enrollment patterns inform our empirical strategy for estimating earnings outcomes. First, as shown in Table 2, noncredit students tend to enroll for short periods of time with low contact hour loads (referred to as hours for brevity). Students enrolled for an average of 1.6 quarters and attempted an average of 92 hours, which is equivalent to one semester-long, three-credit course (30 hours is approximately equal to one credit hour of credit instruction). About two-fifths of noncredit students (41%) attempted 30 or fewer hours within 5 years of entry, while about one-fifth of noncredit students (19%) attempted more than 150 hours.
Enrollment Intensity, Stability, and Patterns of Noncredit Students for Full Sample of Noncredit Students
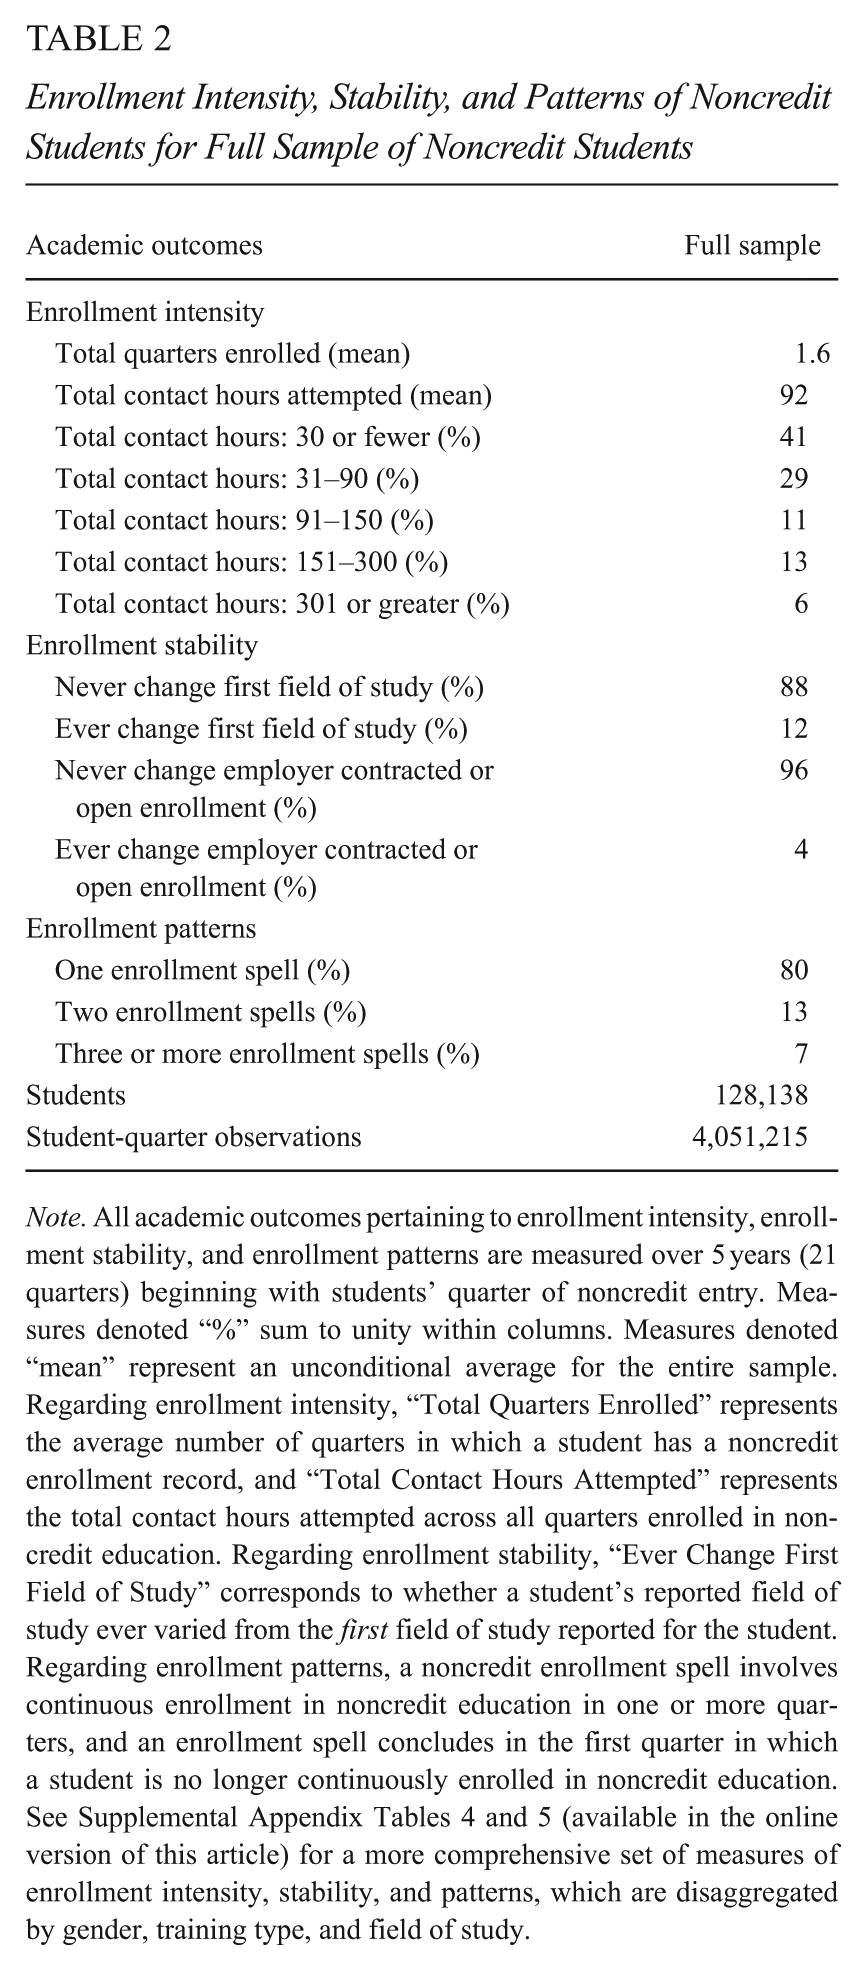
Note. All academic outcomes pertaining to enrollment intensity, enrollment stability, and enrollment patterns are measured over 5 years (21 quarters) beginning with students’ quarter of noncredit entry. Measures denoted “%” sum to unity within columns. Measures denoted “mean” represent an unconditional average for the entire sample. Regarding enrollment intensity, “Total Quarters Enrolled” represents the average number of quarters in which a student has a noncredit enrollment record, and “Total Contact Hours Attempted” represents the total contact hours attempted across all quarters enrolled in noncredit education. Regarding enrollment stability, “Ever Change First Field of Study” corresponds to whether a student’s reported field of study ever varied from the first field of study reported for the student. Regarding enrollment patterns, a noncredit enrollment spell involves continuous enrollment in noncredit education in one or more quarters, and an enrollment spell concludes in the first quarter in which a student is no longer continuously enrolled in noncredit education. See Supplemental Appendix Tables 4 and 5 (available in the online version of this article) for a more comprehensive set of measures of enrollment intensity, stability, and patterns, which are disaggregated by gender, training type, and field of study.
Supplemental Appendix Tables 4 and 5 and Supplemental Appendix Figure 1 (available in the online version of this article) reveal meaningful differences in enrollment intensity by gender, training type, and field of study. Men enrolled in a greater average number of hours than did women (102 hours vs. 79 hours), and open-enrollment students enrolled in a greater average number of hours than did contract training participants (102 hours vs. 65 hours). The average number of hours attempted varied substantially across fields of study. For instance, students participating in Construction and Protective Services attempted an average of 200 and 152 hours, respectively, whereas enrollees in Education & Childcare attempted 34 hours, on average.
Second, Table 2 shows that most noncredit students (80%) participated in one distinct enrollment spell. A spell refers to one or more consecutive quarters of noncredit enrollment preceded and followed by a period of non-enrollment. One in seven students (14%) took part in exactly two enrollment spells, and just 6% participated in three or more spells. In Supplemental Appendix Table 4 (available in the online version of this article), one can see that men were similar to women in the percentage enrolling in exactly one discrete enrollment spell (79% enrolled in exactly one spell vs. 81%). Likewise, open-enrollment participants were similar to contract training participants (81% enrolled in exactly one spell vs. 77%). In Supplemental Appendix Table 5 (available in the online version of this article), we show that Transportation enrollees were the most likely to participate in just one spell (90%). Conversely, less than two thirds of enrollees in Construction (61%) and Protective Services (64%) enrolled in just one spell. One-spell students attempted an average of 74 hours. Average hours in subsequent spells were lower: 57 hours in the second spell, and 50 hours in the third spell.
Third, students’ field of study and training type (open-enrollment vs. contract training) were relatively stable over time. As explained earlier, we did not have access to noncredit transcripts; instead, the data indicate each student’s predominant field of study and primary training type in each quarter. Across the full sample of noncredit students (n = 128,138), 88% of students took a majority of their noncredit contact hours in the same field of study in all enrolled quarters, and 96% of students took a majority of their contact hours in the same type of training in all enrolled quarters (Table 2). Less than one-third (32%) of all noncredit enrollees had enrollment records that spanned two or more quarters, either through a spell that was longer than a single quarter, multiple spells, or both. Among students whose enrollment records spanned two or more quarters (n = 40,833), 64% enrolled in exactly one field of study, and 87% enrolled in only one training type. Among the subset of students who enrolled in precisely one spell that spanned two or more quarters (n = 14,957), 73% enrolled in exactly one field of study, and 94% enrolled in only one training type. This high level of enrollment stability is largely attributable to findings we noted earlier: The modal student enrolls in noncredit education for one relatively brief spell.
Earnings and Employment Trends
Another consideration for our empirical strategy is the extent to which different groups of students have different trends in earnings and employment before and after noncredit enrollment. Panel A of Figure 1 displays average real quarterly earnings, conditional on employment (i.e., conditional on nonzero earnings) from 20 quarters before noncredit entry through 20 quarters after noncredit entry for the full sample of noncredit students. Panel B displays the results for subsamples of gender by training type. Earnings were inflation-adjusted to 2019 dollars (CPI-U) and top-coded at the 99th percentile, after which earnings of less than $100 were recoded to zero.
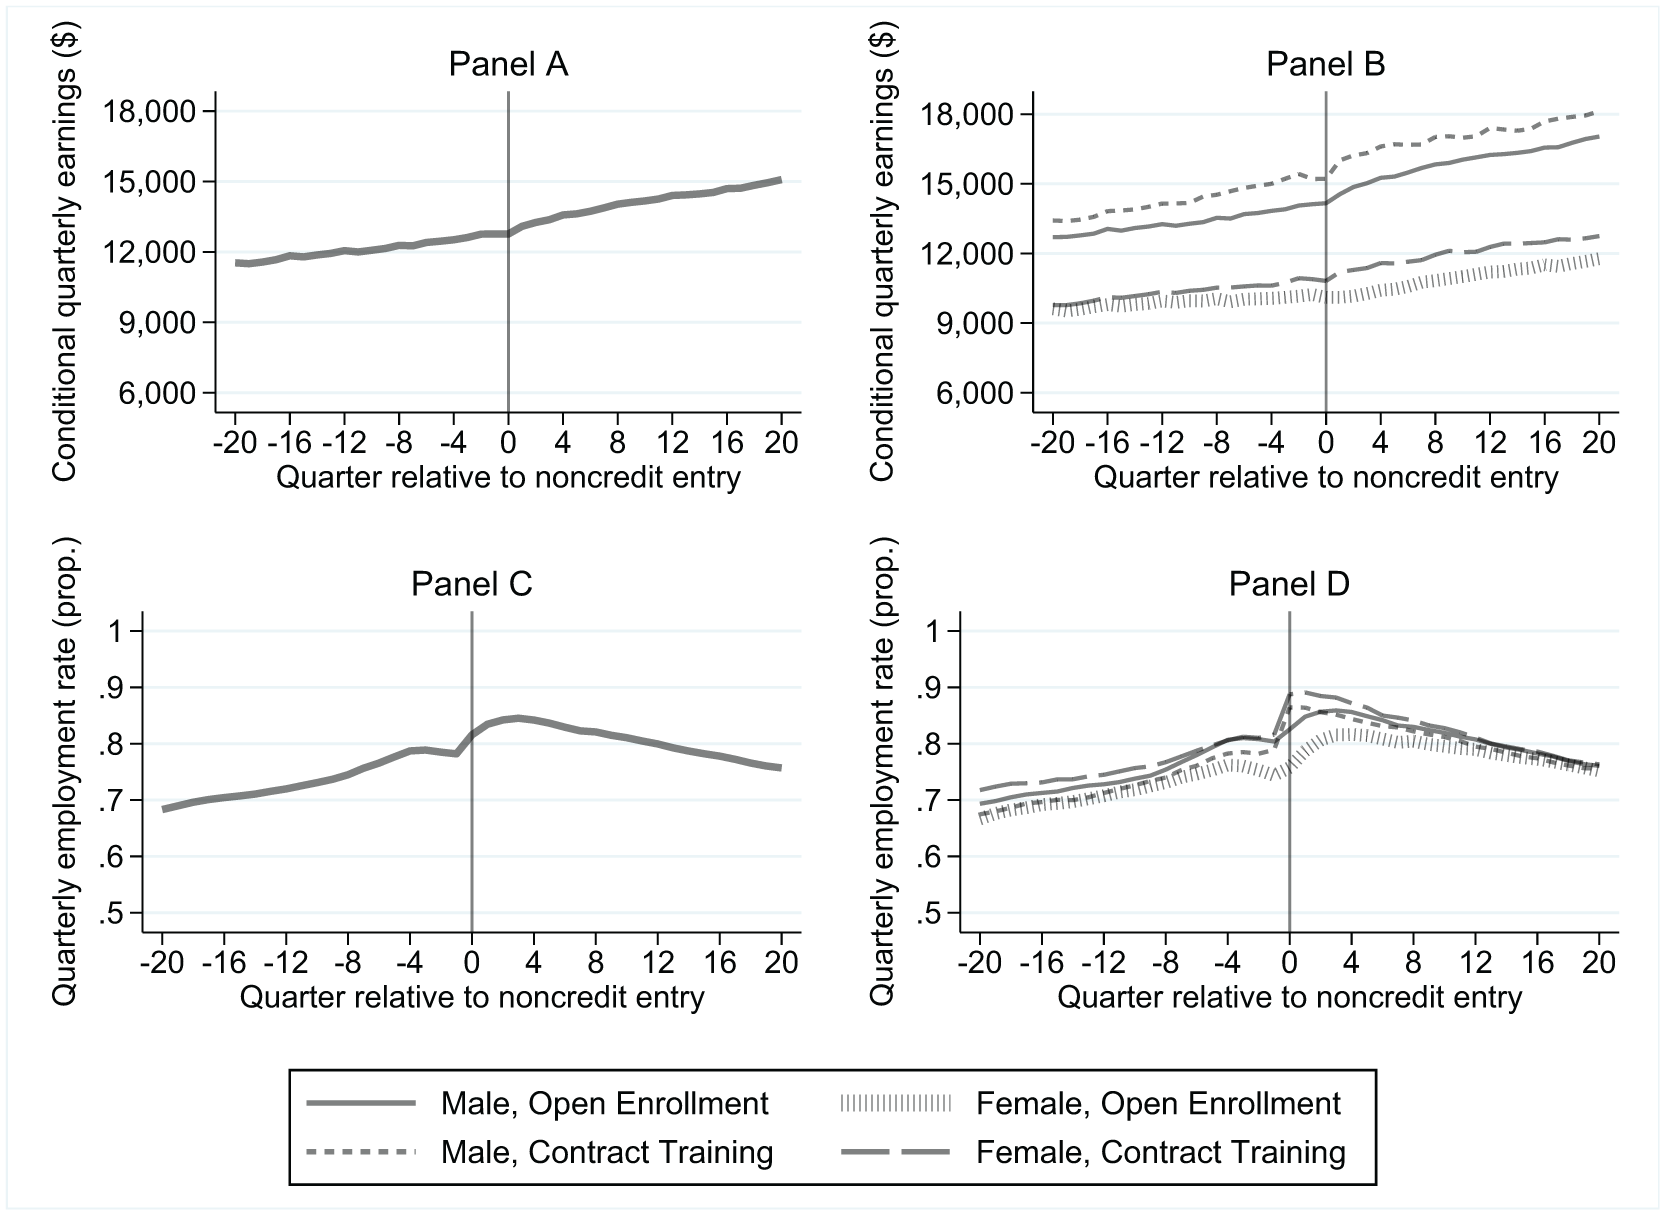
Average quarterly conditional earnings and employment relative to quarter of noncredit entry for full sample of noncredit students and disaggregated by combinations of gender and training type.
Panel A shows that average conditional earnings ranged from just under $12,000 per quarter 5 years prior to enrollment to approximately $15,000 per quarter 5 years after enrollment. Average earnings levels trend upward over time with an increase in the rate of growth around the time of noncredit entry. Panel B shows that average earnings levels are higher for men than for women and, in particular, highest for men who enrolled in contract training. As in Panel A, average earnings for all four groups increased over time and at a greater rate near the time of noncredit enrollment. However, contract training participants—men and women alike—experienced a noticeable dip in average earnings in the two to four quarters immediately prior to enrollment. Women who enrolled in open-enrollment training experienced a slight decline in average earnings approximately one quarter prior to noncredit enrollment.
Panels C and D of Figure 1 additionally display the average employment rates from 20 quarters before to 20 quarters after noncredit entry. The most noticeable trend across subgroups is a rapid rise in employment rate until about four quarters before noncredit enrollment, and then a plateau or decline. Panel C shows that the employment rate begins to rise again in the quarter of noncredit enrollment. Panel D shows that contract training participants—both men and women—experience a pronounced spike in employment rate in the quarter of noncredit enrollment, which then declines over time. Open-enrollment participants of both genders experience a more gradual increase in employment rate beginning with the quarter of noncredit enrollment, which peaks roughly four quarters after enrollment and declines thereafter. Earnings and employment trends disaggregated by field of study, contact hour load, and number of enrollment spells are provided in Supplemental Appendix Figures 2 through 7 (available in the online version of this article).
Changes in Employment Status and Industry of Employment
Informed by our observations regarding employment trends, a final consideration for our empirical strategy is how enrollment in noncredit occupational training is related to changes in employment status and industry. Observers have noted that noncredit occupational training commonly assists students in upgrading or retooling their skills when switching occupations or industries (Van Noy & Hughes, 2022; Voorhees & Milam, 2005). To explore this proposition, Figure 2 displays four metrics, all measured from 19 quarters before noncredit entry to 20 quarters after noncredit entry: (a) whether students’ employment status changed from being employed in the prior quarter to being unemployed in the current quarter (thin-barred line); (b) whether students’ employment status changed from being unemployed in the prior quarter to being employed in the current quarter (dotted line); (c) whether students’ industry of employment changed from the prior quarter to the current quarter (conditional on being employed in each quarter; long-dashed line); and (d) whether students experienced any type of change in employment status or industry of employment (solid line).
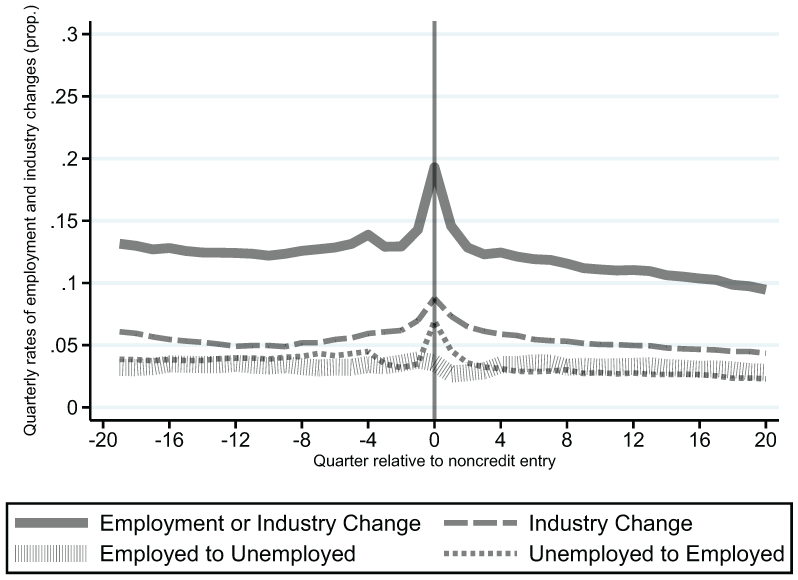
Average quarterly rates of changes in employment status and industry of employment for full sample of noncredit students.
In agreement with Figure 1, Figure 2 shows that quarterly changes in employment or industry status (solid line) crescendo at the time of noncredit entry. The topline trend is driven predominantly by changes in status from unemployed to employed (dotted line) and changes in industry of employment (long-dashed line). In contrast, quarterly changes from employed to unemployed (thin-barred line) remain relatively stable over time. More concretely, in the year preceding noncredit entry, 36% of students experienced a change in their employment status or industry of employment, and 20% of students experienced a change in their industry specifically.
Changes in industry and changes in employment state disaggregated by gender and training type, field of study, contact hour load, and number of enrollment spells are provided in Supplemental Appendix Figures 8 through 11 (available in the online version of this article). Changes in industry and changes from unemployed to employed are especially pronounced among contract training participants (Supplemental Appendix Figure 9 in the online version of the article) and among students entering some fields of study, such as Transportation and Construction (Supplemental Appendix Figure 8 in the online version of the article). 5
Collectively, these trends indicate that selection into employment and changes in industry of employment regularly precede or coincide with enrollment in noncredit education. The finding points to a possible departure from the existing literature on the returns to (credit-bearing) community college education (Belfield & Bailey, 2017b; Carruthers & Jepsen, 2021; Lovenheim & Smith, 2022) and government-sponsored job training (Ashenfelter, 1978; McCall et al., 2016), which indicates wage reductions or job separations frequently precipitate enrollment for adult learners. Here, the trends in employment and industry changes align more closely with how contract training is deployed: employers contracting with community colleges to train new hires and incumbent workers (Dougherty & Bakia, 2000). The nature of contract training likely is not the sole explanation, however. Open-enrollment occupational training students—comprising nearly three fourths (72%) of our sample (Table 1)—also exhibit this trend albeit to a lesser degree. A potential consequence of this finding is that contemporaneous changes in employment status and industry of employment may be partially driving any observed relationship between earnings and participation in noncredit occupational training. We investigate this matter further in supplementary analyses, and it is an important topic for future research on the economic returns to noncredit occupational training and, more generally, subbaccalaureate education.
Preferred Model Specification
We use an individual fixed effects model to estimate the labor market returns to occupational noncredit education. This approach compares students’ earnings in the time periods following noncredit enrollment with those from the time periods prior to enrollment, after adjusting for the influence of age, time, temporary economic shocks, and time-constant unobservable characteristics. The fundamental assumption of this approach is that, had students not participated in noncredit education, their earnings trends after enrollment would have followed the same trajectory as their earnings trends prior to enrollment. The assumption may be violated in the event that there are unobserved, time-varying shocks that jointly affect students’ educational decisions and earnings outcomes (Belfield & Bailey, 2017b). However, one recent analysis of community college nursing programs in California found that earnings estimates derived from individual fixed effects models compared favorably to those from models exploiting random variation from admissions lotteries (Grosz, 2020).
Equation 1 depicts our preferred empirical model:

where
Other terms in Equation 1 account for time-varying factors that may influence noncredit participants’ average earnings.
The preferred model also incorporates several types of fixed effects.
Our earlier analyses of student characteristics, enrollment patterns, and earnings and employment trends demonstrated that students differentially sort into noncredit fields of study by gender (Supplemental Appendix Table 2 in the online version of the article) and that open-enrollment occupational training is more prevalent in some fields than others (Supplemental Appendix Table 3 in the online version of the article). We also noted differences in employment and earnings trends between men and women in open-enrollment training and contract training (Figure 1), pointing to different selection processes into noncredit for these groups.
Informed by these findings, we first estimate models for the full sample of noncredit students and then disaggregate by students’ field of study at noncredit entry. We additionally estimate separate models by gender and training type (open-enrollment or contract training), each disaggregated by field as well.
Next, we estimate models for five subsamples based on contact hours accumulated by students, which allows us to assess whether there is heterogeneity in returns by educational duration. Note that we did not specify terms for cumulative contact hours in our preferred model, deviating from some of the prior research on the returns to community college (Bahr, 2019; Jacobson et al., 2005; Hodara & Xu, 2016; Schudde & Shea, 2022). Students’ decisions to attempt larger or smaller contact hour loads may be informed by their anticipated earnings gains (Callaway et al., 2021). For instance, some students who attempted comparatively few hours may have anticipated that they could not realize additional gains from taking additional noncredit coursework due to their industry of employment or other reasons.
We also estimate models in which we adjust the constructions of
Results
Full Sample
Estimates for the full sample in Table 3, Column 1, indicate that, on average, noncredit occupational training is associated with a statistically significant $540 (2019 dollars) long-run increase in quarterly earnings conditional on employment. The observed coefficient on the reciprocal time trend of −$294 indicates that students’ average earnings are positive but less than $540 in the quarters immediately after completing their first enrollment spell. Over time, average earnings are predicted to increase toward $540 per quarter. Putting these two coefficients together, individuals who participate in noncredit occupational training are predicted to earn an average of about $2,000 more per year by 2 years after training, which represents robust earnings growth considering that the average training duration is just over 90 hours (see Table 2).
Regression of Conditional Earnings on Noncredit Attendance and Other Controls for the Full Sample of Noncredit Students and Disaggregated by Field of Study
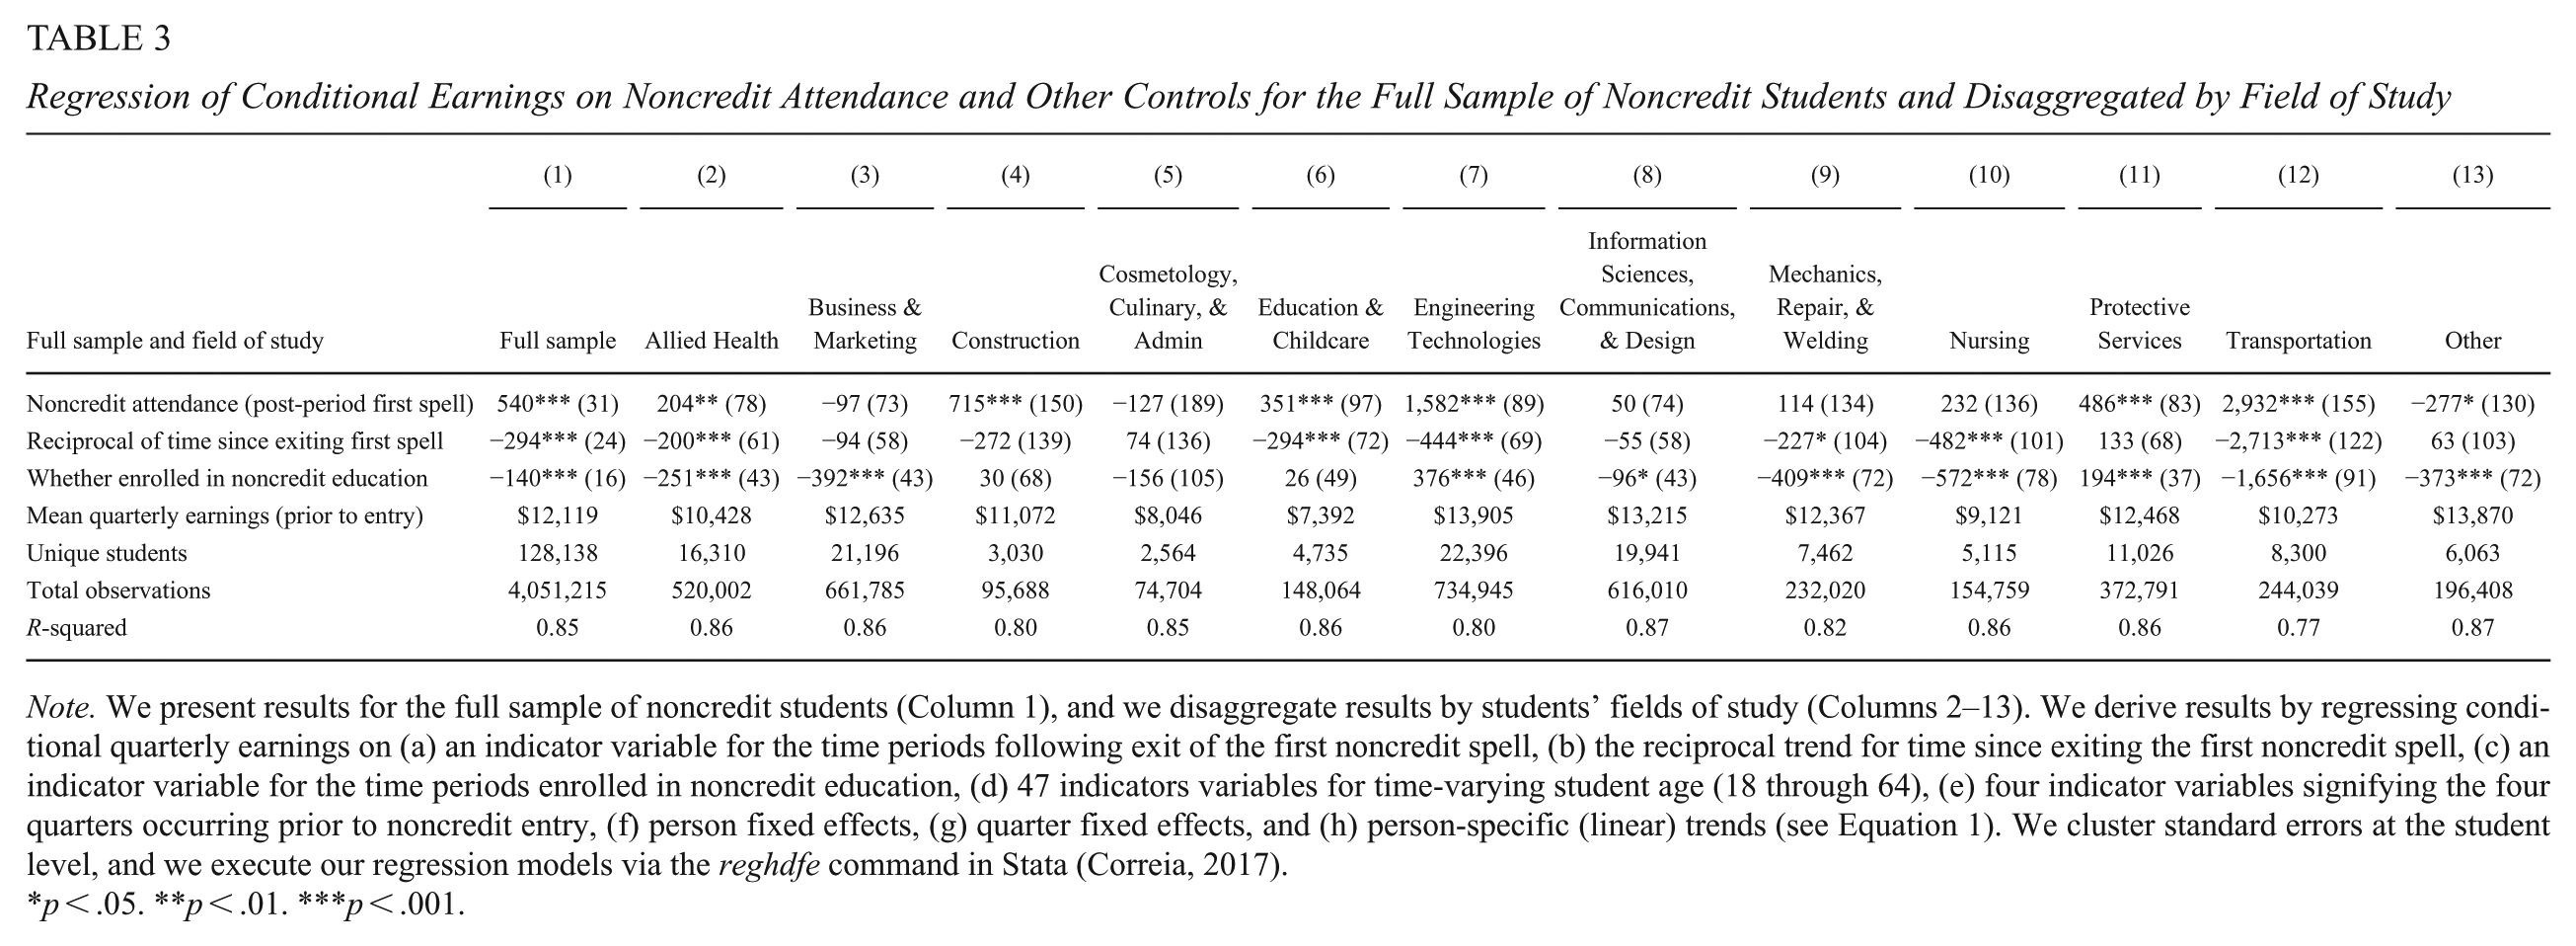
Note. We present results for the full sample of noncredit students (Column 1), and we disaggregate results by students’ fields of study (Columns 2–13). We derive results by regressing conditional quarterly earnings on (a) an indicator variable for the time periods following exit of the first noncredit spell, (b) the reciprocal trend for time since exiting the first noncredit spell, (c) an indicator variable for the time periods enrolled in noncredit education, (d) 47 indicators variables for time-varying student age (18 through 64), (e) four indicator variables signifying the four quarters occurring prior to noncredit entry, (f) person fixed effects, (g) quarter fixed effects, and (h) person-specific (linear) trends (see Equation 1). We cluster standard errors at the student level, and we execute our regression models via the reghdfe command in Stata (Correia, 2017).
p < .05. **p < .01. ***p < .001.
Field of Study
Table 3, Columns 2–13, shows that the returns to occupational noncredit education vary substantially by field of study. For ease of comparison across fields, Figure 3 visually portrays the coefficients for the long-run relationships between noncredit training and earnings from Table 3. Estimates for Transportation and Engineering Technologies indicate high, long-run increases in average quarterly earnings—$2,932 and $1,582, respectively. For context, nearly three-quarters (74%) of students in Transportation participated in commercial vehicle operation training. Engineering Technologies students were spread across several subfields, with almost two-thirds accounted for by occupational safety and health technology (42%), petroleum technology (13%), and manufacturing engineering technology (10%). 7 Occupational safety and health technology and commercial vehicle operation were the two most common noncredit programs across all noncredit students in our sample, regardless of field of study (7% and 5% of all noncredit students, respectively).
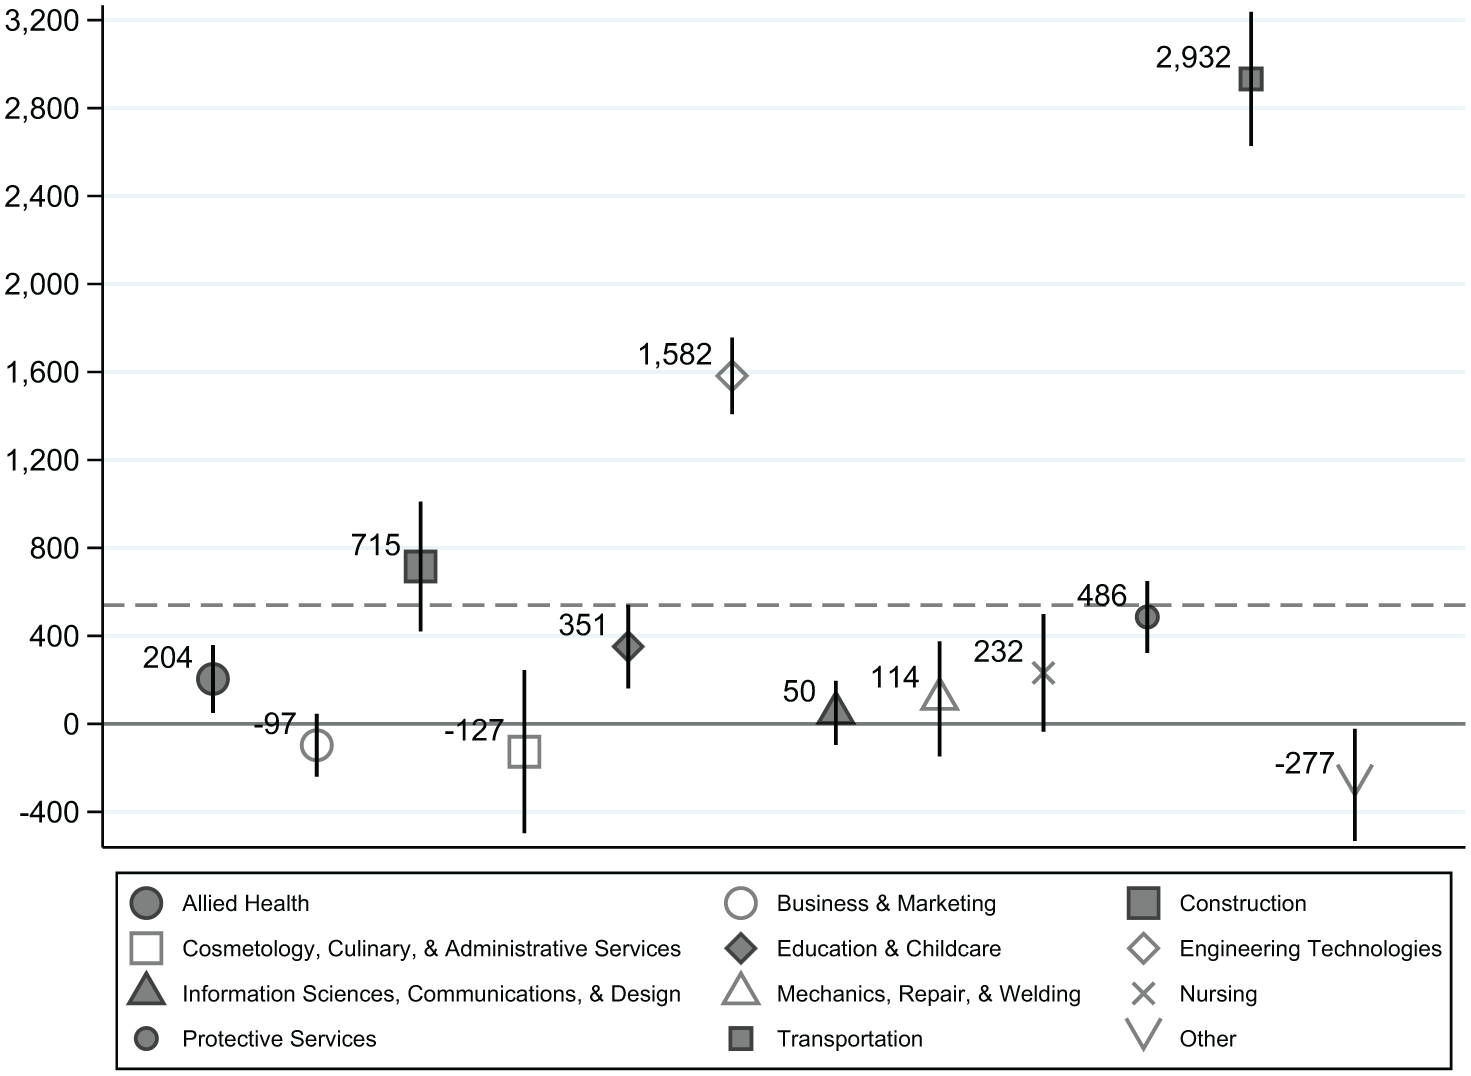
Long-run returns to noncredit attendance by field of study.
Regarding the other fields of study, Construction ($715), Protective Services ($486), Education & Childcare ($351), and Allied Health ($204) all are associated with smaller long-run gains, closer in magnitude to the average returns for the full sample. 8 In contrast, the estimated gains in five fields—Business & Marketing; Cosmetology, Culinary, & Administrative Services; Information Sciences, Communication, & Design; Mechanics, Repair, & Welding; and Nursing—are statistically indistinguishable from zero in the full sample, though the results for Cosmetology, Culinary, & Administrative Services should be interpreted with caution because some of these fields of study are associated with occupations that have high rates of self-employment, and earnings from self-employment are not accounted for in UI wage data. 9
Type of Training and Gender
Table 4 reveals that men realize stronger long-run gains from noncredit occupational training ($852 per quarter) than do women ($124), and contract training participants are estimated to out-earn their counterparts who participated in open-enrollment occupational training ($633 vs. $516). Earnings gains for men do not differ substantively by type of training; their estimated average increase in contract training is $827 as compared with $895 in open-enrollment occupational training. In contrast, while women in contract training are estimated to realize a $369 increase in average earnings, earnings gains for women in open-enrollment occupational training average near zero.
Regression of Conditional Earnings on Noncredit Attendance and Other Controls Disaggregated by Gender, Training Type, and Combinations of Gender and Training Type
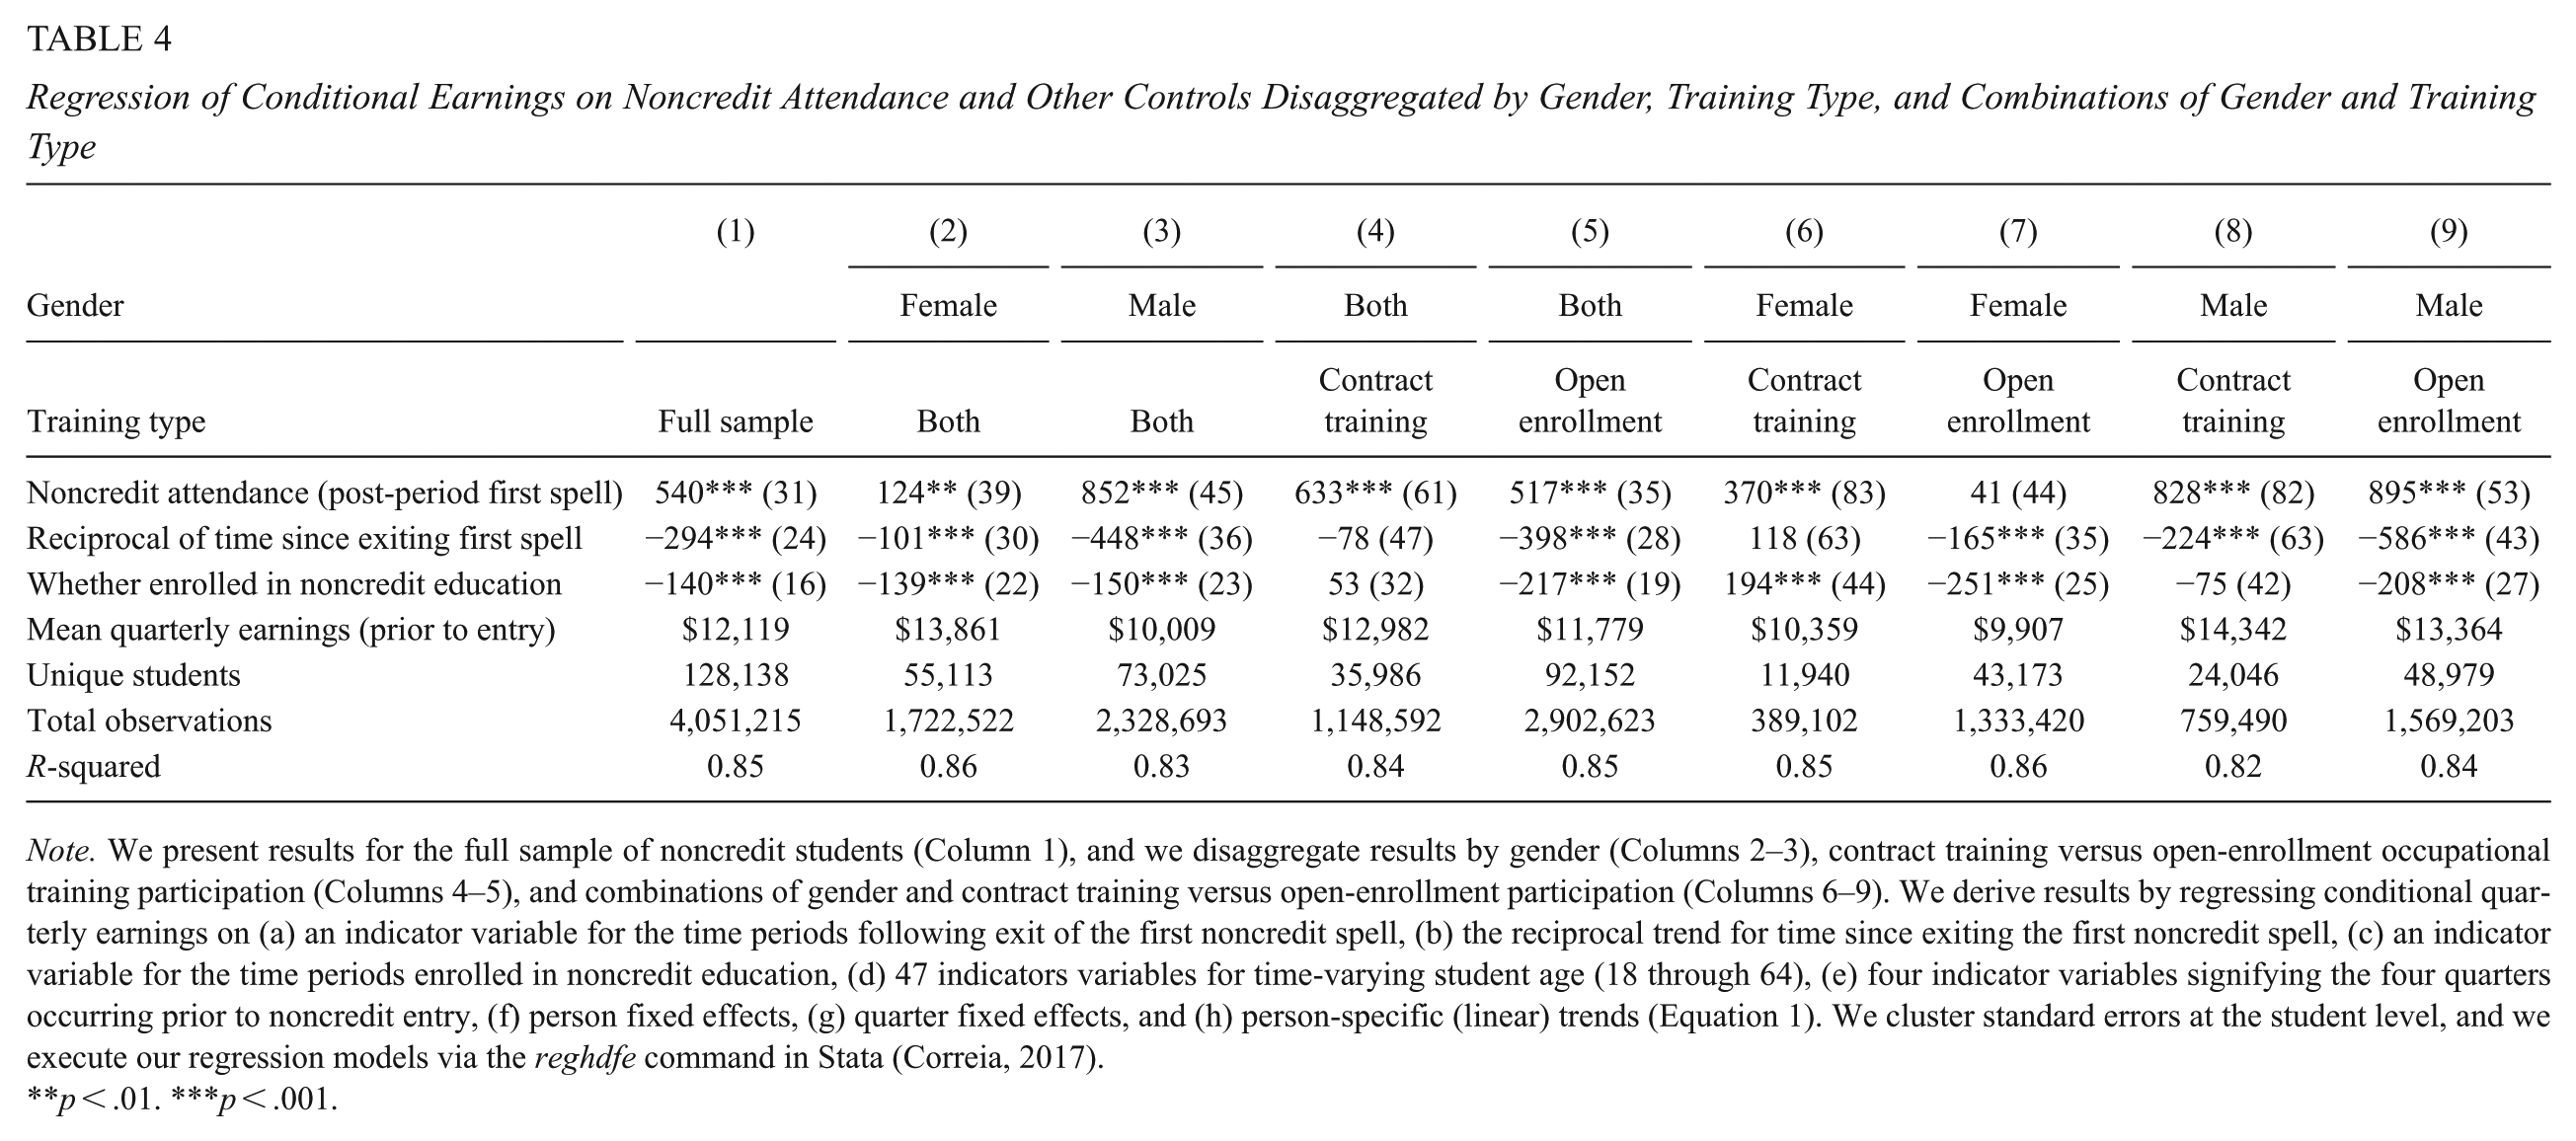
Note. We present results for the full sample of noncredit students (Column 1), and we disaggregate results by gender (Columns 2–3), contract training versus open-enrollment occupational training participation (Columns 4–5), and combinations of gender and contract training versus open-enrollment participation (Columns 6–9). We derive results by regressing conditional quarterly earnings on (a) an indicator variable for the time periods following exit of the first noncredit spell, (b) the reciprocal trend for time since exiting the first noncredit spell, (c) an indicator variable for the time periods enrolled in noncredit education, (d) 47 indicators variables for time-varying student age (18 through 64), (e) four indicator variables signifying the four quarters occurring prior to noncredit entry, (f) person fixed effects, (g) quarter fixed effects, and (h) person-specific (linear) trends (Equation 1). We cluster standard errors at the student level, and we execute our regression models via the reghdfe command in Stata (Correia, 2017).
p < .01. ***p < .001.
As expected, men and women in open-enrollment training experienced a statistically significant decline in their earnings during quarters in which they were enrolled, but their counterparts in contract training did not. In fact, women in contract training experience a statistically significant increase in their average earnings during quarters in which they are enrolled.
Figure 4 displays estimated long-run returns disaggregated by field of study, type of training, and gender. Several findings stand out. Transportation and Engineering Technologies were the fields with the highest average gains for the full sample (Table 3), with point estimates of $2,932 and $1,582 per quarter, respectively. When estimates are disaggregated by type of training and gender, returns to these fields are still strong compared to other fields with the one exception of women in Transportation contract training, where earnings do not differ significantly from zero. Point estimates of earnings gains for Transportation are $1,563 for men in contract training, but a sizeable $3,699 and $2,899 for men and women in open-enrollment occupational training, respectively. Earnings gains for men and women in Engineering Technologies contract training are roughly similar at $1,389 and $1,070, respectively. A larger difference in gains is observed between men and women in open-enrollment Engineering Technologies, with estimates of $1,934 and $516, respectively.
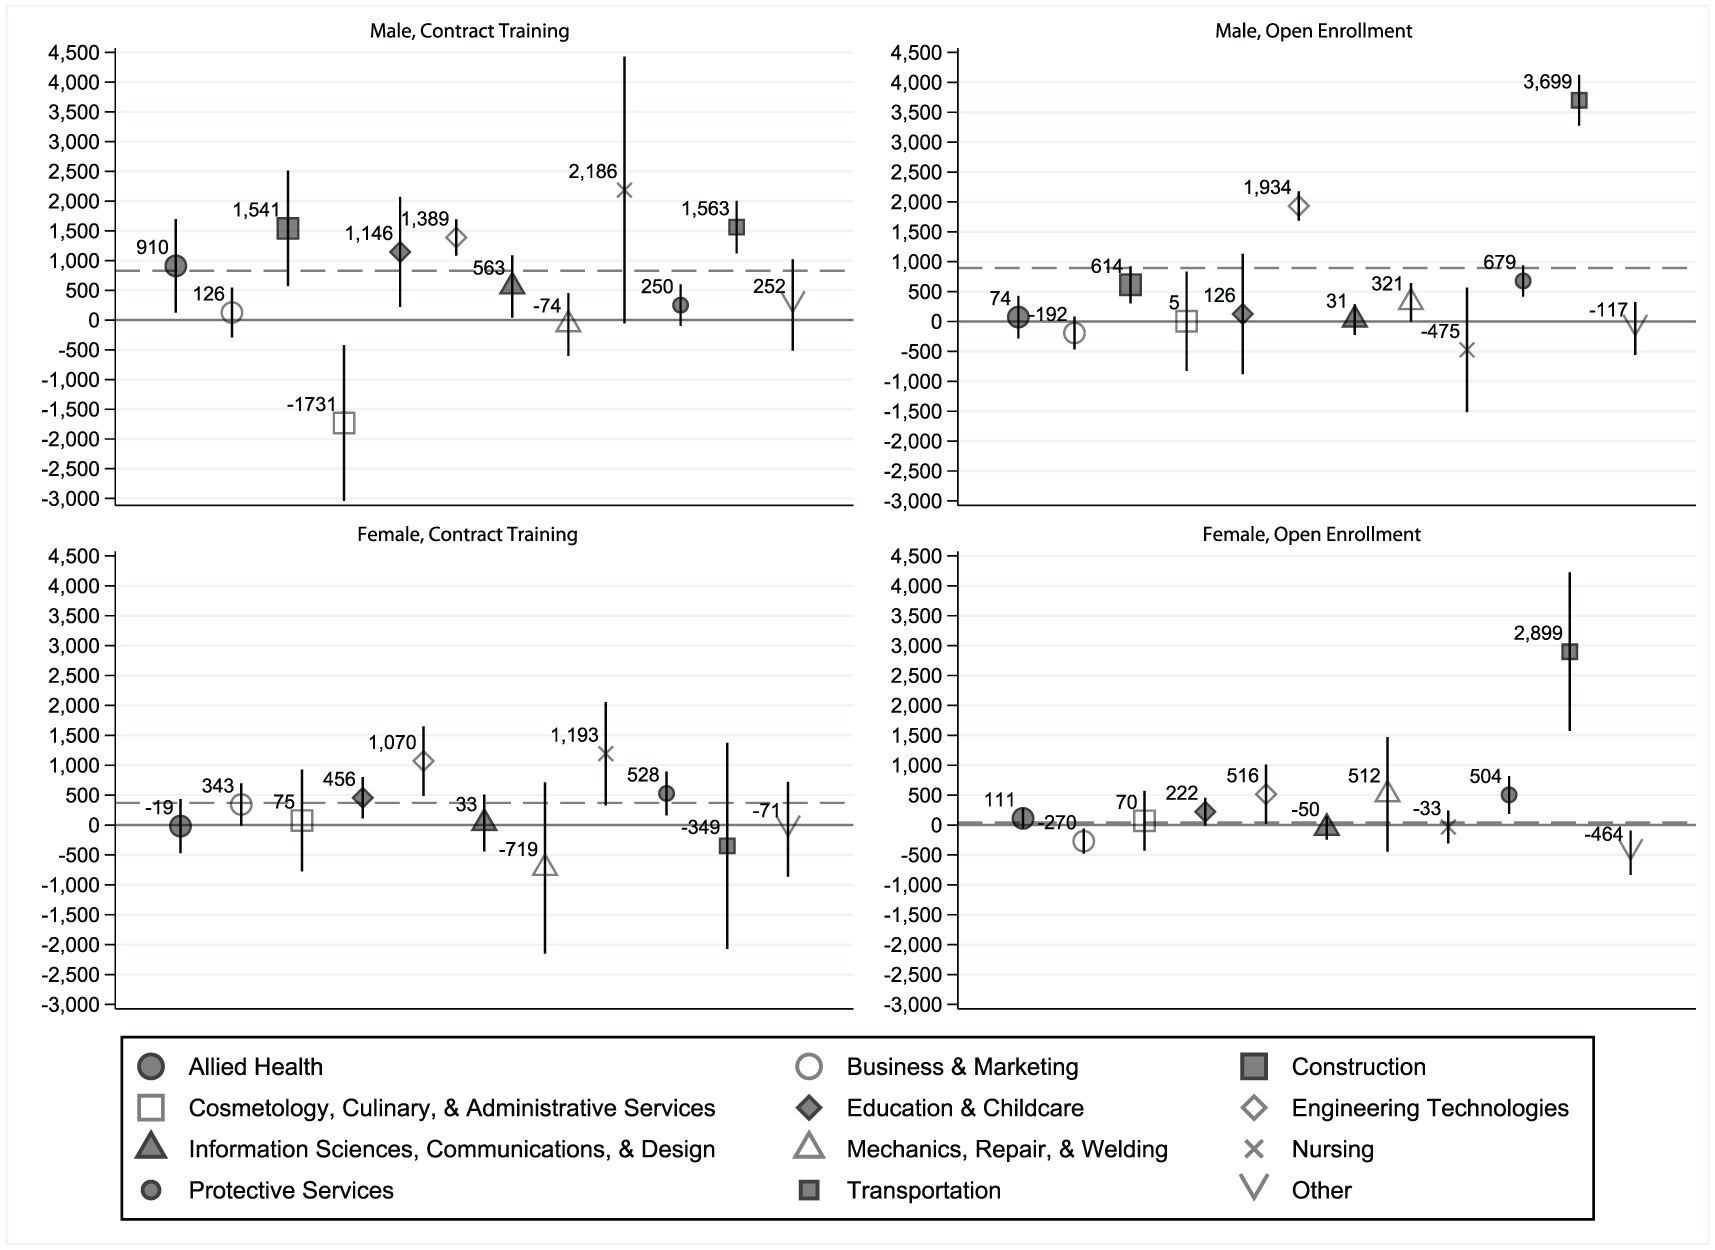
Long-run returns to noncredit attendance by field of study and disaggregated by combinations of gender and contract training participation.
Table 3 showed that, for the whole sample, Construction ($715), Protective Services ($486), Education & Childcare ($351), and Allied Health ($204) all have positive and statistically significant returns that hover near the sample mean. When disaggregated by gender and training type, estimated gains for Construction remain positive and significant for men in both training types ($1,541 for contract training; $614 for open-enrollment occupational training), but there were too few women in Construction to estimate returns with precision. Gains for Protective Services remain positive and significant for all but men in contract training; women in contract training have estimated gains of $528, while men and women in open-enrollment training have estimated gains of $679 and $504, respectively. Gains for Education & Childcare remain positive and significant for both men ($1,146) and women ($456) in contract training, but not open-enrollment training. Gains for Allied Health are positive and significant only for men in contract training ($910). In contrast, gains for Nursing are strong, positive, and significant for women in contract training ($1,193) but are statistically insignificant for the full sample (Table 3).
Contact Hour Loads
Returns to noncredit education tend to be greater for students who participated in longer durations of instruction (Table 5), which is consistent with prior evidence on the returns to education in general and the returns to community college attendance and completion in particular (Bahr, 2019; Becker, 1994; Belfield & Bailey, 2017a; Card, 1999; Jacobson et al., 2005). However, the three fields of study associated with the highest average contact hour loads—Transportation, Pro-tective Services, and Construction (Supplemental Appendix Table 5 in the online version of the article)—are also among the fields with the highest estimated earnings gains (alongside Engineering Technologies; see Table 3), implicating field of study as a possible confound in the positive relationship between instructional duration and earnings gains (Table 5).
Regression of Conditional Earnings on Noncredit Attendance Disaggregated by Cumulative Contact Hours Attempted
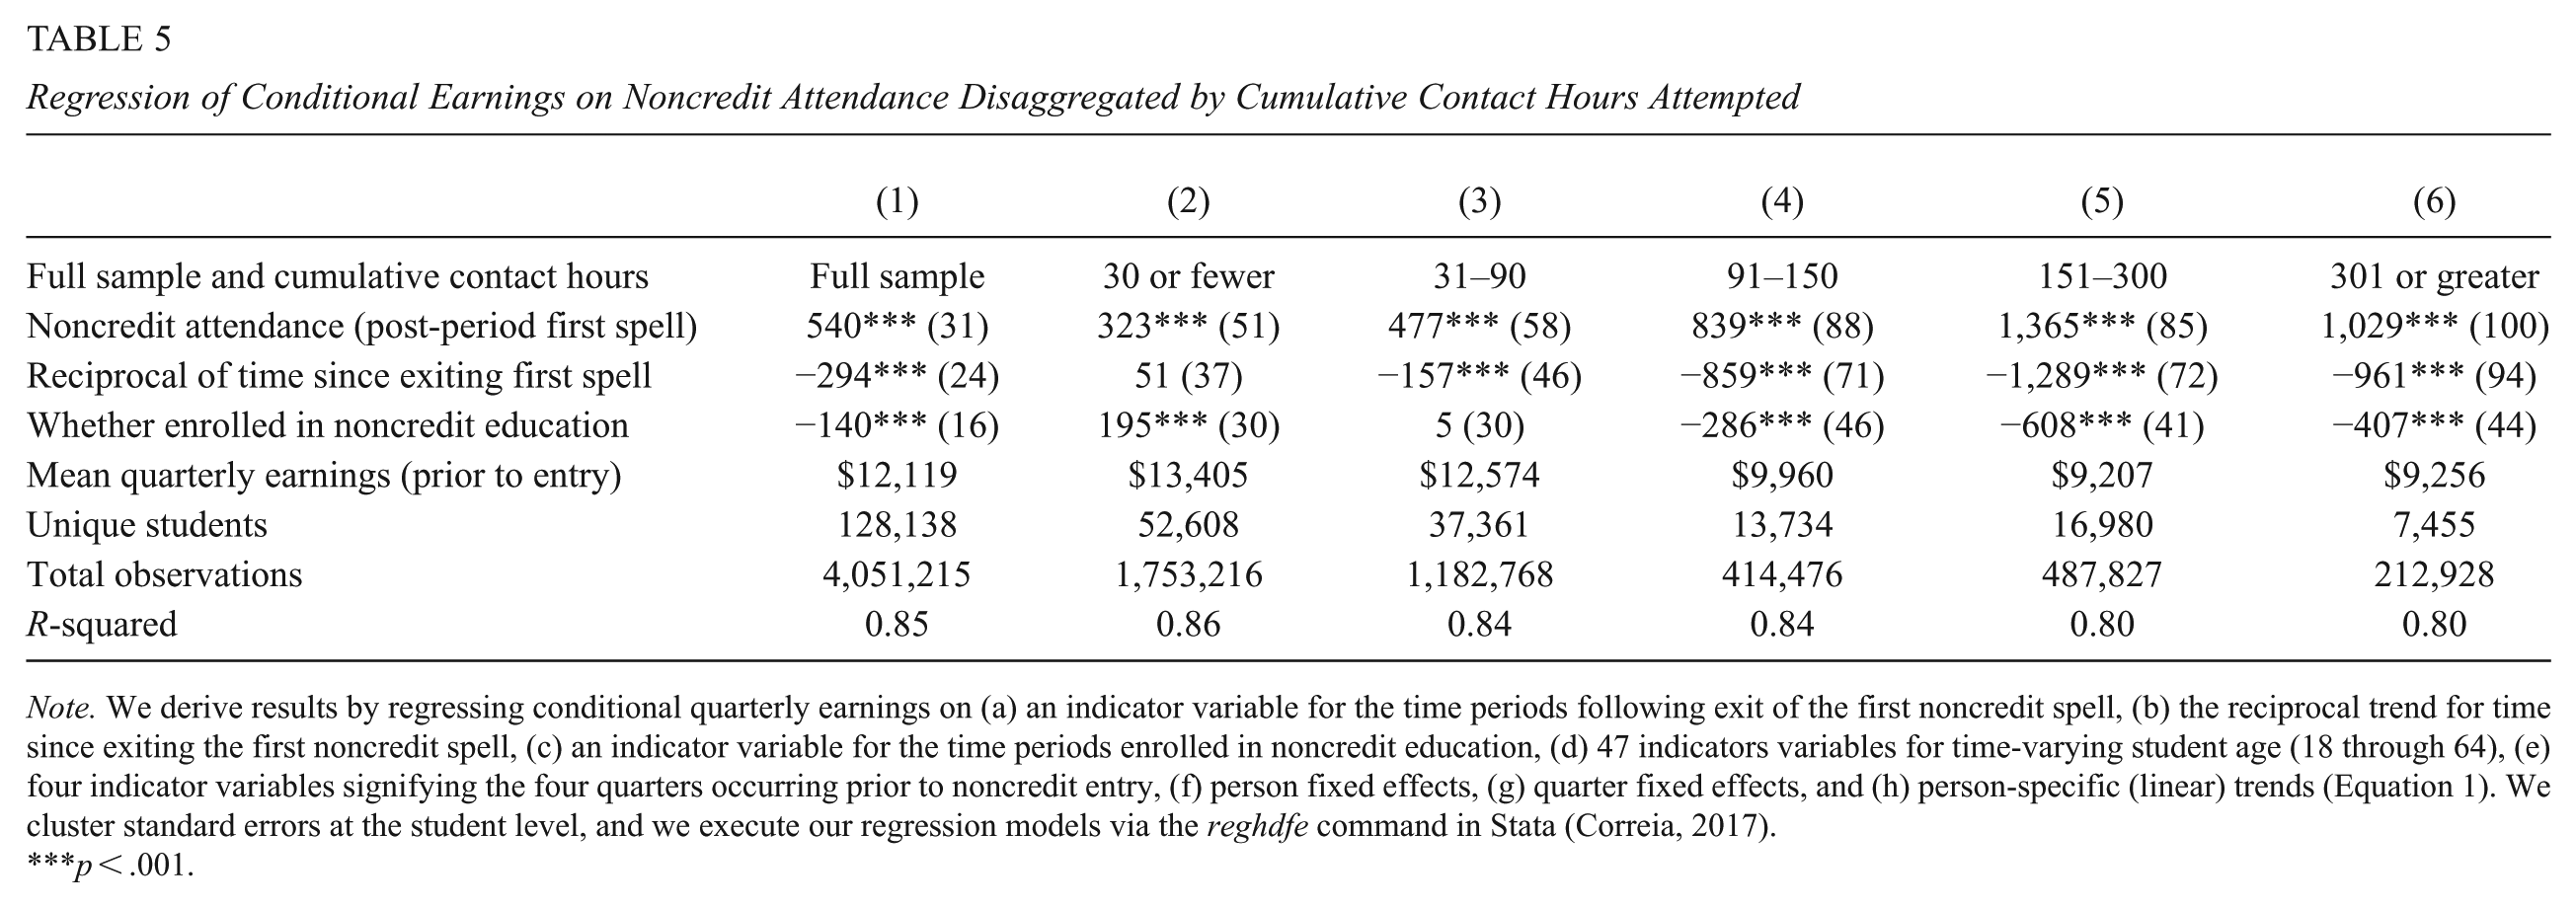
Note. We derive results by regressing conditional quarterly earnings on (a) an indicator variable for the time periods following exit of the first noncredit spell, (b) the reciprocal trend for time since exiting the first noncredit spell, (c) an indicator variable for the time periods enrolled in noncredit education, (d) 47 indicators variables for time-varying student age (18 through 64), (e) four indicator variables signifying the four quarters occurring prior to noncredit entry, (f) person fixed effects, (g) quarter fixed effects, and (h) person-specific (linear) trends (Equation 1). We cluster standard errors at the student level, and we execute our regression models via the reghdfe command in Stata (Correia, 2017).
pp < .001.
To investigate this possibility, we estimated the returns to instructional duration, disaggregating by field of study (Figure 5). For students who attempted 30 or fewer hours, earnings gains in most fields are statistically indistinguishable from zero, but gains for students in Construction ($1,383), Engineering Technologies ($1,468), and Transportation ($1,099) remain significant and strong. In addition, Transportation and Engineering Technologies are the fields with the greatest earnings gains for students who attempted 31 to 90, 91 to 150, and 151 to 300 hours.
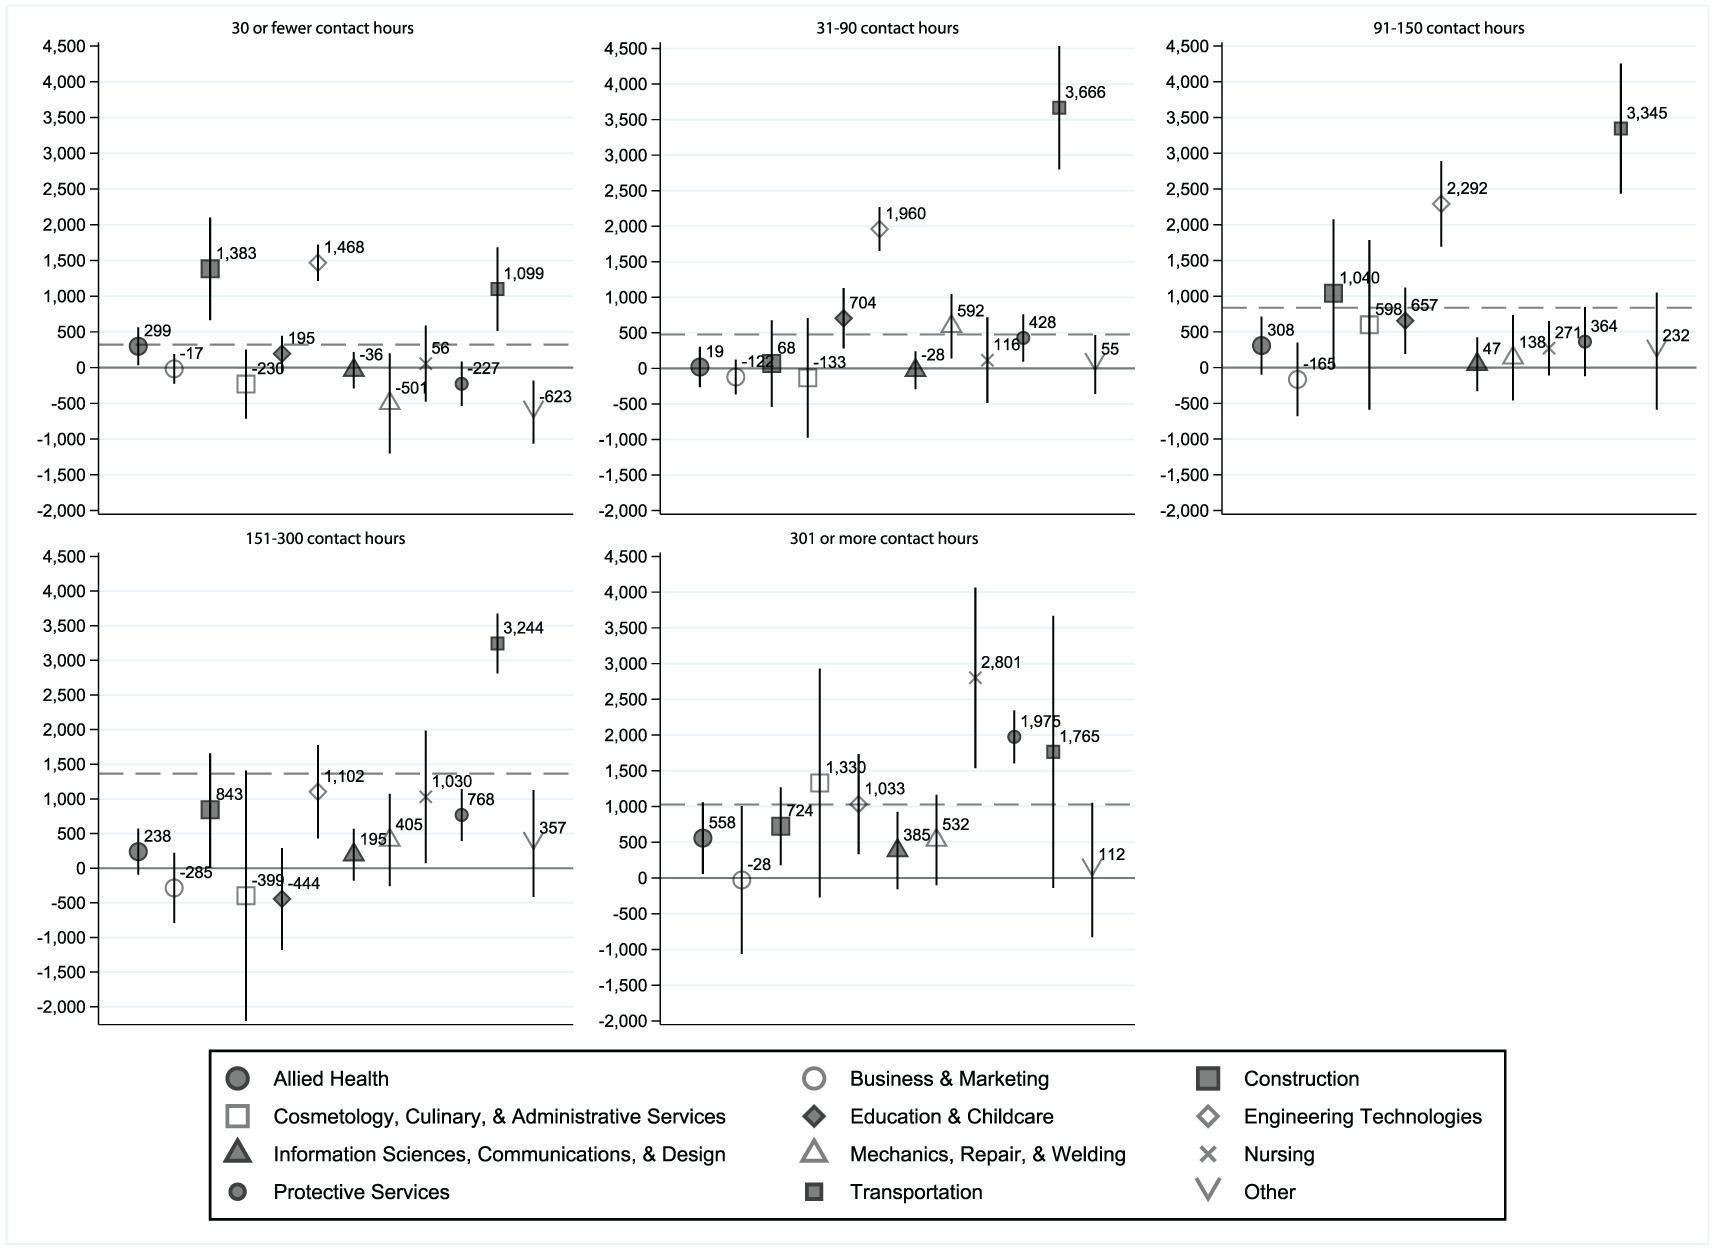
Long-run returns to noncredit attendance by field of study and disaggregated by contact hours attempted.
Among students who attempted more than 300 hours, who account for 6% of the overall sample, the three fields with the highest gains are Nursing ($2,801), Protective Services ($1,975), and Engineering Technologies ($1,033). Notably, in the full sample, wage gains for students in Nursing programs did not differ significant from zero, yet Nursing is also the field with the strongest returns for female, contract training participants. Also of note, returns to Protective Services programs of fewer than 150 hours are modest and sometimes statistically indistinguishable from zero.
For the full sample, returns to Education & Childcare and Allied Health were positive and significant but low. Figure 5 reveals that the returns to Education & Childcare are driven primarily by relatively stronger returns at the 31 to 90 hour and the 91 to 150 hour training levels ($704 and $657, respectively). Just 4% of students in Education & Childcare attempted more than 150 hours, and too few attempted training exceeding 300 hours to estimate returns at that level with any confidence. Conversely, returns to Allied Health programs are highest at 300 or more hours of training ($558), and returns at 31 to 90 hours, 91 to 150 hours, and 151 to 300 hours training in Allied Health are not statistically distinguishable from zero.
In addition to Nursing, four other fields had returns that were statistically insignificant for the full sample—Business & Marketing; Cosmetology, Culinary, & Administrative Services; Information Sciences, Communication, & Design; and Mechanics, Repair, & Welding. When disaggregated by contanct hours, returns to all of these fields remain statistically insignificant except Mechanics, Repairs, & Welding at the 31 to 90 hour training level ($592).
Overall, the disaggregation of estimated returns by field of study and training duration reveals a more complex picture than might be anticipated. Returns to some fields of study are stronger at longer training durations (e.g., Nursing, Protective Services), as expected. However, returns to other fields are stronger at mid-length training durations (e.g., Transporation, Engineering Technologies, and Education & Childcare), and returns to still other fields are stronger at lower training durations (e.g., Construction). It seems likely that the inconsistencies across fields of study in the relationship between training duration and wage gains is a result of qualitative differences in the content of the training. For instance, Engineering Technologies programs that are roughly 30 to 150 hours (corresponding to the 31 to 90 hour and the 91 to 150 hour training durations in this study, which is where the highest wage gains are observed) may be teaching fundamentally different subject matter than those that are more than 150 hours in length. Further investigation of this matter is warranted in future research.
Multiple Enrollment Spells
Our preferred model estimates returns to noncredit attendance in the time period after the conclusion of students’ first enrollment spell, but one-fifth (20%) of our sample participated in multiple spells (Table 2). To examine the returns to multiple enrollment spells, we added to our preferred model separate terms for students’ first, second, and third enrollment spells. The results presented in Table 6 indicate that the first spell is associated with an average increase of $537 in quarterly earnings, which is very similar to the results of our preferred specification that considered only the first spell (Table 3). The second spell is associated with an additional average increase of $86 in quarterly earnings. The third spell is associated with temporary earnings gains in the quarters immediately following attendance, as indicated by the statistically significant reciprocal time trend estimate of $247, but these gains decline toward zero over time.
Regression of Conditional Earnings on Noncredit Attendance in First, Second, and Third Enrollment Spells
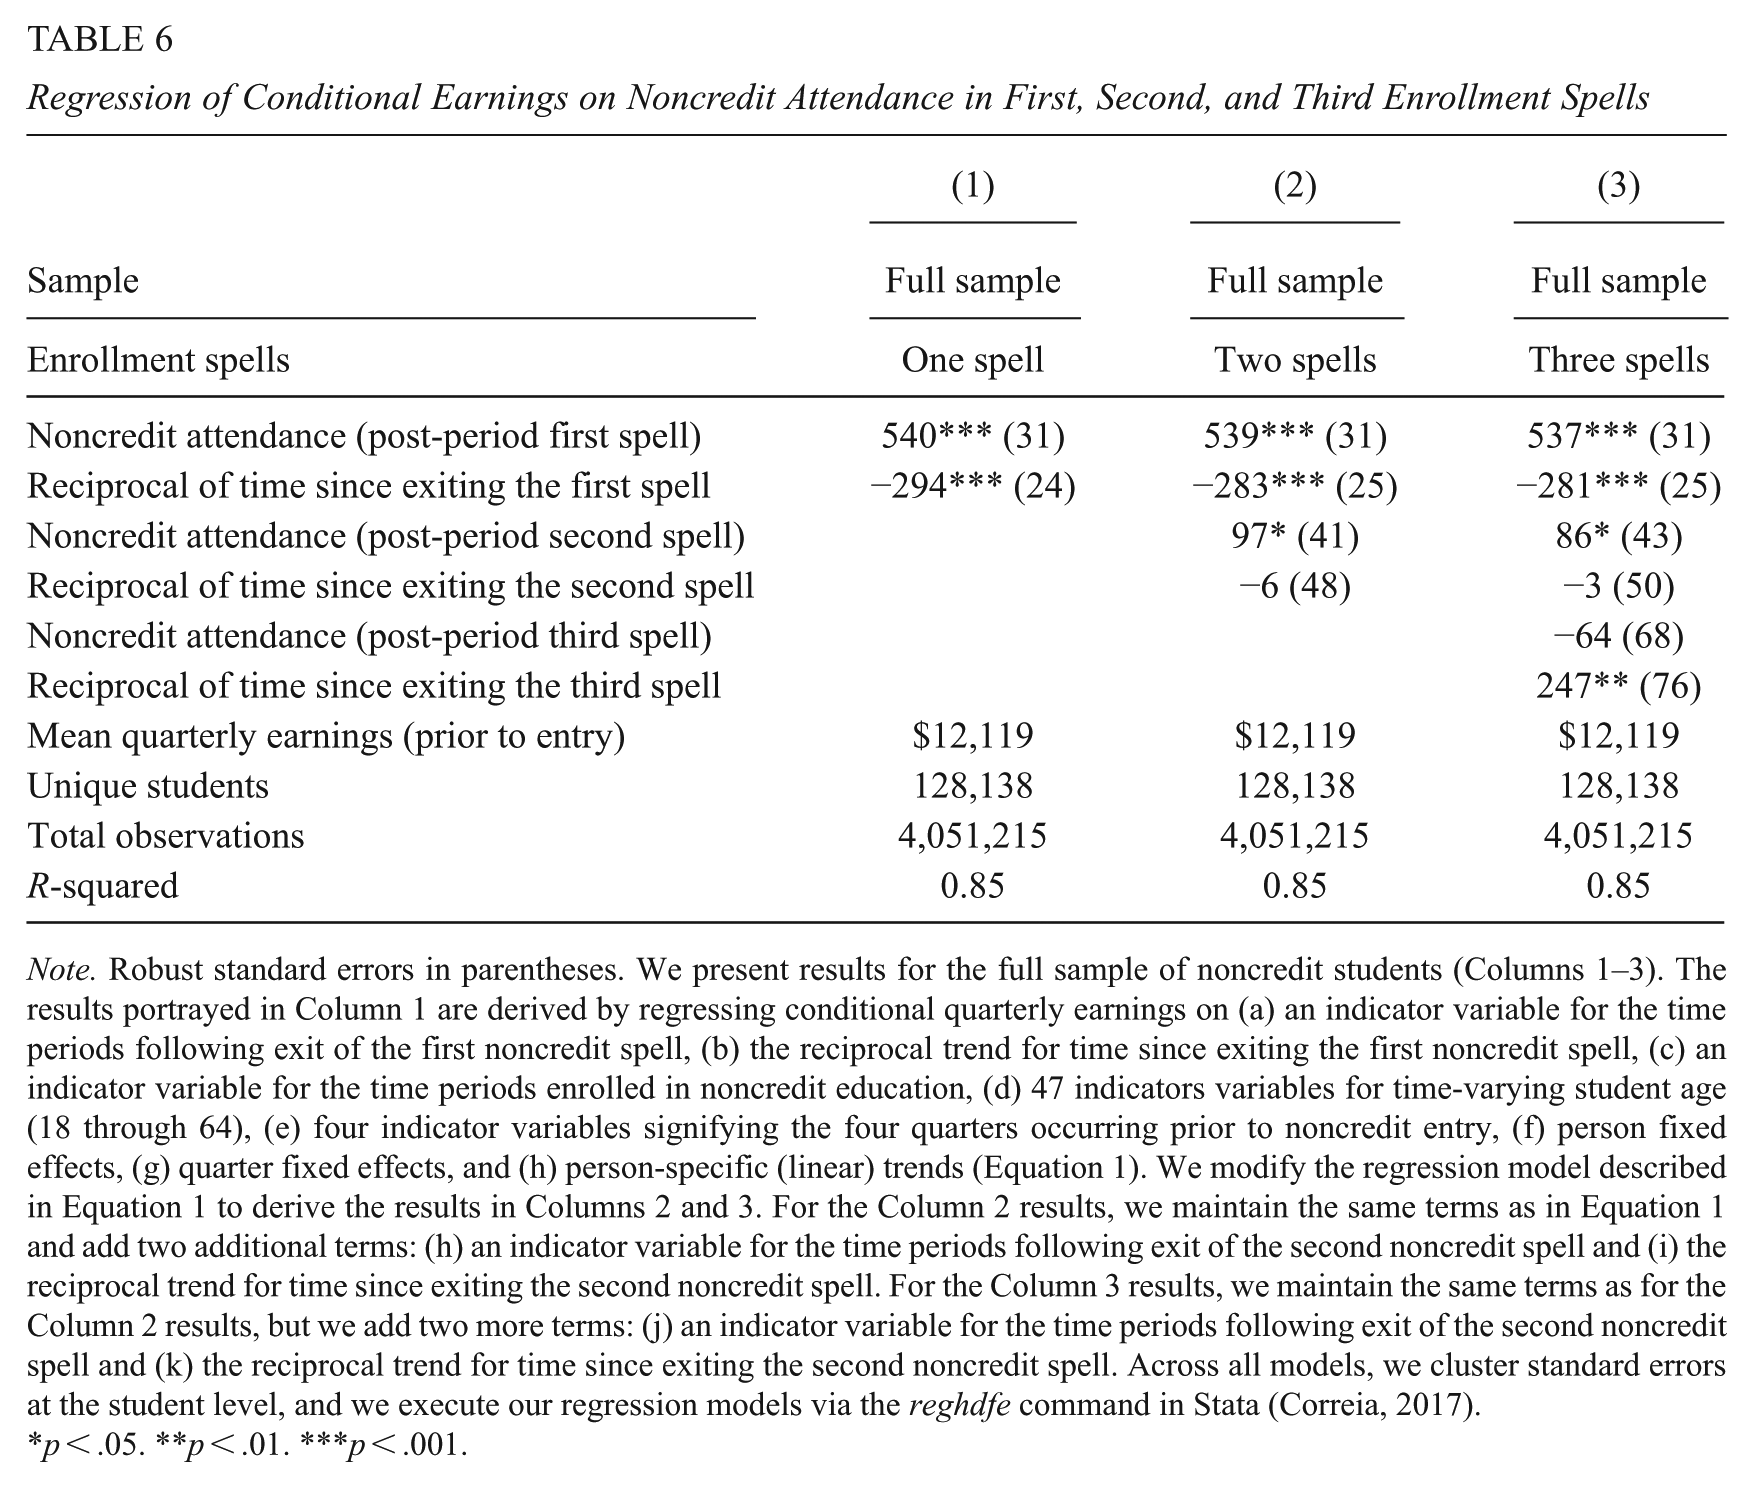
Note. Robust standard errors in parentheses. We present results for the full sample of noncredit students (Columns 1–3). The results portrayed in Column 1 are derived by regressing conditional quarterly earnings on (a) an indicator variable for the time periods following exit of the first noncredit spell, (b) the reciprocal trend for time since exiting the first noncredit spell, (c) an indicator variable for the time periods enrolled in noncredit education, (d) 47 indicators variables for time-varying student age (18 through 64), (e) four indicator variables signifying the four quarters occurring prior to noncredit entry, (f) person fixed effects, (g) quarter fixed effects, and (h) person-specific (linear) trends (Equation 1). We modify the regression model described in Equation 1 to derive the results in Columns 2 and 3. For the Column 2 results, we maintain the same terms as in Equation 1 and add two additional terms: (h) an indicator variable for the time periods following exit of the second noncredit spell and (i) the reciprocal trend for time since exiting the second noncredit spell. For the Column 3 results, we maintain the same terms as for the Column 2 results, but we add two more terms: (j) an indicator variable for the time periods following exit of the second noncredit spell and (k) the reciprocal trend for time since exiting the second noncredit spell. Across all models, we cluster standard errors at the student level, and we execute our regression models via the reghdfe command in Stata (Correia, 2017).
p < .05. **p < .01. ***p < .001.
When interpreting these findings, it is important to note that students’ decisions to enroll in a second or third spell of noncredit education may be influenced by the outcomes that they experienced from earlier spells. For instance, students who do not realize earnings gains from earlier spells may choose to re-enroll. Alternatively, some types of noncredit education that entail multiple spells, such as continuing education for periodic re-certification or re-licensure, are not intended to increase earnings. Little or no wage increases would be expected in these cases because the programs are designed to help workers maintain the certifications or licensures that are required to keep their jobs. We also note that students with multiple enrollment spells are unevenly distributed across fields of study (Supplemental Appendix Table 5 in the online version of the article). For instance, about two-fifths (39%) of students in Construction enrolled in two or more spells of training, as did about one-third (36%) of students in Protective Services. In the full sample, just one-fifth of students (20%) enrolled in more than one spell of training. 10
Supplementary Analyses
We performed a host of supplementary analyses to test our preferred empirical strategy. Specifically, we estimated alternative earnings and employment outcomes, investigated the influence of changes in employment status and industry of employment on our main estimates, and explored the sensitivity of our results to alternative model specifications and sample inclusion criteria. Overall, results of the supplementary analyses affirm our general finding of a positive and significant relationship between noncredit attendance and earnings outcomes.
Alternative Outcomes
First, our primary outcome of interest is quarterly earnings conditional on employment, but prior research has examined additional outcomes when evaluating the returns to community college education, such as logged earnings conditional on employment, employment status, and quarterly earnings unconditional on employment (Belfield & Bailey, 2017b). In Table 7, we present estimates for these three outcomes alongside our primary outcome. We use the model specified in Equation 1.
Selected Results of the Regression of Conditional Earnings, Logged Earnings, Unconditional Earnings, and Employment on Noncredit Attendance and Other Controls for the Full Sample of Noncredit Students
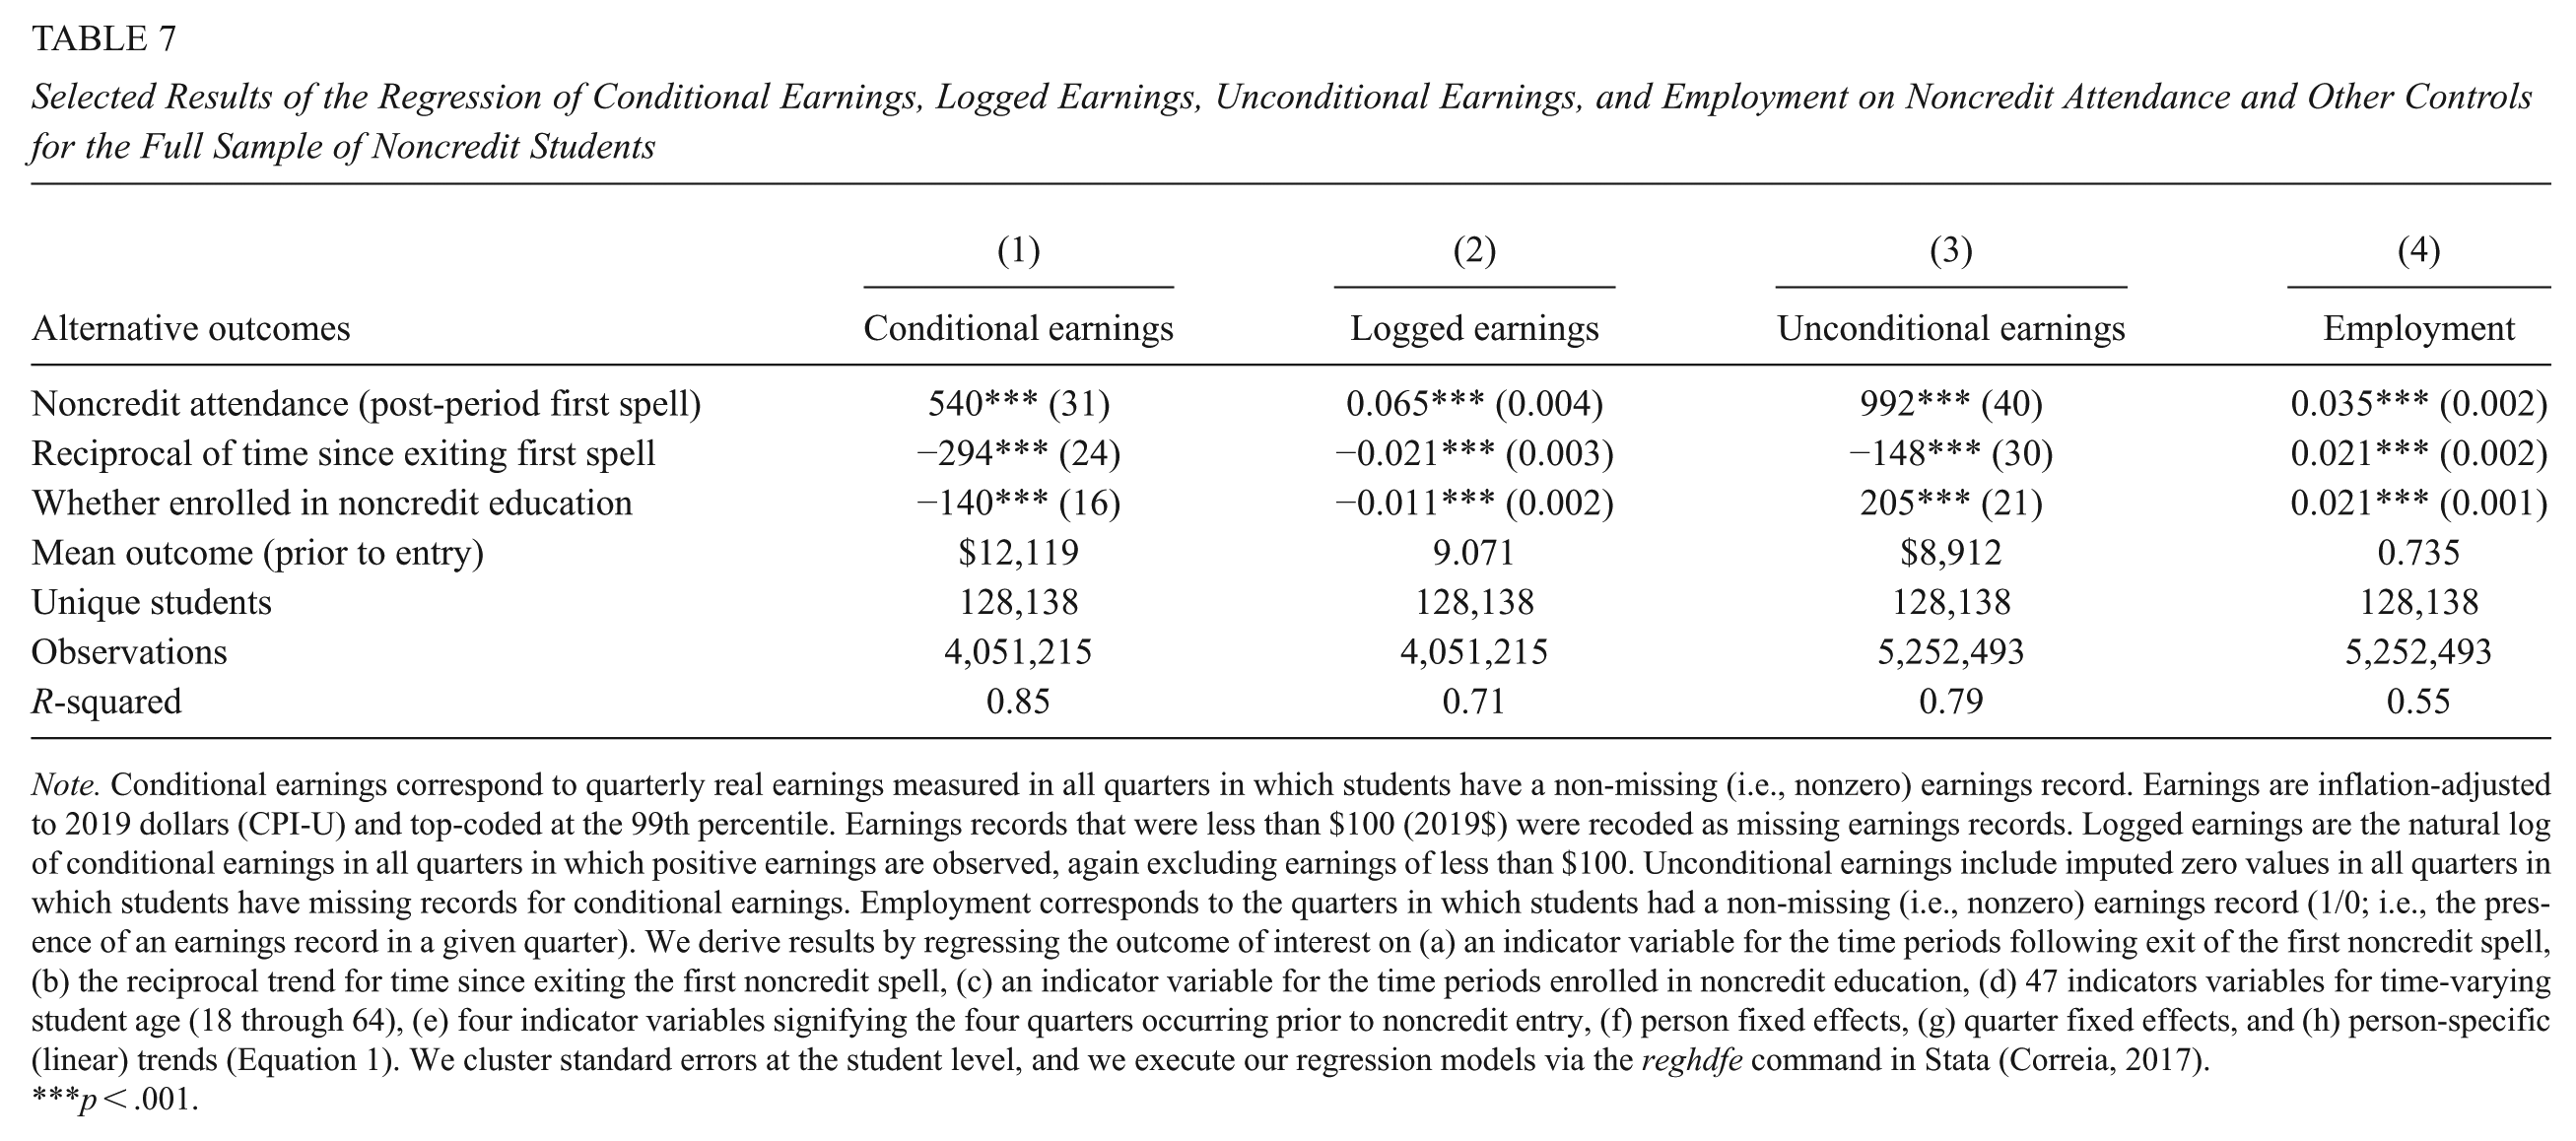
Note. Conditional earnings correspond to quarterly real earnings measured in all quarters in which students have a non-missing (i.e., nonzero) earnings record. Earnings are inflation-adjusted to 2019 dollars (CPI-U) and top-coded at the 99th percentile. Earnings records that were less than $100 (2019$) were recoded as missing earnings records. Logged earnings are the natural log of conditional earnings in all quarters in which positive earnings are observed, again excluding earnings of less than $100. Unconditional earnings include imputed zero values in all quarters in which students have missing records for conditional earnings. Employment corresponds to the quarters in which students had a non-missing (i.e., nonzero) earnings record (1/0; i.e., the presence of an earnings record in a given quarter). We derive results by regressing the outcome of interest on (a) an indicator variable for the time periods following exit of the first noncredit spell, (b) the reciprocal trend for time since exiting the first noncredit spell, (c) an indicator variable for the time periods enrolled in noncredit education, (d) 47 indicators variables for time-varying student age (18 through 64), (e) four indicator variables signifying the four quarters occurring prior to noncredit entry, (f) person fixed effects, (g) quarter fixed effects, and (h) person-specific (linear) trends (Equation 1). We cluster standard errors at the student level, and we execute our regression models via the reghdfe command in Stata (Correia, 2017).
p < .001.
The estimates indicate noncredit occupational training is associated with a 6.5% increase in conditional earnings over the long run (Column 2), a $992 long-run gain in unconditional quarterly earnings (Column 3), a 5.6 percentage point increase in the likelihood of employment immediately after training (Column 4), and a 3.5 percentage point increase in the long-run likelihood of employment (Column 4). The increased likelihood of employment helps to explain the larger point estimate for unconditional earnings ($992) as compared with conditional earnings ($540). Of note, the positive and statistically significant estimates of the relationships between being enrolled in noncredit education in a given quarter and students’ unconditional earnings (Model 3) and likelihood of being employed (Model 4) affirm our earlier observation that selection into employment regularly precedes or coincides with enrollment in noncredit education (Figures 1 and 2).
Unobserved Heterogeneity
Second, we examined four alternative approaches to account for unobserved heterogeneity in our preferred model. The core assumption of our empirical approach is that noncredit students’ earnings trends after enrolling would have followed the same paths as observed before enrolling had they not enrolled. Following Dynarski et al. (2018), Jacobson et al. (2005), and others (e.g., Belfield & Bailey, 2017b), our preferred specification incorporates person fixed effects, quarter fixed effects, and person-specific linear trends. However, researchers have employed several alternative specifications (Belfield & Bailey, 2017b; Minaya & Scott-Clayton, 2022), which we examine to compare the estimates with our preferred model. These alternative specifications, for which we provide estimates in Supplemental Appendix Table 6 (available in the online version of this article), include models with person fixed effects only (Model 1; $999); person and quarter fixed effects only (Model 2; $708); person fixed effects, quarter fixed effects, and with linear trends for various demographic groups (Model 3; $696); and person fixed effects, quarter fixed effects, and person-specific quadratic trends (Model 6; $578). In comparison with these alternative specifications, our preferred model (Model 1 in Table 3; Model 4 in Supplemental Appendix Table 6 in the online version of the article) returns the most conservative point estimate ($540) for the long-run relationship between noncredit attendance and earnings.
Changes in Employment Status and Industry of Employment
Third, we investigated the extent to which changes in student employment status or industry of employment influenced our estimates. As noted above, 36% of our sample experienced a change in their employment status in the year preceding noncredit entry, and 20% of students specifically changed industries in the same time frame. In turn, the earnings gains that we attribute to participation in noncredit training, presumably by way of improvements to trainees’ skills (Becker, 1994), may be somewhat or fully attributable to other mechanisms involving the contemporaneous changes in employment circumstances.
We first tested a model in which we added industry fixed effects to our preferred model (Supplemental Appendix Table 6, Model 5 in the online version of the article). The magnitude of the estimated long-run earnings gain following noncredit education is 14% smaller ($462) than we observed in our preferred model ($540), but the estimate remains positive and statistically significant. Similarly, when disaggregated by field of study (Supplemental Appendix Figure 12 in the online version of the article), gains are somewhat lower for nearly all fields as compared with the disaggregation of our preferred model (Figure 3), but the direction and statistical significance of the gains are unchanged.
We addressed the issue more directly in Table 8 by implementing additional models in which we subset the full sample into two groups: students who did not experience any change in employment status or industry in the four quarters preceding noncredit entry (n = 81,922; Column 2) and students who did (n = 46,216; Column 3). Notably, the average long-run earnings gains for the students with stable employment patterns prior to noncredit entry are positive and statistically significant, yet noticeably smaller in magnitude ($206; Column 2) than the point estimate for the full sample from the preferred model ($540; Column 1). On the other hand, students who experienced some type of employment change have much larger estimated gains ($1,218; Column 3) than that of the full sample.
Selected Results of the Regression of Conditional Earnings on Noncredit Attendance Disaggregated by Whether Students Had Any Change in Employment Status or Industry of Employment in the Year Preceding Noncredit Entry
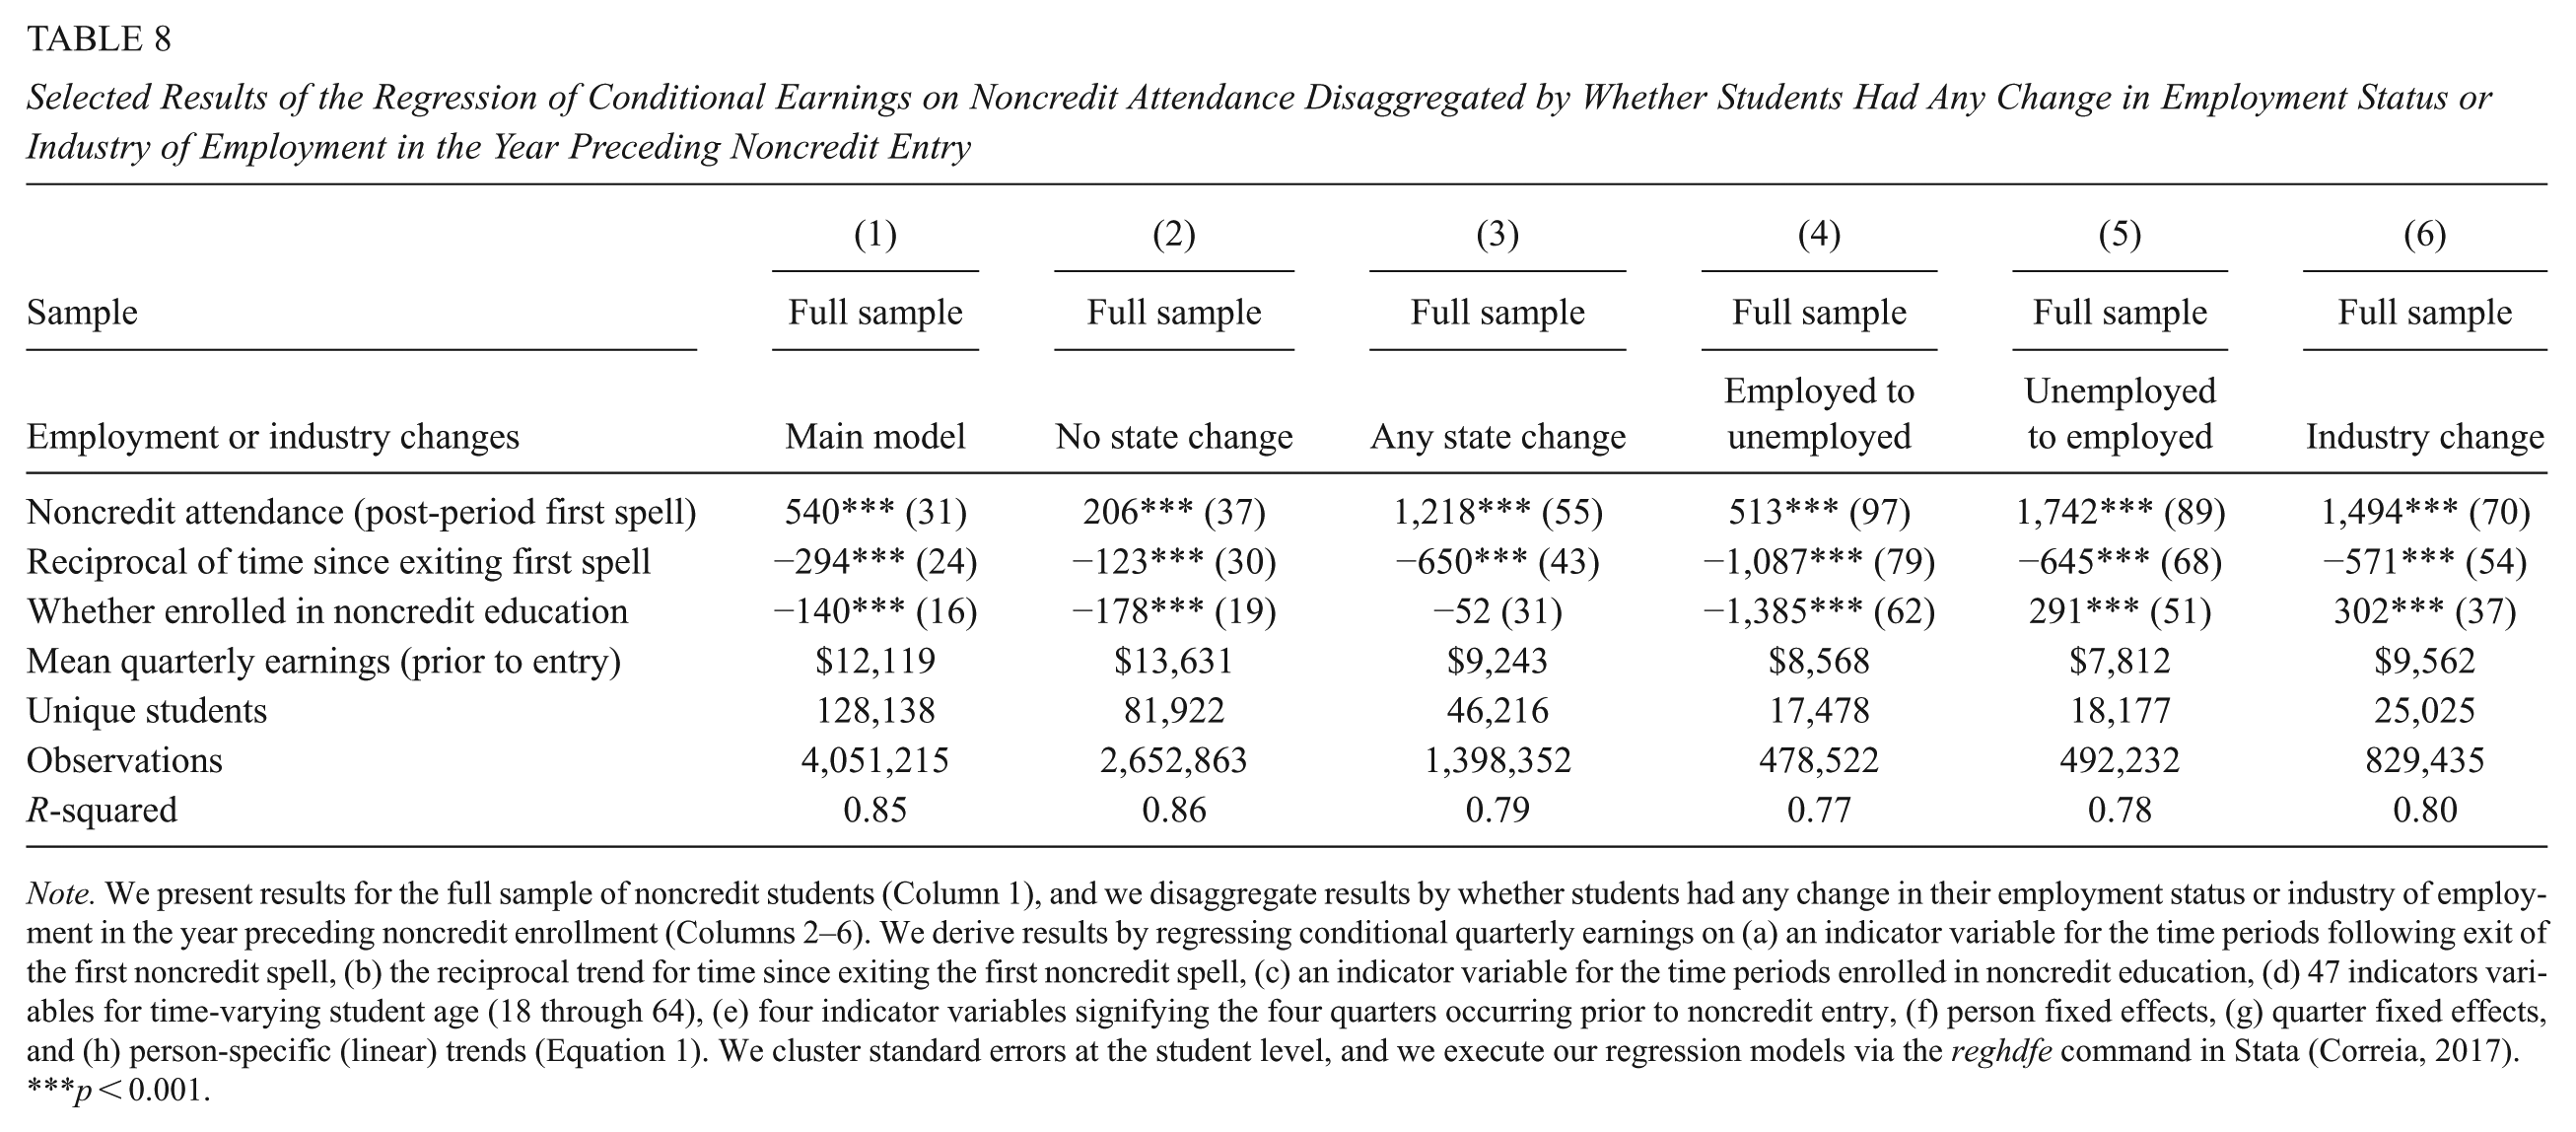
Note. We present results for the full sample of noncredit students (Column 1), and we disaggregate results by whether students had any change in their employment status or industry of employment in the year preceding noncredit enrollment (Columns 2–6). We derive results by regressing conditional quarterly earnings on (a) an indicator variable for the time periods following exit of the first noncredit spell, (b) the reciprocal trend for time since exiting the first noncredit spell, (c) an indicator variable for the time periods enrolled in noncredit education, (d) 47 indicators variables for time-varying student age (18 through 64), (e) four indicator variables signifying the four quarters occurring prior to noncredit entry, (f) person fixed effects, (g) quarter fixed effects, and (h) person-specific (linear) trends (Equation 1). We cluster standard errors at the student level, and we execute our regression models via the reghdfe command in Stata (Correia, 2017).
p < 0.001.
We further disaggregated students who experienced an employment change by the type of change: students who experienced at least one change from employment to unemployment in the four quarters preceding noncredit entry (n = 17,478; Column 4); students who experienced at least one change from employment to unemployment (n = 18,117; Column 5); and students who experienced at least one change in industry of employment (n = 25,025; Column 6). These three groups are not mutually exclusive because students could have experienced more than one type of change in the year preceding enrollment.
The point estimate for the students who were separated from employment ($513; Column 3) is comparable to that of the main model. This subgroup is reminiscent of those observed in prior analyses of returns to training for adult learners for whom job separations often serve as an impetus for enrollment (Jacobson et al., 2005). On the other hand, the long-run earnings estimates for the student subgroups who either moved into employment ($1,742; Column 5) or changed industries ($1,494; Column 6) prior to noncredit entry are substantially larger in magnitude. As was the case for female contract training participants (Table 4), each of these subgroups experienced positive and statistically significant increases in earnings during the periods in which they enrolled in training as well.
Taken together, these results highlight complexities in the selection processes that underlie enrollment in noncredit occupational training. We encourage other researchers to investigate how changes in employment status and industry of employment may serve as precipitating events for noncredit enrollment and relevant outcomes from noncredit participation (e.g., Carruthers & Sanford, 2018).
Additional Alternative Specifications
Fourth, we investigated the influence of other components of our preferred model on our results. We conducted a model-building exercise in which we sequentially introduced terms in our main model. After accounting for student and quarter fixed effects and student-specific trends, reciprocal growth trends and enrolled periods are still consequential for the magnitude of the long-run relationship between noncredit education and earnings, but the age fixed effects and indicators for the four quarters prior to enrollment are not (Supplemental Appendix Table 7 in the online version of the article). We also examined different ways to parameterize earnings growth after noncredit enrollment beyond our preferred reciprocal time trend. The alternatives included no earnings growth, linear growth, and nonlinear growth (Supplemental Appendix Table 8 in the online version of the article). Substantively, the interpretation of our results remains the same, and the statistical significance of the growth term coefficients confirms that earnings growth should be accommodated in some way. Nonparametric representations of the growth trend (Supplemental Appendix Figures 13 and 14 in the online version of the article) support a reciprocal contour. Our main estimates are also not sensitive to the inclusion of more (or fewer) quarterly indicators prior to enrollment (Supplemental Appendix Table 9 in the online version of the article). Finally, we examined the implications of truncating our 5-year (20 quarters) pre-enrollment and post-enrollment observation windows to 4, 3, and 2 years (Supplemental Appendix Table 10 in the online version of the article). Long-run relationships between noncredit education and earnings gains remain positive and statistically significant but shrink in magnitude with the observation windows, which is expected in light of the negative coefficient on the reciprocal growth term in our preferred model (Table 3, Model 1).
Alternative Samples
Finally, our results are not sensitive to alternative sample inclusion criteria such as the inclusion of students with more (or fewer) quarters of missing earnings before and after enrolling (Supplemental Appendix Table 11, Models 1–8 in the online version of the article), students aged between 20 and 22 at the time of noncredit entry (Supplemental Appendix Table 11, Models 9–14 in the online version of the article), or students who enrolled in credit coursework sometime after enrolling in noncredit (Supplemental Appendix Table 11, Model 15 in the online version of the article). Likewise, when we partition the sample into subsamples based on more fine-grained distinctions in number of noncredit hours (as compared with the subsamples used in Table 5), we continue to find that, for most part, estimated earnings gains tend to rise with number of contact hours, though the relationship is not perfectly consistent (Supplemental Appendix Table 12 in the online version of the article). Our main results also remain statistically significant and positive when we cluster standard errors at the institution level (Supplemental Appendix Table 11, Model 16 in the online version of the article).
Discussion
Using administrative data on the enrollment and earnings histories of 128,138 students who enrolled innoncredit training in Texas community colleges, we found that noncredit occupational education is associated with a modest but statistically significant increase in average earnings of about $500 (2019 dollars) per quarter by 2 years after enrollment, which is a 4.5% increase over average pre-enrollment earnings. The result aligned with our expectations given existing evidence of the returns to community college attendance (Jacobson et al., 2005) and community college certificates of short durations (Darolia et al., 2023). Noncredit students typically enroll for brief periods of time, attempt few courses, and accumulate a modest number of contact hours, making it especially noteworthy that noncredit education is associated with meaningful earnings gains. For context, however, consensus estimates of the returns to associate degrees and long-term certificates from community colleges exceed by a wide margin the average returns to noncredit education estimated in this study (Belfield & Bailey, 2017a; Carruthers & Jepsen, 2021). Our estimate of the returns to noncredit is also smaller than the main results for the economic returns to industry credentials affiliated with noncredit programs from Xu et al. (2024).
On average, returns to noncredit education are stronger for students who participated in longer durations of training—a finding that we expected given prior literature on the returns to community college attendance (Jacobson et al., 2005), the returns to community college credits (Bahr, 2019; Hodara & Xu, 2016; Schudde & Shea, 2022), and the returns to schooling in general (Becker, 1994, Belfield & Bailey, 2017a). Returns to noncredit education also vary substantially by field of study. The strongest returns overall are in Transportation, Engineering Technologies, and Construction, but we also found strong returns from training of relatively longer duration (more than 300 hours) in Nursing and Protective Services. Returns are stronger for men than for women, and stronger for contract training participants than for open-enrollment occupational participants, but these differences are driven in part by systematic sorting of men and women into fields and uneven distributions of training type by field.
Looking more closely at the our findings, the relationship between duration of training and earnings gains is complex and not uniform across fields (Figure 5). Students’ decisions to attempt more or fewer contact hours may be informed by their anticipated earnings gains. Students who attempted only 30 hours, for instance, may have reason to believe that they will not benefit from taking more noncredit coursework, whether due to the training requirements for licensure in their occupation, the predetermined length of the training program, the nature of the skills demanded by employers in their industry, or other reasons. This insight informed the specification of our preferred model with respect to enrollment intensity, and it leads us to argue that our findings regarding the relationship between contact hours and earnings are interpreted most precisely as the association between noncredit attendance and earnings for the students who attempted more or fewer contact hours, rather than the returns to more or fewer contact hours of noncredit instruction in and of themselves.
Our findings have direct relevance for the recent expansion of Pell Grant eligibility to include short-term, workforce programs. The Pell Grant is the most prominent federal grant program, totaling between $26 and $32 billion in annual expenditures over the last 5 years (Ma et al., 2024). Students with demonstrated financial need can receive a Pell Grant if they apply for federal financial aid, attend an eligible postsecondary institution, and enroll in an eligible program of study with a minimum length of 600 contact hours (Federal Student Aid, 2021). The new Workforce Pell Grants support students enrolled in programs with as few as 150 hours of training completed over 8 weeks (One Big Beautiful Bill Act, Pub. L. No. 119-21, § 83002, 139 Stat. 72, 2025), making some noncredit occupational training programs eligible if other conditions are met. Among those other conditions, the training program must be aligned with the hiring requirements of employers in high-skill, high-wage, or in-demand industries; must ready students to pursue a certificate or degree and award academic credit toward that credential if the student enrolls in the relevant certficate or degree program; have a completion rate of at least 70%; have a job placement rate of at least 70%; and yield value-added earnings that exceed the tuition and fees required to enroll in the training.
As mentioned earlier, most noncredit programs are shorter than the 150-hour requirement of Workforce Pell (Federal Student Aid, 2021; Jacoby, 2021; Van Noy & Hughes, 2022), but some do meet this requirement, including about one-fifth of the noncredit programs included in this study. One challenge that policymakers and higher education leaders will face to demonstrating the eligibilty of noncredit programs for Workforce Pell is the lack of evidence regarding the economic benefits accrued by participants in short-term, occupational training (Knott, 2023; Kreighbaum, 2019). To that point, our estimates indicate that noncredit students in Texas who attempted more than 150 contact hours realized strong earnings gains, averaging about $4,800 per year within 2 years for students taking 151–300 hours of training, and about $3,600 per year for students taking more than 300 hours of training. It is important to note, though, that returns among students in these longer-duration programs were unevenly distributed toward a handful of fields that are mostly male-dominated, with the noteworthy exception of Nursing (Figure 5). A related policy-relevant finding is that labor market returns for a majority of students who enrolled in shorter programs of less than 150 contact hours were of smaller magnitude but still positive and statistically significant.
Although wage gains clearly are a key metric of training program quality, policymakers and higher education leaders need to be aware that noncredit programs can offer labor market value yet not result in earnings gains. Training that is required for workers to maintain professional certifications or licenses, for instance the annual continuing education required in many states to maintain a nursing license, serves to help workers keep their jobs and carry out their work effectively and safely. Programs offering this type of training can be closely aligned with employers’ needs and broader societal goals, but the alignment may not be evident in wage growth. Other measures of value are needed in such cases.
As discussed, our estimates represent the effect of noncredit attendance on students’ post-college earnings as long as our identification assumptions hold, most fundamentally that trends in students’ earnings prior to enrolling would have continued on the same path over time had students never enrolled. Participation in noncredit education is not exogenously determined because students choose whether and when to enroll. Our empirical strategy addresses numerous ways in which unobserved factors might jointly determine noncredit participation and earnings. Nevertheless, it is unlikely that we addressed all sources of time-varying unobserved heterogeneity, as evidenced by some noncredit attendees’ concurrent changes in employment statuses and industries of employment, as well as the minority of students who participate in multiple enrollment spells. Indeed, research on the choice processes of noncredit students is fairly limited, including why different students enroll in community college noncredit coursework instead of other types of educational providers and why different students choose to enroll in different types of noncredit training (Van Noy, 2021). More research on this topic—including work that is intensive and qualitative (Douglas et al., 2023)—would help to refine model specifications in future research (DeLuca et al., 2021).
Researchers can expand upon work in other ways as well. Locating a credible comparison group of working adults who did not enroll in noncredit education would be a useful first step. Our analytic sample includes only noncredit enrollees. Although untreated subjects are not necessarily required for the identification of the relationship between education and earnings (Jacobson et al., 2005; Stevens et al., 2019), incorporating non-enrollees in the analysis could facilitate even more reliable estimates of labor market outcomes attributable to noncredit occupational training. Readers can look to the analysis by Carruthers and Sanford (2018) of adult technical centers in Tennessee for an example of this approach.
Likewise, researchers might incorporate a comparison group of credit enrollees into an analysis of the returns to noncredit occupational training. Within fields of study, there often is overlap in the curriculum between noncredit and credit divisions (Buckwalter & Maag, 2019; Education Strategy Group, 2020; Van Noy & Hughes, 2022; Van Noy et al., 2008). An evaluation of the field-specific returns to noncredit education in relation to credit education would provide informative results for students, employers, institutional leaders, and policymakers. The absence of noncredit transcript-level data in Texas inhibited us from pursuing this line of inquiry, but it may be feasible in other contexts. Readers can look to analyses of the democratizing and diversionary effects of community colleges relative to 4-year colleges by Mountjoy (2022) and Reynolds (2012) as well as the returns to for-profit providers in relation to community colleges by Cellini and Turner (2019) and Jepsen et al. (2021) as guides for this type of analysis.
Whether separately or in conjunction with the aforementioned directions for expanding this line of research, researchers could use dose-response models or similar approaches to estimate incremental returns to contact hours by field of study. These analyses could shed additional light on the relationships between duration of training and labor market outcomes (Angrist & Imbens, 1995; Bahr, 2019; Callaway et al., 2021; Cerulli, 2015; Ecton et al., 2023).
Finally, we provide evidence of the returns to noncredit training, but a better understanding of the return on investment for students also would be valuable (Kaine, 2023; Knott, 2023). Our analysis does not consider the direct costs of enrolling, as that information was not readily available for the time period under study. The indirect costs of training are likely comparatively low for noncredit students because many remain employed while enrolled, and training times are brief. Nevertheless, this information will be important as policymakers and institutional leaders discuss how best to implement the provisions of Workforce Pell.
Supplemental Material
sj-pdf-1-epa-10.3102_01623737251360029 – Supplemental material for Labor Market Returns to Community College Noncredit Occupational Education
Supplemental material, sj-pdf-1-epa-10.3102_01623737251360029 for Labor Market Returns to Community College Noncredit Occupational Education by Peter Riley Bahr and Rooney Columbus in Educational Evaluation and Policy Analysis
Footnotes
Acknowledgements
The opinions expressed are those of the researchers and do not represent the views of Lumina Foundation. We are grateful to and thank our state partners at the Texas Higher Education Coordinating Board and the Texas Education Research Center.
Author’s note
Rooney Columbus is now affiliated to E&E Analytics.
Declaration of Conflicting Interests
The author(s) declared no potential conflicts of interest with respect to the research, authorship, and/or publication of this article.
Funding
The author(s) disclosed receipt of the following financial support for the research, authorship, and/or publication of this article: Work on this paper was supported in part by a grant from Lumina Foundation (G21-2202-1115084).
Notes
Authors
PETER RILEY BAHR, PhD, serves as the vice president and managing research director of the Institute for the Future of Work at Strada Education Foundation. Dr. Bahr is a nationally recognized scholar and expert on postsecondary education, student outcomes, and economic mobility.
ROONEY COLUMBUS, PhD, is the founder and principal of E&E Analytics, a research consultancy. His research focuses on community colleges, career and technical education, postsecondary finance, and other higher education policy topics.
References
Supplementary Material
Please find the following supplemental material available below.
For Open Access articles published under a Creative Commons License, all supplemental material carries the same license as the article it is associated with.
For non-Open Access articles published, all supplemental material carries a non-exclusive license, and permission requests for re-use of supplemental material or any part of supplemental material shall be sent directly to the copyright owner as specified in the copyright notice associated with the article.