
Abstract
In this article, we explore whether the evaluation instruments used in the teacher selection process in Peru are good predictors of teacher effectiveness. To this end, we estimate teacher value-added (TVA) measures for public primary school teachers and test their relationship with Peru’s results of two rounds of the teacher evaluation (i.e., a centralized national stage and a decentralized stage performed at the school level). Our findings indicate that among the instruments that comprise the national stage of the process, the logical reasoning and curricular and pedagogical knowledge subtests have the strongest relationship with the TVA measure, while the weakest relationship is found with the reading comprehension component. Also, we find that the weighted aggregate score has a higher relationship with estimated TVA than the specific subtests. At the school-level stage, we find no significant relationships with our measures of TVA for math, as well as a nonrobust relationship for the classroom observation and interview evaluation instruments for reading. Moreover, we find relationships between our TVA measure and several teacher characteristics: TVA is higher for female teachers and for those at higher salary levels while it is lower for teachers with temporary contracts. These results provide lessons for the design and implementation of evaluation instruments in teacher hiring processes around the world.
Keywords
T
In this article, we measure the extent to which the centralized and decentralized teacher evaluation instruments used to select public school teachers in Peru since 2015 are good predictors of teacher efficacy. To do this, we first estimate teacher value-added (TVA) measures for public primary school teachers in Peru using National Student Evaluation data (Evaluación Censal de Estudiantes, ECE) and the Education Information Management System database (Sistema de Información de Apoyo a la Gestión de la Institución Educativa, SIAGIE). The ECE dataset allows us to examine test-score results for a panel of second- and fourth-grade primary students, and the SIAGIE database links them with their math and language teacher. Second, we study the relationship between the standardized evaluation instruments of the Peruvian teacher selection process and the TVA measure. We also examine the relationship between more traditional evaluation instruments that have been explored in the literature (e.g., professional experience, years of education, type of training) and the effectiveness of teachers.
We find that among the three subtests that comprise the first, centralized stage of the teacher evaluation process (Prueba Única Nacional, PUN), the logical reasoning and curricular and pedagogical knowledge components have the strongest (and significant) relationship with our TVA measure, while the weakest relationship is found with the reading comprehension component. This result is robust when correcting for bias due to nonrandom selection into teaching. Moreover, we find that the aggregate PUN score has a higher relationship with estimated TVA than the specific subtests, suggesting that the weighted combination of the different instruments possibly increases the ability to predict teacher effectiveness. At the second, decentralized stage, we find no significant relationship with our measures of TVA for math, as well as nonrobust relationships for the classroom observation and interview instruments for reading. Moreover, we do find relationships between our measure of TVA and several teacher characteristics: TVA is higher for female teachers and for those at higher salary levels, while it is lower for teachers with temporary contracts (compared with those with permanent positions). These results can be a relevant input to evaluate the distribution of the weights of the different components of the evaluation not only in the Peruvian teaching contest but also in other educational systems that use multiple instruments to select candidates. Our findings also point to a need to examine the scope of the decentralized stage and, in the short run, to strengthen the monitoring of its implementation.
The remainder of the article proceeds as follows. In the next section, we present a literature review on teacher evaluation instruments and the contribution of our article to this literature. In the “Teacher Selection Process in the Peruvian Public School System” section, we provide background information on the teacher selection process in the Peruvian public school system. The “Method” section describes the empirical strategy employed while the “Data” section describes the data and discusses possible biases. The “Main Results” section presents and describes the results, and the last section concludes.
Literature Review and Contribution
Our article relates to the literature on teacher recruitment and teacher effectiveness. Recruiting (and retaining) competent teachers should be the goal of every educational institution. Yet, there is very little research that combines recruitment and retention, with a focus on teacher quality. Indeed, such studies have been hindered by both the difficulty of establishing an agreed-upon definition of teacher quality and the scarcity of data that allows to identify effective teachers and examine the factors that promote their recruitment and retention (Guarino et al., 2004). This study aims to bridge this gap by combining unique information on teacher selection and teacher effectiveness in Peru.
There is extensive debate over the quality of the instruments used to select new teachers. Traditionally, teacher hiring choices for permanent positions are based on applicants’ professional and educational backgrounds. Although these characteristics are easy to observe and evaluate, the evidence suggests that neither traditional academic certificates (Aaronson et al., 2007; Clotfelter et al., 2007, 2010; D. D. Goldhaber & Brewer, 1999; Hanushek & Rivkin, 2012; Leigh, 2010; Rivkin et al., 2005; Slater et al., 2012) nor years of experience—after the initial years—(Araujo et al., 2016; Clotfelter et al., 2010; Harris & Sass, 2011; Rivkin et al., 2005) are good predictors of teaching effectiveness.
Given the above, several educational systems have begun to consider additional instruments for selecting teachers, such as standardized tests of basic knowledge (generally mathematics and reading) and/or specific curricular and pedagogical knowledge, practical evaluations such as classroom observation, and interviews with the school principal or other officials. Various studies show that knowledge tests and standardized classroom observations are correlated with greater teacher effectiveness (Bruno & Strunk, 2019; D. Goldhaber, Cowan, & Theobald, 2017; D. Goldhaber, Grout, & Huntington-Klein, 2017; Kane et al., 2011; Kane & Staiger, 2012), as are interviews with the school principal or other officials (Harris & Sass, 2014; Jacob & Lefgren, 2008). Moreover, a number of scholars find that teachers’ scores on knowledge tests are directly associated with higher student learning (Bietenbeck et al., 2018; Clotfelter et al., 2006, 2007; Hanushek et al., 2017; Metzler & Woessmann, 2012), particularly in the subject they teach. Furthermore, aside from having the advantage of being less controversial than standardized tests (Cruz-Aguayo et al., 2020), empirical evidence indicates that classroom observation is a good predictor of teaching quality, particularly for tenured teachers (Araujo et al., 2016; Jacob et al., 2018; Kane et al., 2011; Kane & Staiger, 2012; Milanowski, 2004; Taut et al., 2016; Tyler et al., 2010). That said, Cruz-Aguayo et al. (2017) find no relationship between a teacher’s score on the classroom observation instrument and student learning in Ecuador. Such mixed findings suggest the need to better understand how demonstration classes are implemented and evaluated. Finally, although little research has been conducted on the interview instrument, Jacob et al. (2018) find that, in Washington, D.C., structured interviews conducted by staff and teachers in the school district during the hiring process are related to greater teaching effectiveness.
In the Latin American context, various combinations of assessment instruments are used to select candidates. Bertoni et al. (2020) analyze the hiring systems of 12 countries in the Latin America and the Caribbean region (LAC), including Peru. They observe that in most of these countries, teachers are required to have a teaching degree or a professional degree in a specific field. In addition to their educational background, teachers’ experience is also considered. In Peru, Brazil, Colombia, Ecuador, and Honduras, new teachers must pass a standardized assessment. Classroom observation is not, however, a widespread practice in the process of selecting teachers, used only in Peru, Rio de Janeiro, and Ecuador. Finally, in addition to Peru, Barbados, Chile, Colombia, Honduras, and Jamaica also include interviews as part of their teacher selection processes. 2
Our study also contributes to the growing body of work on the predictive power of teacher selection instruments. There is an extensive literature, mainly for the United States and other developed countries, that examines whether teacher screening instruments are correlated with a measure of teacher effectiveness estimated through value-added models (VAMs). 3 The wide variety of instruments used in the Peruvian evaluation (including standardized tests for candidates and classroom observation), the existence of a centralized and of a decentralized stage at the school level, and the large size of the sample of teachers evaluated contribute to the empirical evidence on the ability of selection instruments to predict teacher effectiveness. Also, this article is the first to estimate TVA in Peru through the use of administrative data sources (i.e., SIAGIE and ECE). In LAC school systems generally, student assessments are usually not designed to be comparable over time, making such studies challenging to conduct. This article also represents the first assessment of whether the teacher evaluation instruments currently used in Peru to select teachers predict teacher effectiveness. While the use of VA measures for accountability purposes is somewhat controversial (e.g., Rothstein, 2010), the objective here is to evaluate how well the teacher evaluation instruments in Peru identify higher performing teachers. Finally, we shed light on the differing predictive power of evaluation instruments implemented at the centralized versus decentralized level. Peru is one of the only systems in the world that includes both a centralized and a decentralized stage in its process of selecting and assigning teachers to schools (Bertoni et al., 2020; Organisation for Economic Co-Operation and Development [OECD], 2014).
Teacher Selection Process in the Peruvian Public School System
In 2015, the Peruvian government instituted a new evaluation system for aspirant instructors seeking a tenured teaching position in the public school system. To be eligible to participate, candidates must hold a bachelor’s degree in education. The evaluation consists of two stages: The first is centralized and carried out at the national level, and the second is decentralized, at the school level. The centralized stage is carried out by the MINEDU and includes a standardized written test (PUN) that is divided into three subtests, which carry different weights in the aggregated score: logical reasoning (25%), reading comprehension (25%), and curricular and pedagogical knowledge (50%). To pass the centralized stage, candidates need to answer at least 60% of the questions correctly on each subtest. Applicants are also evaluated in a specific area of specialization relative to the education level (preprimary/primary/secondary) and subject (e.g., secondary science) they plan to teach.
Only candidates who score above the required threshold at the centralized stage can then rank their school preferences, chosen within their area of specialization and in one of the 26 regions of Peru. In the 2015 evaluation process, candidates could list a maximum of five school preferences, which became an unlimited number from 2017 onward. Once the preferences are established, the MINEDU assigns each candidate to a maximum of two (in 2015) or of three (in 2017) of their preferred schools, based on their PUN score and their preference ranking. In 2015, each vacancy could have up to 20 candidates; this was reduced to 10 in 2017.
Once candidates have been assigned to their preferred schools, they begin the decentralized stage, which is carried out by each school or by the local education administrative units (Unidades de Gestión Educativa Local, UGEL) in the case of single-teacher institutions. This stage consists of three instruments that have different weights in the aggregated score: an evaluation of a candidate’s resume (25%), a personal interview (25%), and a classroom observation (50%). To pass the decentralized stage, candidates must score a minimum of 30 (out of 50) points on the classroom observation component. Table 1 reports the thresholds of the centralized and decentralized stages of the selection process, the implications of the results obtained, and the government authority responsible for evaluating the respective subtests. We present a more detailed description of the scale of the evaluations, the consequences of the results, and the government authority in charge of its implementation in Supplementary Appendix A (in the online version of the journal).
Teacher Evaluation Instruments and Corresponding Thresholds
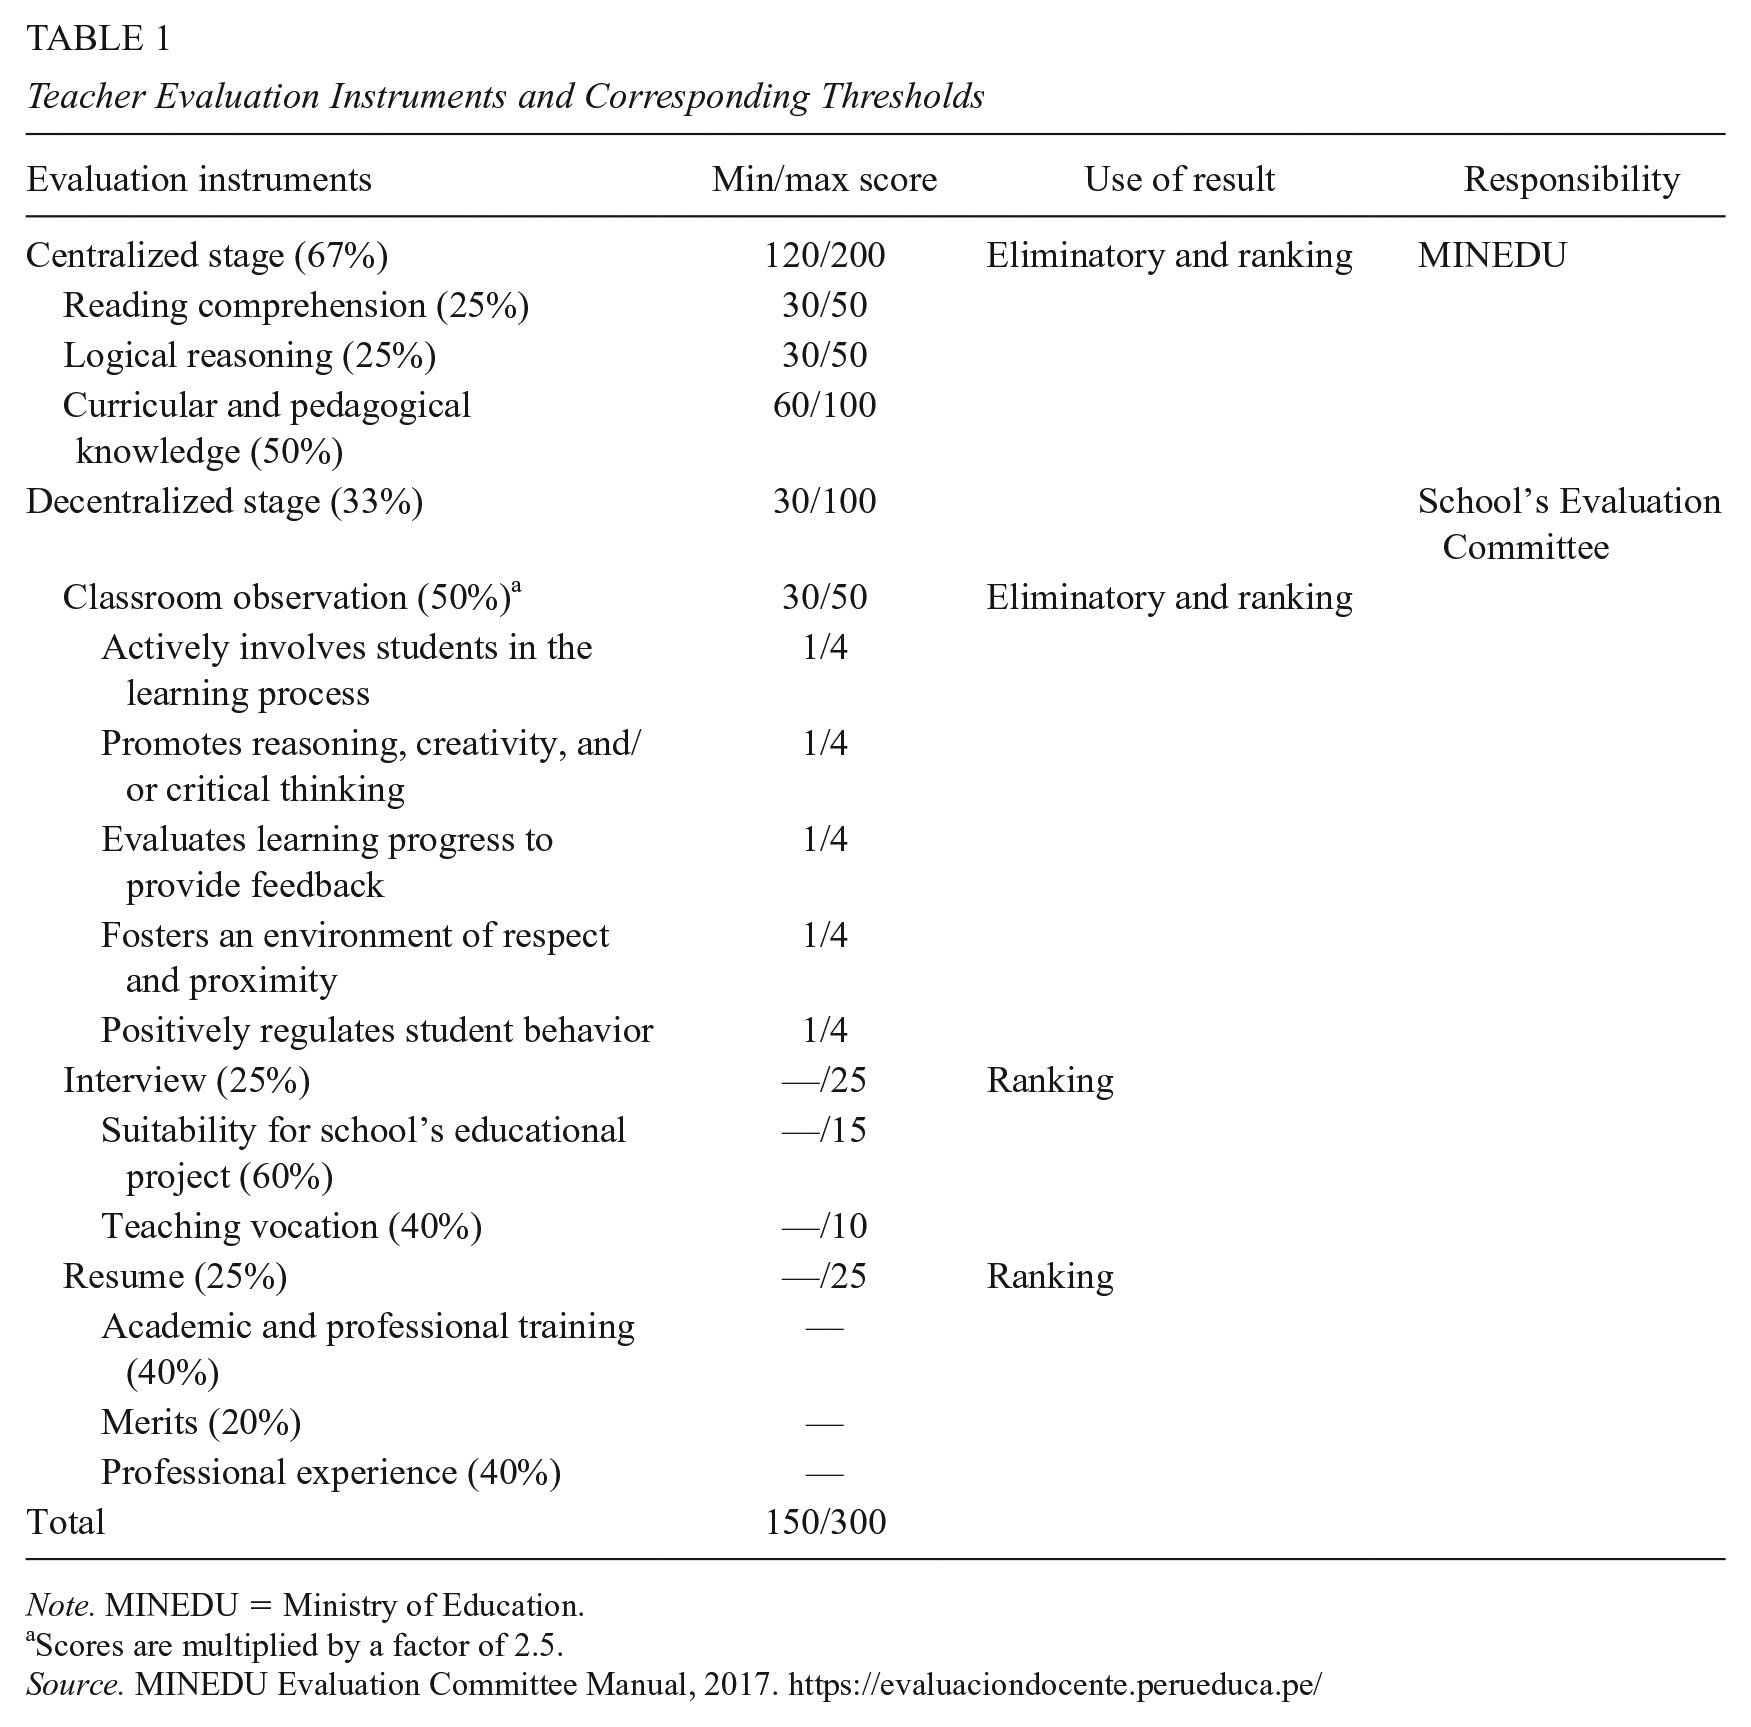
Note. MINEDU = Ministry of Education.
Scores are multiplied by a factor of 2.5.
Source. MINEDU Evaluation Committee Manual, 2017. https://evaluaciondocente.perueduca.pe/
Finally, MINEDU uses the weighted sum of the scores obtained in the centralized and decentralized stages (the centralized stage has a weight of 67% on the final score) to assign the vacancies in order based on merit and on the candidate’s preferences. 4 Figure 1 summarizes the teacher selection process in Peru.
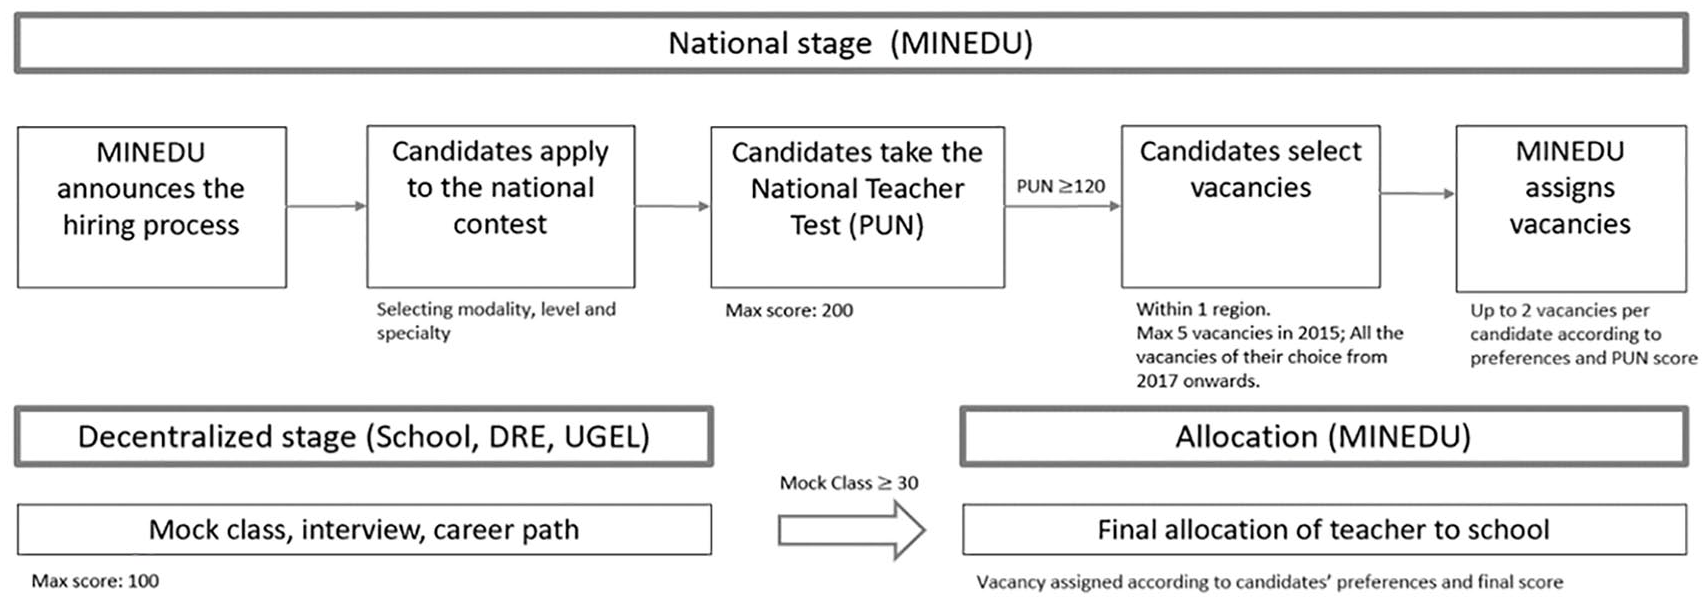
Teacher hiring process in Peru.
Once the assignment process has been completed, the candidates who did not manage to obtain a permanent teaching position are able to apply for a temporary position. At this point, the candidates are evaluated solely according to their final score at the centralized stage, where no minimum passing score is required. They are hired through a public tender that takes place in each UGEL. Specifically, candidates select one UGEL of their preference that has vacancies in their area of specialization on the PUN. They are then ranked by “merit” in descending order according to their score at the centralized stage. Those with the highest score are the first to choose among the available vacancies of that UGEL.
Figure 2 plots, by year, the probability of being employed the year after the teacher hiring process and candidate performance on the three different tests of the centralized evaluation stage. The sample refers to all candidates who participated in the 2017 selection (figures for the 2015 teacher hiring process are similar and are available upon request). Note that the probability of being employed is different from zero below the cutoffs given that, as explained above, applicants who do not pass the centralized stage can still be hired as temporary teachers at the end of the hiring process. In 2015, 30% of teachers in the public sector held a temporary contract. Moreover, 61% of the candidates who selected vacancies for a permanent position were already temporary teachers in a public school, having on average 4 years of experience in the public sector and 2 in the private sector. We observe that the probability of being employed is positively correlated with the instruments of the centralized evaluation stage, and this probability increases passing the threshold of each test. In addition, there is a flat relationship below the threshold for all but the curriculum knowledge component, where the probability of being employed starts to rise at around 20 points below the cutoff in both years. This could be explained by the fact that, by construction, this is the component that carries the greatest weight in the centralized stage. Moreover, the MINEDU relies on this score, among others, as a priority criterion to break ties among candidates (see endnote 4).
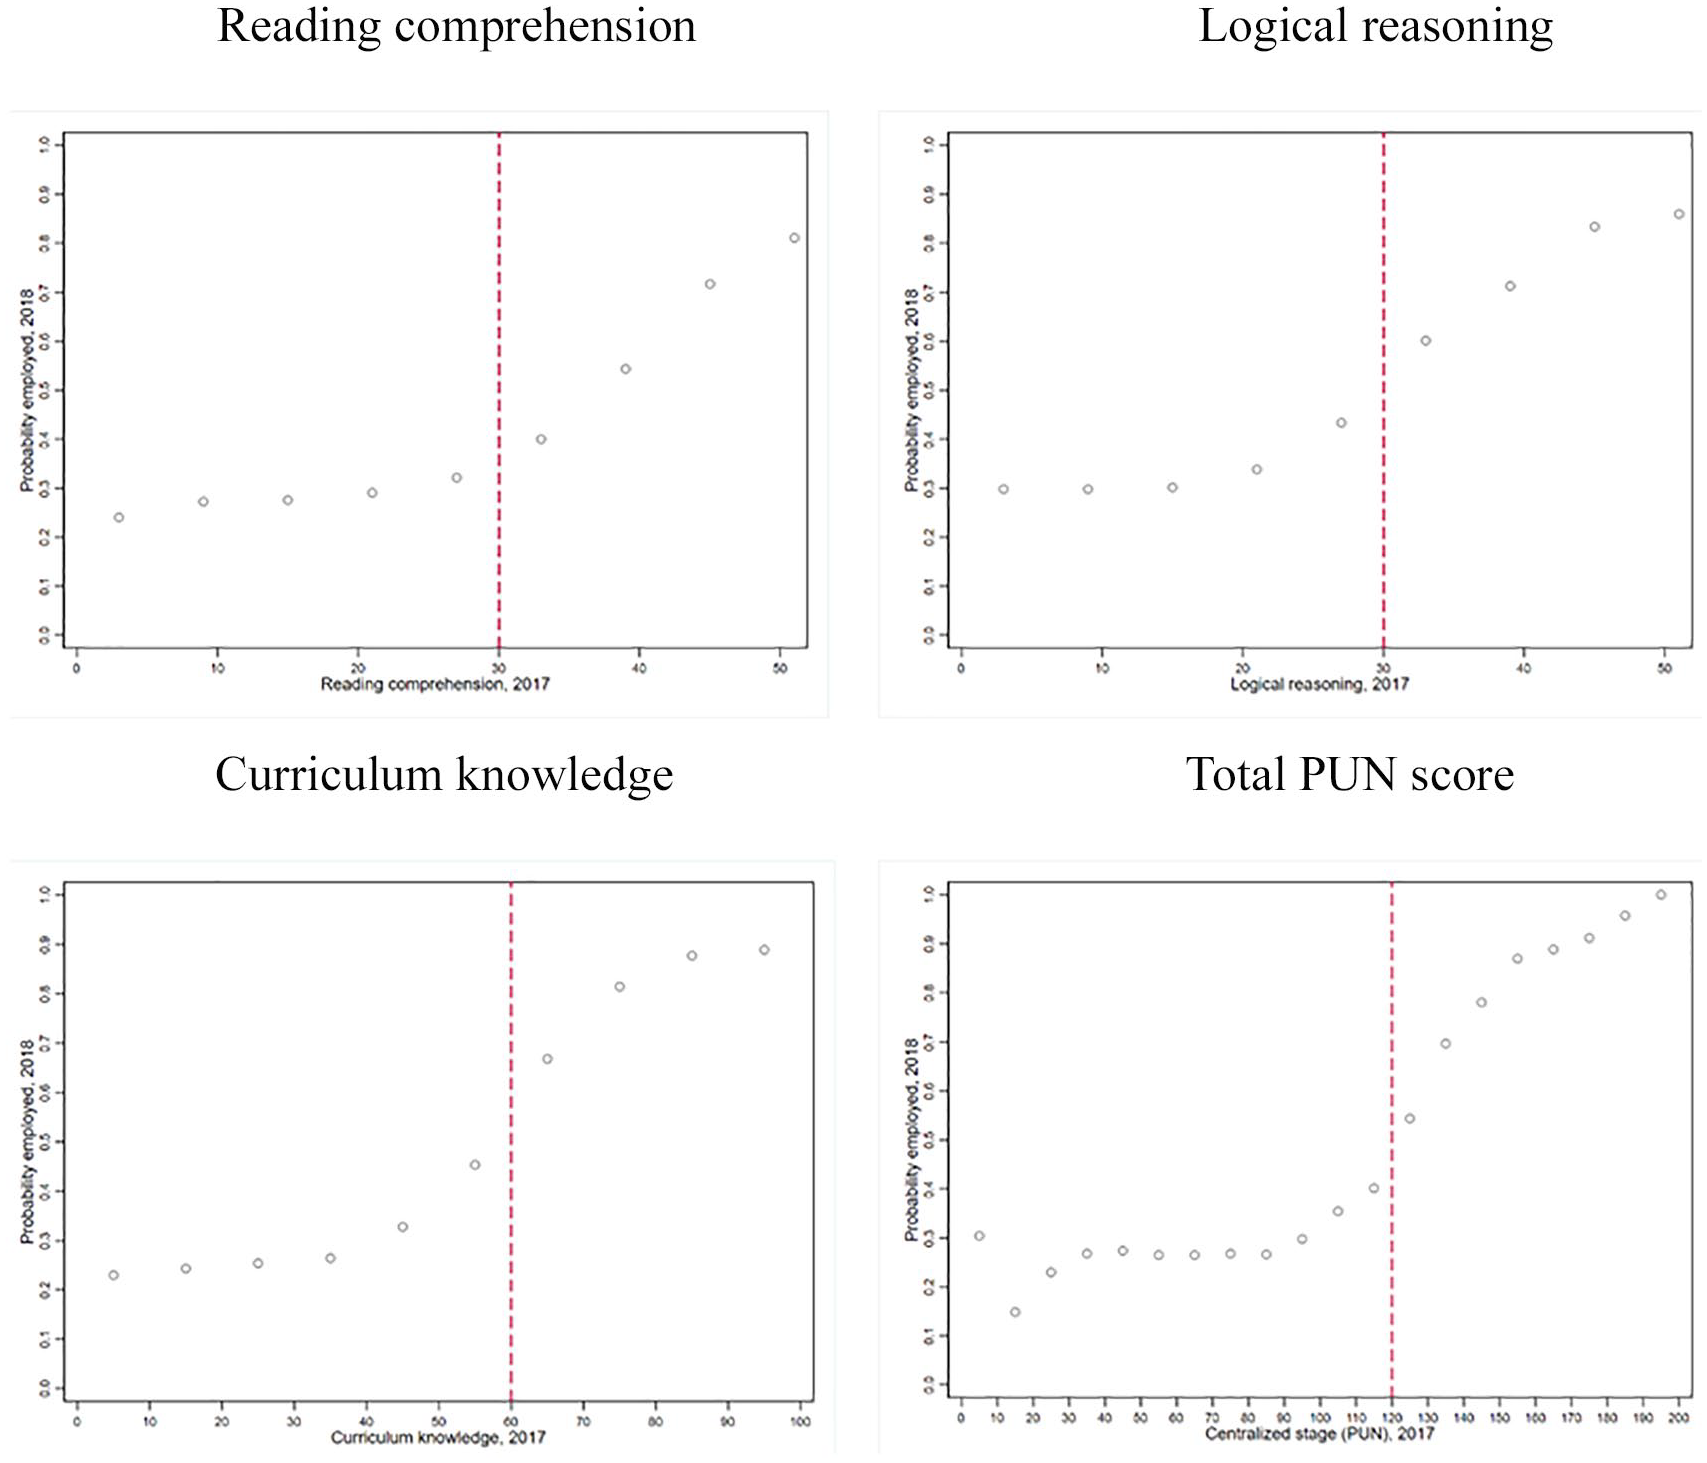
Distribution of teacher evaluation scores and the probability of being employed, 2017.
Method
TVA
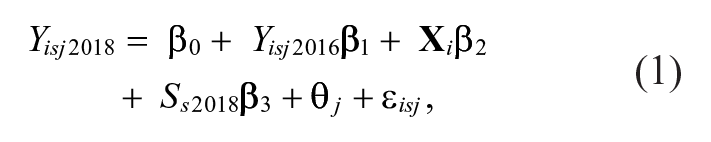
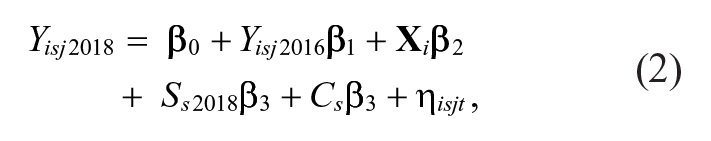
A wide variety of VAMs have been estimated in the literature. Borrowing from the linear VAM of Koedel et al. (2015), we first estimate a basic TVA model of the form,
where Yisj2018 is the 2018 ECE test score in math or reading for fourth-grade primary student i at school s that is taught by teacher j; Yisj2016 is the student’s second-grade ECE score in either math or reading in 2016;
where
By including prior attainment, we control for some of the school effect, the impact of previous teachers’ inputs, as well as for student’s own ability and prior effort (Slater et al., 2012). However, we accept that our estimation of TVA can be affected by unobserved factors (e.g., student sorting, tracking, differences in peer characteristics) that are usually accounted for by having a long enough panel that is able to follow the same teacher with different students or in different schools over time (e.g., estimating a model with school and/or student fixed effects). However, our data do not enable us to implement these corrections given that 99% of the primary teachers in our sample are teaching in just one classroom per grade and in only one school. In addition, estimating a second VA measure for the same group of teachers does not seem to be an option given the available data in Peru. This is because, on one hand, the national standardized test (ECE) 2019 dataset for primary students collects data for only a sample of students and, on the other, in 2017, the evaluation was suspended because of a natural disaster and a disruptive teacher strike. However, we argue that the inclusion of the student’s past score allows us to account for most of the potential nonrandom sorting of students to teachers. The VAM literature suggests that teacher effects estimated from models controlling for prior tests tend to be highly correlated with one another (D. Goldhaber et al., 2014). Also, experimental (e.g., Bacher-Hicks et al., 2014; Kane & Staiger, 2008) and quasiexperimental evidence (e.g., Chetty et al., 2014) suggest they have little to no bias. For example, Chetty et al. (2014) demonstrate that when controlling for the score obtained in a previous test of the students, a maximum estimated bias of 5% is obtained and that bias is statistically not different from zero.
A challenge in the case of Peru is that the ECE student assessment is not consecutive. That is, between the two tests (second and fourth grades) a student may have been taught by different teachers. The literature provides several options to address this problem. We follow Hock and Isenberg (2017) and estimate single effects for each teacher by applying weighted least squares (WLS) to Equation 1, with the weights equal to “teacher dosages” where the dosages are the percentage of instructional time that each teacher spends with the student. 6 Following Hock and Isenberg (2017) and other studies (e.g., Slater et al., 2012), we assume that the time is divided equally between teachers (e.g., if a student had one math teacher in third grade and a different one in fourth grade, each is assigned a weight of 0.5). In our sample of fourth-grade students, 77% had the same teacher in third and fourth grades. Throughout the article, we first present results for this restricted sample, because in this case, we do not need to rely on assumptions about how to split the value-added (VA). We also present results based on the full sample, relying on the “equal time” assumption.
Extensions to Basic VAM
We extend this basic model in three ways. First, we introduce the score of the student in the other subject (e.g., in the estimation of VA in math, we include the student’s ECE language score in second grade). Second, we add nonlinearities in both subjects (i.e., squared of math and second-grade ECE language scores) and the interaction between them. There is evidence that adding this set of variables reduces bias in the estimation of the VA measures, compared with a model using only the lagged outcome in the same subject (e.g., Ehlert et al., 2014; Lockwood & McCaffrey, 2014). Finally, we also estimate all of the VA measures employing a two-step VAM or “average residuals” VAM (Koedel et al., 2015). The two-step VAM uses the same information as Equation 1 while performing the TVA estimation in two stages. In the first stage, we estimate the model in Equation 1 without teacher fixed effects. This allows us to account for students’ characteristics aggregated at the classroom level, which could not be added in our one-step model estimated over one cohort of students. Specifically, we estimate a model of the below form:
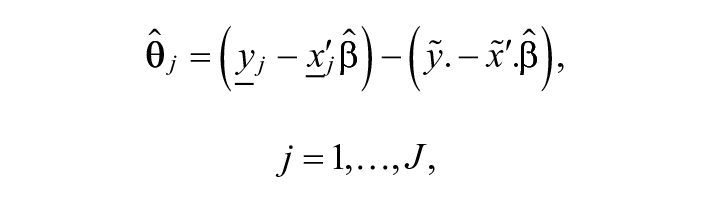
where all variables are defined as in Equation 1, and Cst is a set of student variables aggregated at the classroom level (percentage of high-SES students, average ECE math and reading scores in second grade). In the second stage, estimated residuals from Equation 2 are used as a dependent variable in a regression against teacher fixed effects:

where the vector θ j contains TVA estimates. The key feature that distinguishes the one-step from the two-step model is that the latter partials out the variation in Yisj attributable to lagged test scores and to other controls before estimating the teacher effects. In this way, the two-step model essentially equalizes competing units based on observable student characteristics prior to comparing VA between units. Note that the one-step model potentially conflates the unit effects with other factors (e.g., class composition). Meanwhile, the two-step procedure has the potential to “over correct” for observable differences between units. The direction and magnitude of the bias in each model cannot, however, be determined with certainty as the underlying true values of the unit effects are unknown. That said, the potential bias in the one-step model likely favors advantaged schools, while the potential bias in the two-step model likely favors disadvantaged schools.
Teacher Characteristics and TVA
Following Bau and Das (2020), we estimate the association between estimated TVA and observed teacher characteristics for public school instructors using the following specification:
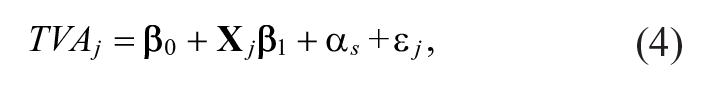
where TVAj is a teacher j’s average VA over math and reading;
Relationships Between TVA and Teacher Evaluation Instruments
After estimating the VAM, we run regressions between the estimated TVA
Following the methodology developed in Heckman and Navarro-Lozano (2004) and its practical implementation in Jacob et al. (2018), we seek to estimate the true relationship between teacher evaluation instruments and TVA, purged of the bias due to nonrandom selection into teaching (i.e., we can only estimate TVA for the instructors who are actually teaching in a public school after the hiring process). To this end, we use the discontinuity around the cutoffs of the centralized stage to predict the probability of being hired, as an exclusion restriction in a parametric selection correction. Using the data of all applicants in the 2015 and 2017 teacher recruitment years, we first estimate candidates’ predicted probabilities of being hired using the three PUN cutoffs as instruments through a linear probability model of the form,
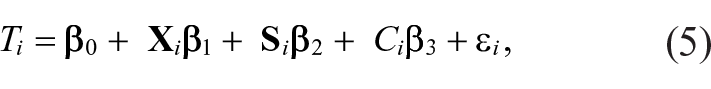
where Ti takes the value of 1 when teacher i is teaching in a public school the year after the hiring process (2016 or 2018);
Data
We employ several different data sources. First, teacher and student information come from the Education Information Management System (SIAGIE) databases for the period 2016 to 2018. This is the only data source in Peru that provides classroom-level information, allowing us to link students with the instructors who teach a particular subject in a given classroom.
Second, using the National Student Evaluation (ECE) database, we compute individual results for primary student performance on the standardized math and reading tests. The census nature of these data allowed us to link the scores in second and fourth grade of primary school for the same student for each subject. Moreover, we use information collected through the ECE Parent Survey, a background questionnaire that includes questions on the SES of the student’s household, to construct SES indicators at the student level.
A third source of data consists of the results of the 2015 and 2017 teacher selections. This database includes individual-level applicant characteristics and detailed evaluation results for all participants in the selection process. We retrieved teachers’ scores on the centralized (PUN) and those received at the decentralized evaluation stage and estimate their relationship with our VA measures. When a teacher has scores in both 2015 and 2017 teacher selection processes, we use the 2017 scores.
Fourth, we use school-level data from the 2017 and 2018 National Educational Census (Censo Educativo) database. This database includes school characteristics such as area (urban/rural), type of school (i.e., single-teacher, multigrade, or multiteacher), an indicator of whether the school is bilingual, total enrollment, and access to basic services, among others.
Finally, we complement the teacher-level information with the 2018 Vacancy Management and Control System database (Sistema de Administración y Control de Plazas, Nexus), which provides information on gender, age, workday, salary level, and type of contract for all teachers in the system.
Figure 3 summarizes the timeline of the processes explored in this analysis. For the calculation of teachers’ individual VA, we identify the teachers who, in 2017 and 2018, taught the 2018 cohort of fourth-grade public primary students in Peru. Thanks to the structure of the ECE, it is possible to trace the scores of the same cohort of students back in 2016. Moreover, we take advantage of the 2015 and 2017 teacher evaluation processes to estimate the relationship between the evaluation score and the VA measure of the instructors who were teaching in 2018.
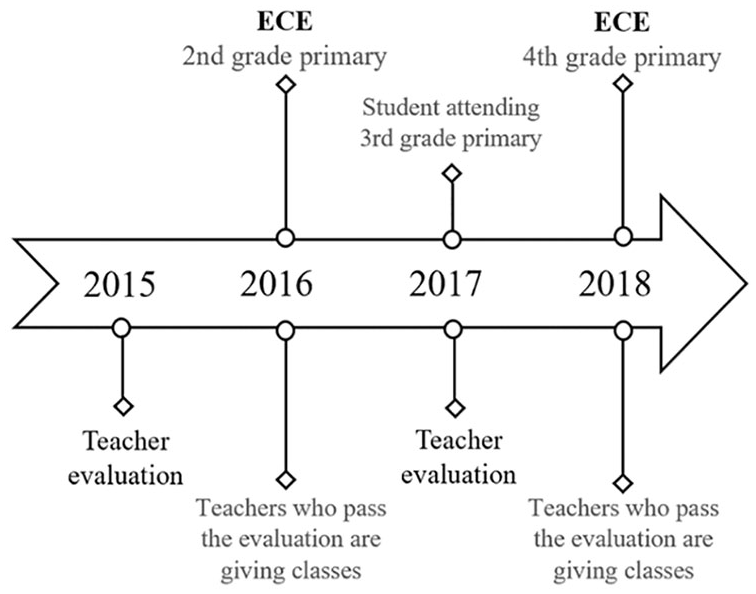
Timeline of teacher and student evaluations.
Data Limitations and Sample Restrictions
In this section, we discuss the data limitations and the sample restrictions that apply to this study. First, the information reported in the SIAGIE is not directly collected by the MINEDU but is generally compiled by the school principals. This could lead to inaccuracies, given that carrying out this task possibly represents an additional burden to principals’ already numerous responsibilities. Indeed, when compared with the magnitudes reported in the National Educational Census collected by the MINEDU, teacher and student data in the SIAGIE appear to be underreported. This is especially true for teacher data. For example, as Table 2 shows, in 2016, the National Educational Census reported a total of 143,538 public primary teachers while the SIAGIE reported less than half that number. Contrary to the SIAGIE, the Nexus database is administered by the UGEL and, although slightly incomplete, reports teacher data magnitudes that more closely resemble those presented in the Census.
Teacher and Student Data Coverage Comparison (Primary, Public)
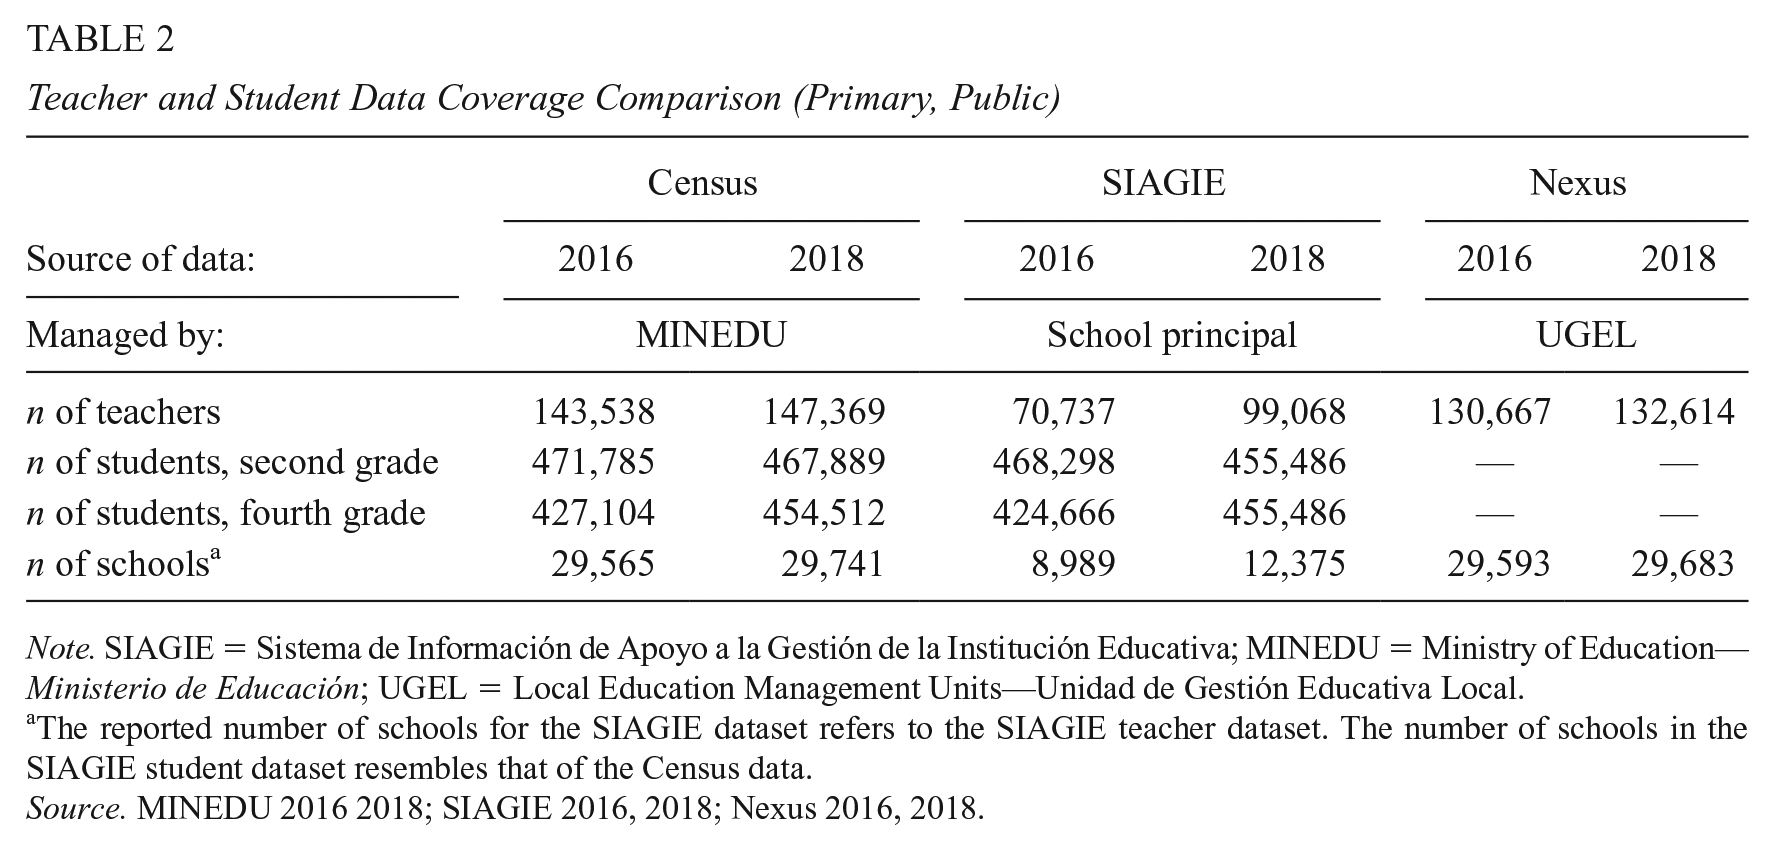
Note. SIAGIE = Sistema de Información de Apoyo a la Gestión de la Institución Educativa; MINEDU = Ministry of Education—Ministerio de Educación; UGEL = Local Education Management Units—Unidad de Gestión Educativa Local.
The reported number of schools for the SIAGIE dataset refers to the SIAGIE teacher dataset. The number of schools in the SIAGIE student dataset resembles that of the Census data.
Source. MINEDU 2016 2018; SIAGIE 2016, 2018; Nexus 2016, 2018.
Given these limitations, Table 3 presents an overview of the sample restrictions. The population of potential students includes the 454,512 Peruvian fourth-grade public primary school students who were evaluated in the ECE in 2018. This is the maximum number of students that could be included in VAMs if the data were perfect (e.g., availability of second-grade primary scores, links to teachers and classrooms). Similarly, the teacher population of interest includes around 26,800 teachers 8 who taught third-grade math or reading in 2017 and/or fourth-grade math or reading in 2018.
Sample Restrictions
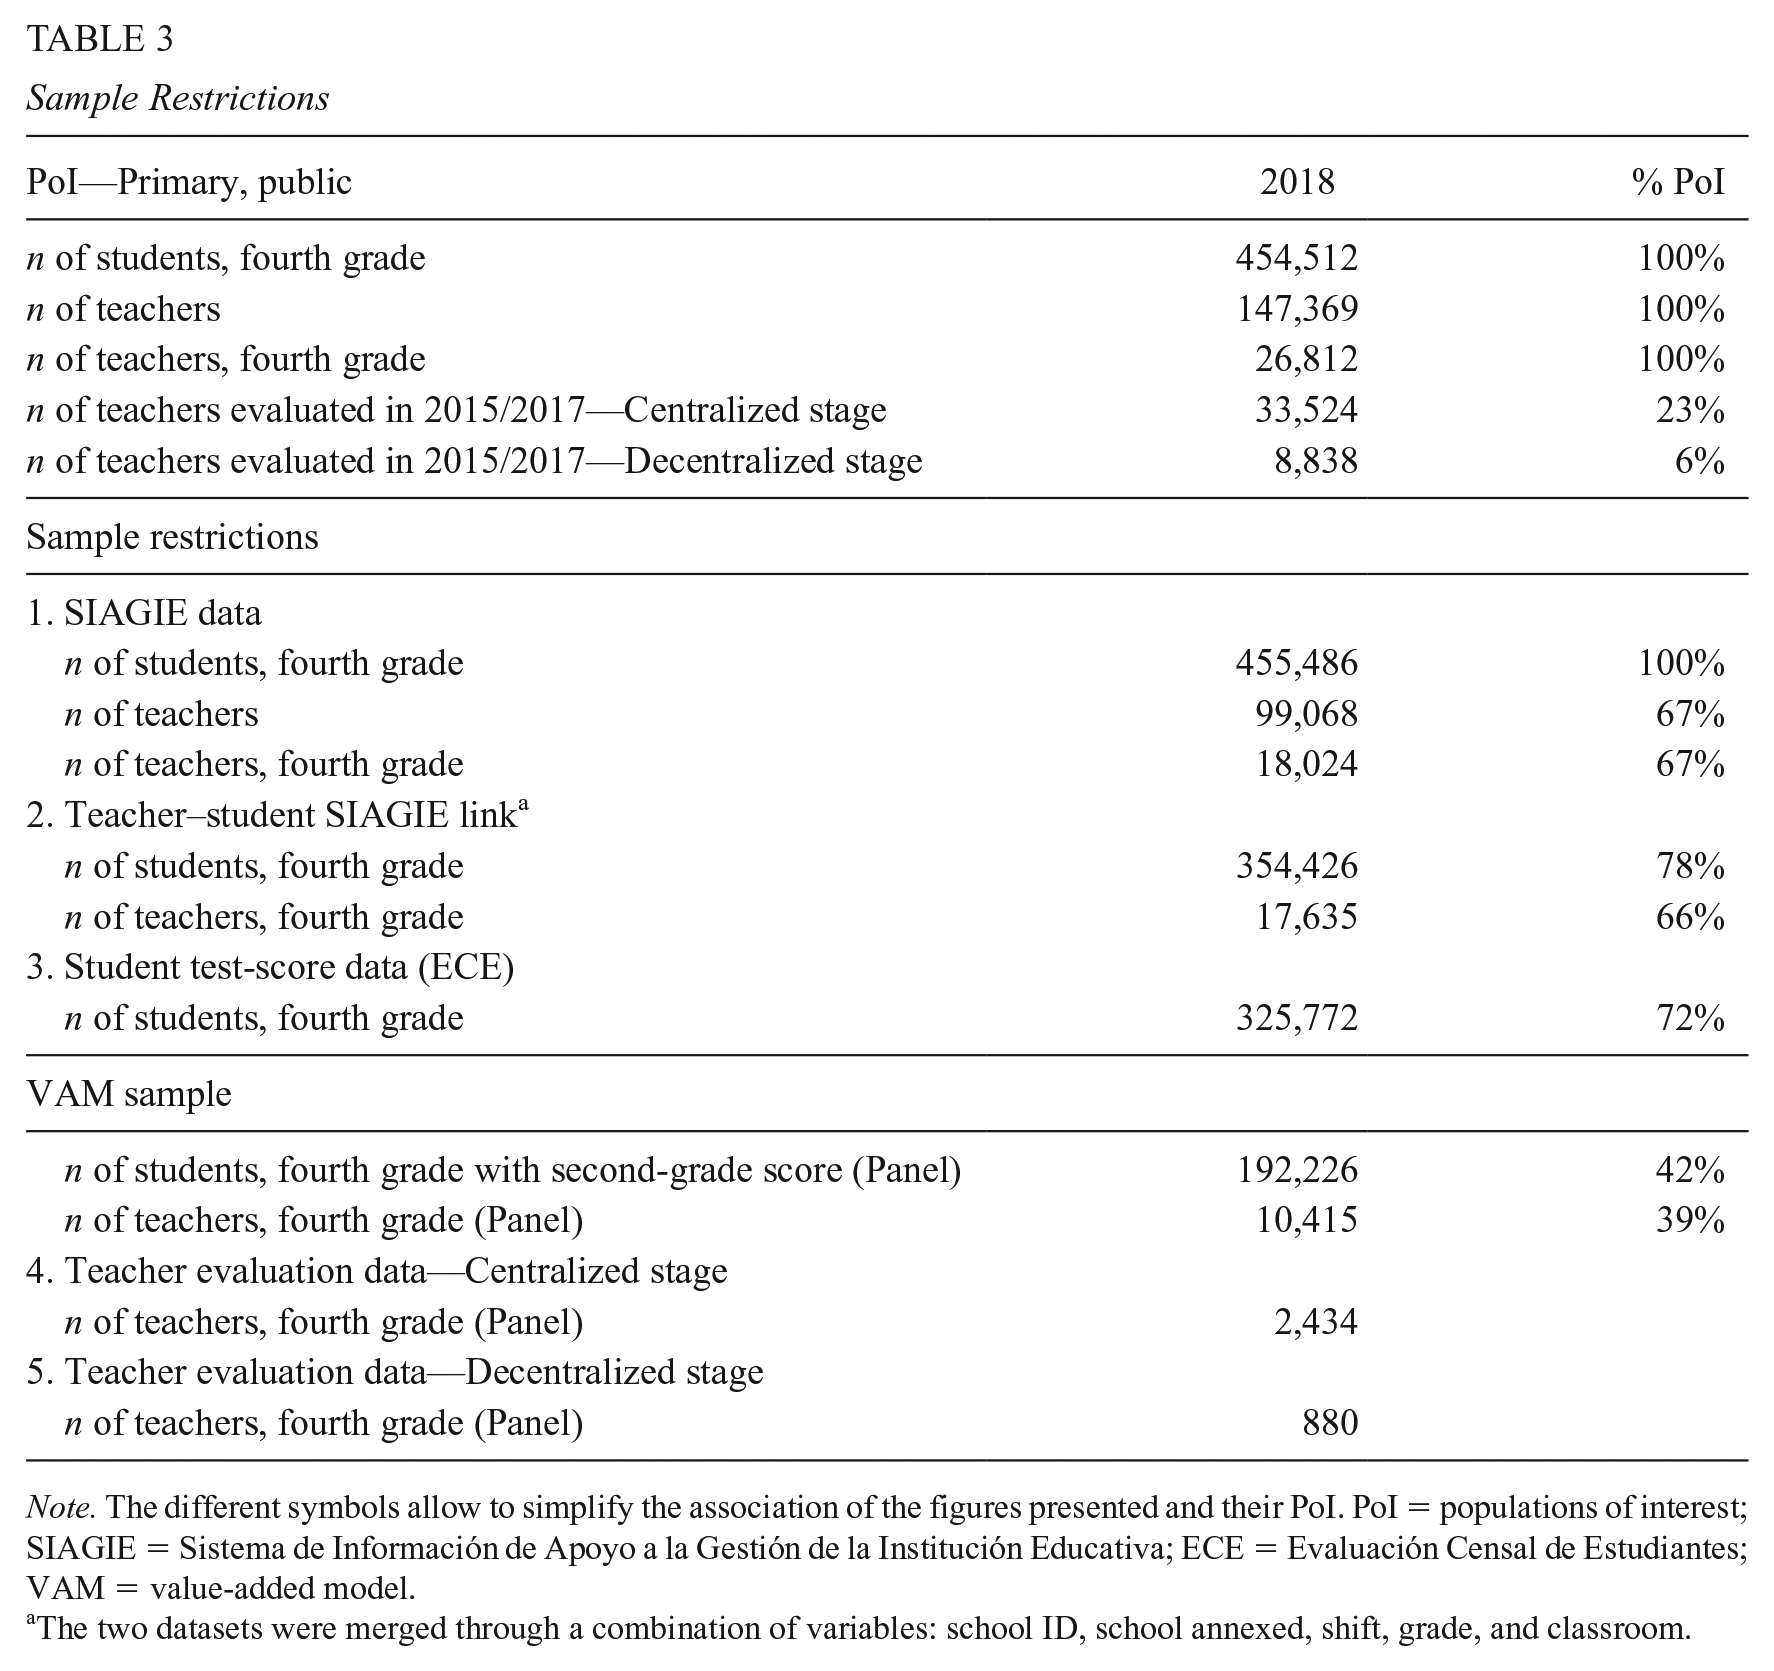
Note. The different symbols allow to simplify the association of the figures presented and their PoI. PoI = populations of interest; SIAGIE = Sistema de Información de Apoyo a la Gestión de la Institución Educativa; ECE = Evaluación Censal de Estudiantes; VAM = value-added model.
The two datasets were merged through a combination of variables: school ID, school annexed, shift, grade, and classroom.
First, use of the SIAGIE data restricts the population of fourth-grade primary teachers by around 33%, while the population of fourth-grade primary students is quite similar (the upward difference of around 1% could be due to grade miscoding). Second, the teacher–student link restricts the sample of students by 22% and that of teachers by an additional 1%. Third, given the restrictions imposed by use of the SIAGIE data, a panel dataset of second- and fourth-grade student test scores (necessary to estimate the lagged-score TVA) is ultimately available for 42% of fourth-grade primary students. This could be due to reasons such as movement of students across schools, repetition and/or dropout rates, as well as inconsistencies in the student ID variable between the SIAGIE and the ECE dataset. The availability of the student panel restricts, in turn, the sample of fourth-grade primary teachers by an additional 28%. Last, we look at sample restrictions imposed by use of the 2015 and 2017 teacher evaluation data. As Table 3 shows, around 23% of the instructors teaching in 2018 participated in the teacher evaluation in 2015 and/or 2017, and 6% of those made it to the second, decentralized stage. Once restrictions as mentioned in Equations 1 to 3 are applied to our data, out of the sample of 10,415 fourth-grade primary teachers for whom we can estimate TVA, it is possible to recover centralized and decentralized teacher evaluation data for 23% (2,434) and 8% (880) of those, respectively.
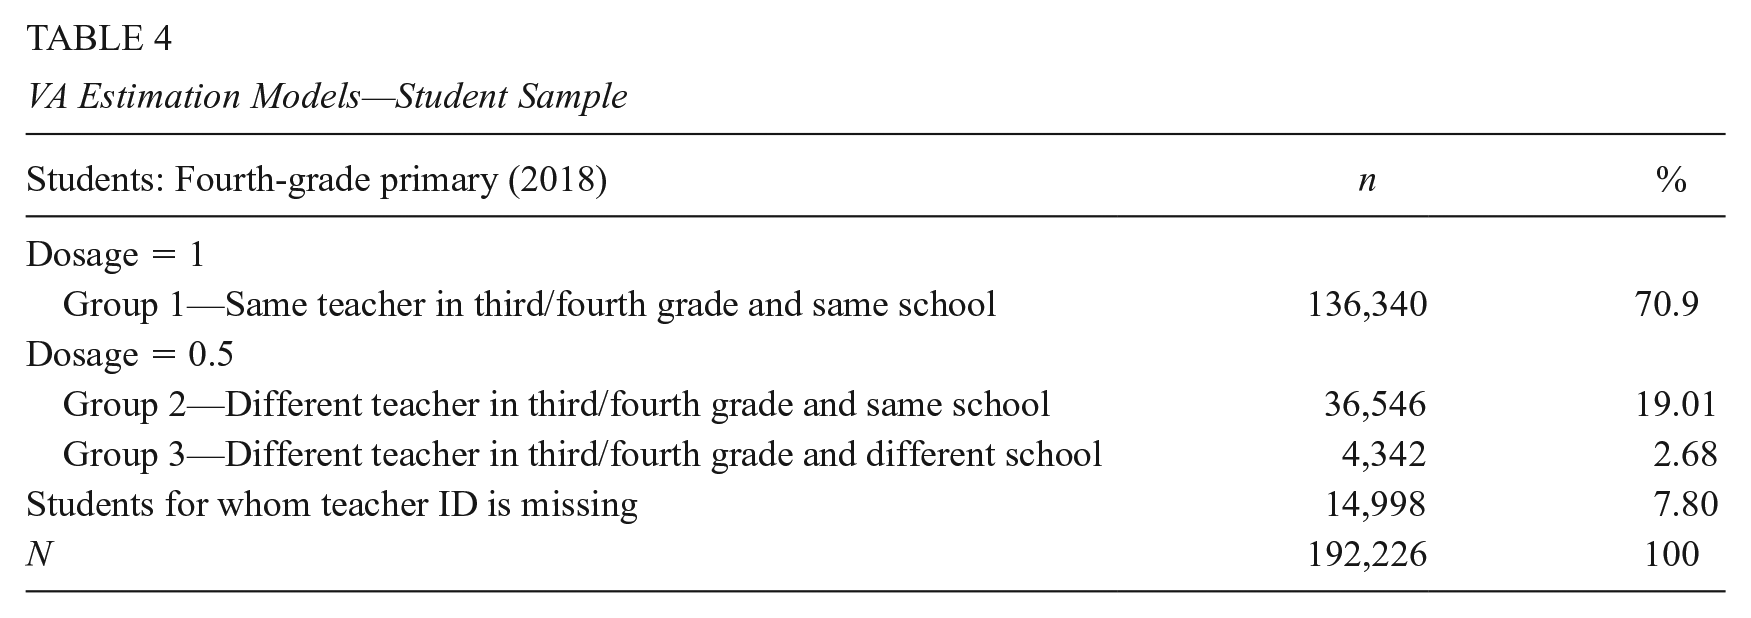
Table 4 presents descriptive statistics of the 192,226 students in the panel for whom we estimate the VAM. The first subsample includes the 71% of students in the ECE panel who had the same teacher (for math or reading) in third and fourth grade of primary and who remained in the same school (Group 1). The second sample (henceforth, “full sample”) includes the full sample of students in the ECE panel which, in addition to Group 1, also includes the 22% of students who had a different teacher between third and fourth grade and/or changed schools between the 2 years (Group 2 and Group 3). We could not recover the teachers’ ID for 8% of the students; they are thus excluded from the estimation. The latter case justifies the inclusion of school characteristics in the TVA measure to control for changes in students’ test scores influenced by the move to a different school. Supplementary Appendix Table A2 (in the online version of the journal) presents a test of the differences between the two samples of students. Overall, the differences are considerably small between the two groups. Interestingly, the fact that the socioeconomic level of the students is not statistically different between the two groups suggests that the decision to change schools (or classrooms) is not related to the student’s SES. Given these data limitations and sample restrictions, we check for sample selection issues to avoid biased TVA estimates. Results are presented in the Supplementary Appendix B (in the online version of the journal).
VA Estimation Models—Student Sample
Descriptive Statistics
Supplementary Appendix Tables A9 and A10 in the online version of the journal report descriptive statistics of the variables used in the VA estimation models for math and reading, respectively. In the full sample of students, the average fourth-grade student scores 5.42 SD in math and 5.40 SD in reading (corresponding to the “In progress” ECE achievement level 9 ), and above 5.52 SD (corresponding to the “Satisfactory” level) in second grade in both subjects. Of the 24% of students categorized as high SES (i.e., those whose mother completed a secondary education), 73% performed at the “Expected achievement” level in terms of their second-grade scores on math and reading. Meanwhile, 4% of students attend school in rural areas and the average number of students per school is around 600 students.
Supplementary Appendix Table A11 in the online version of the journal presents descriptive statistics for the model variables used to estimate Equation 4 and mean differences between teachers in the restricted sample (teachers who remain for third to fourth grade) and in the full sample. On average, in 2018, in both samples, 75% of the teachers included in the estimation are female, while 14% (17%) have a temporary contract in the restricted (full) sample. More than 60% of the teachers are concentrated in the two lowest salary levels. Although in Peru, the teacher salary scale is divided into eight levels, less than 2% of the country’s teachers are found in the two highest levels (seventh and eighth), and none in our sample. Examining at the differences between teacher characteristics in the two samples, teachers in the full sample are slightly older, more likely to have a temporary contract, and more concentrated in the lowest salary levels.
Main Results
TVA Model
Tables 5 and 6 show the results of the TVA estimation
TVA Estimation Regression Results—Math
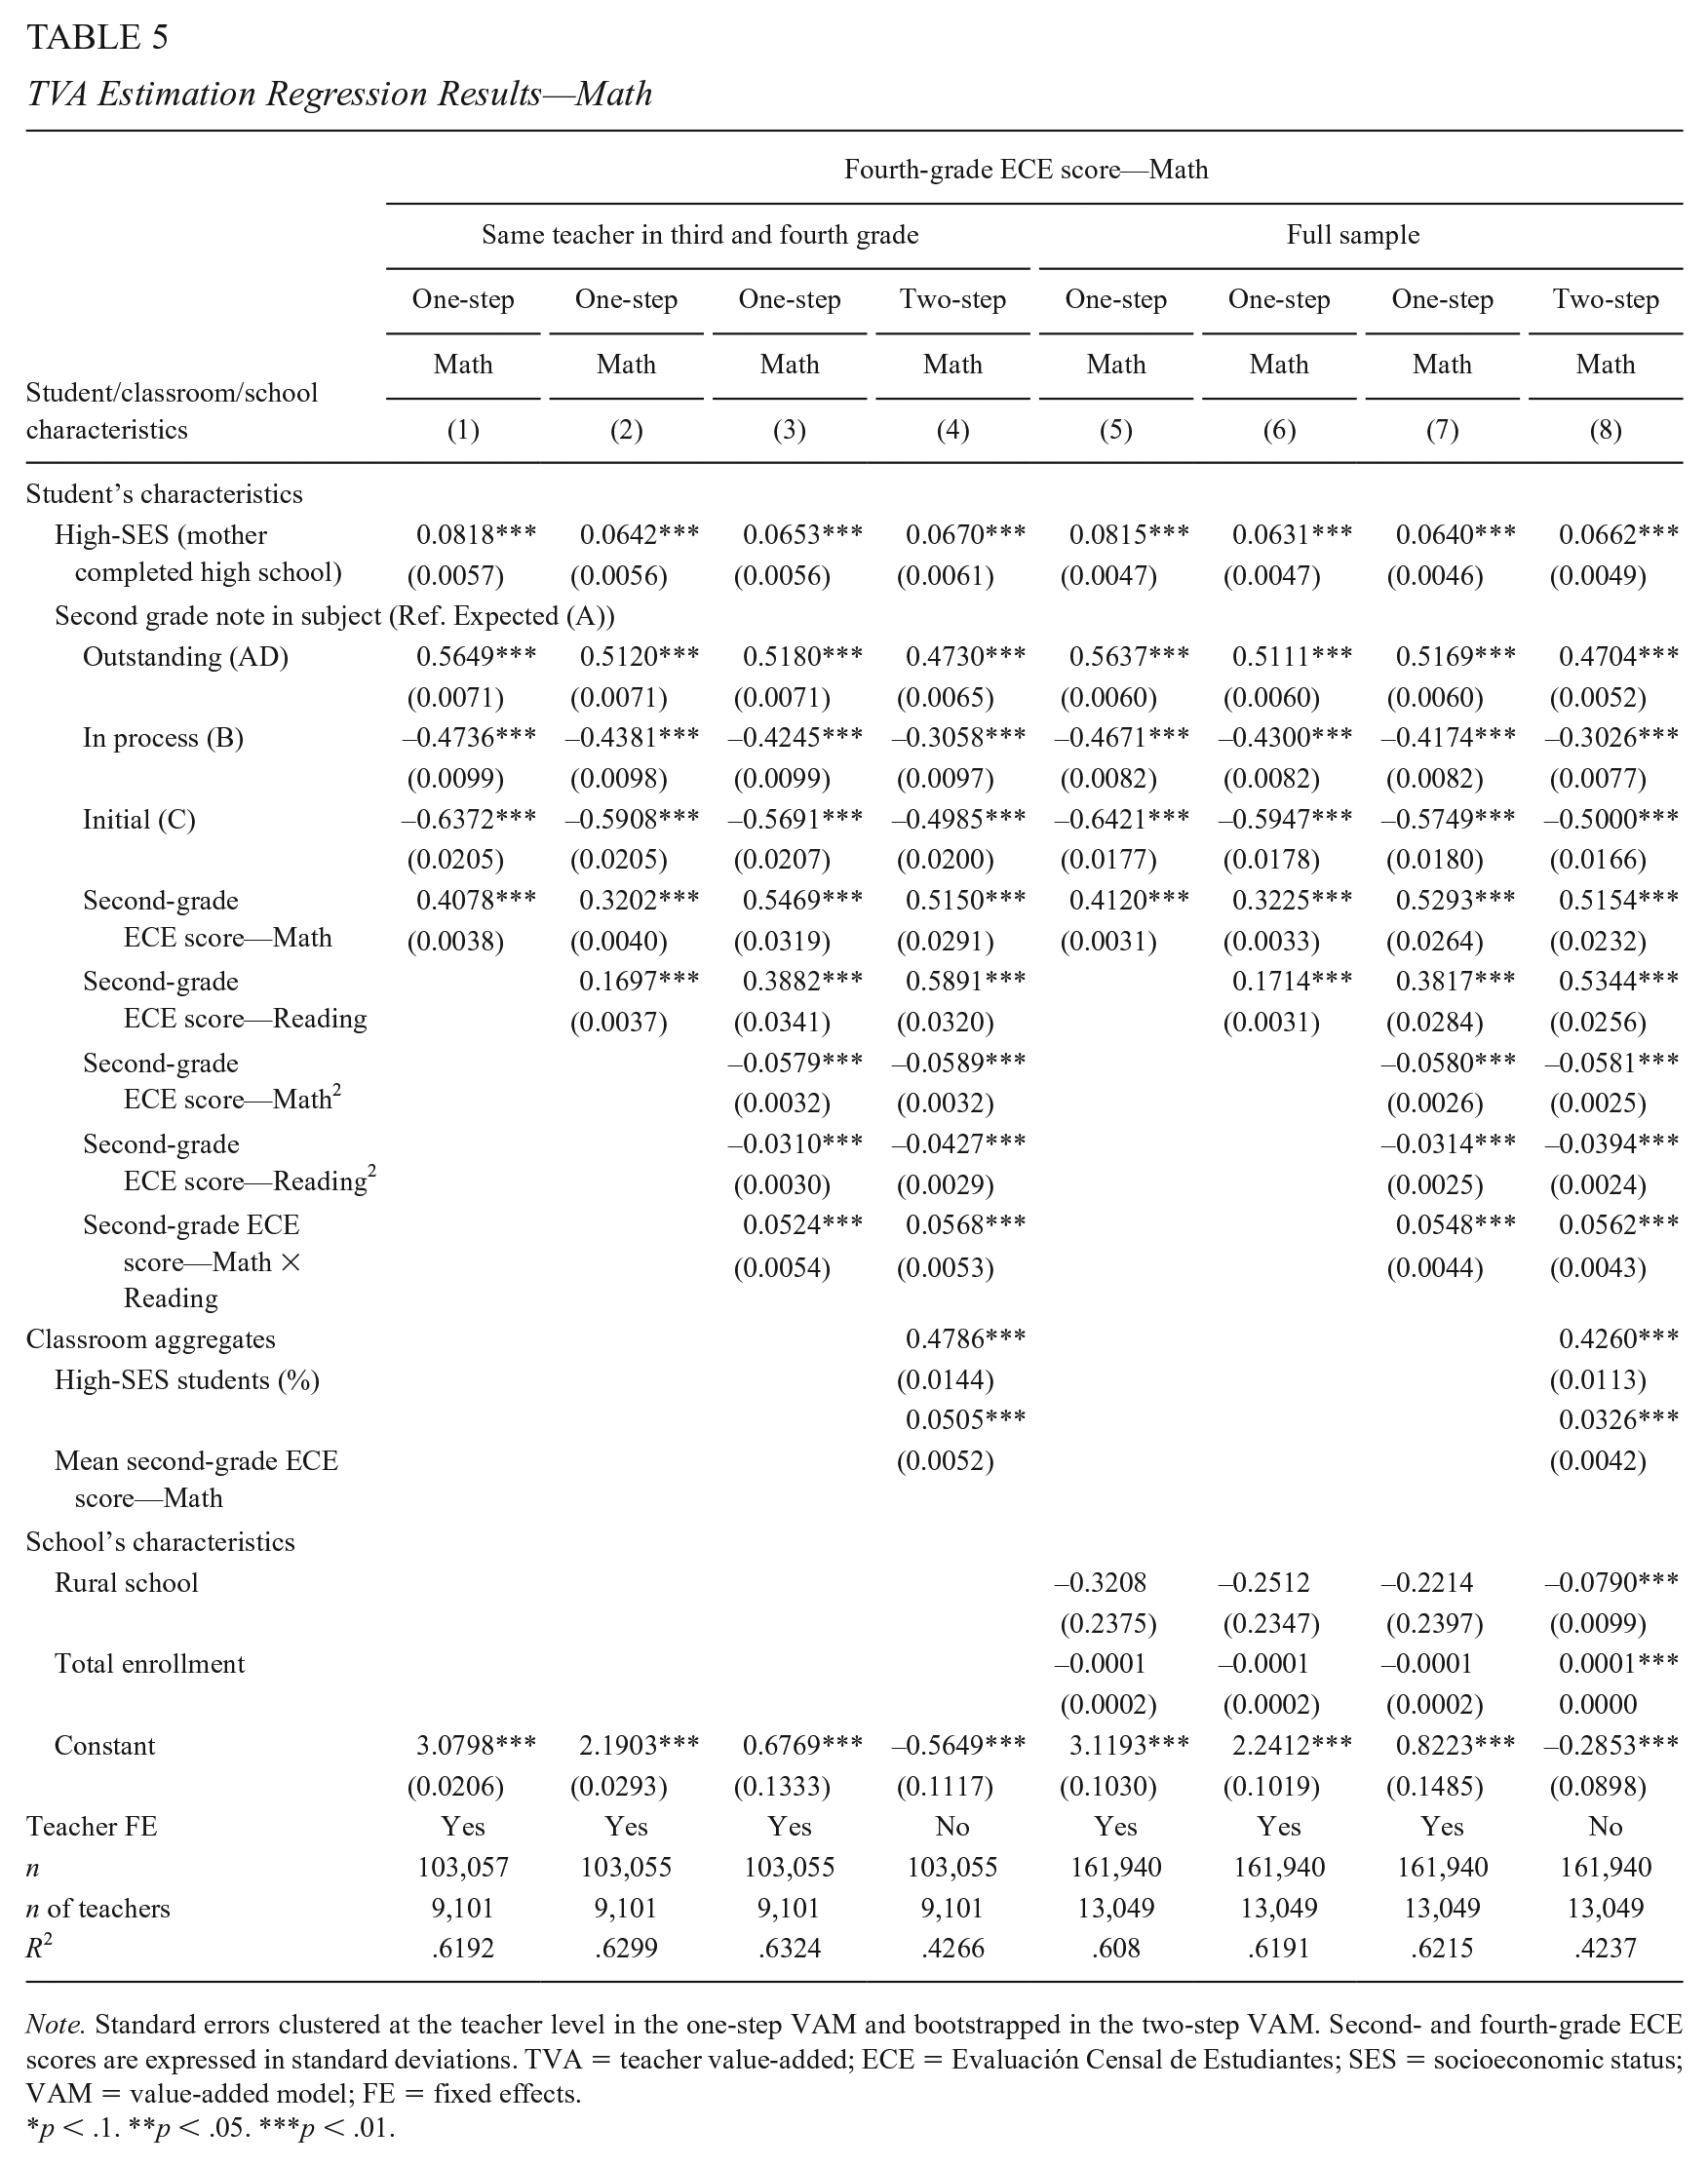
Note. Standard errors clustered at the teacher level in the one-step VAM and bootstrapped in the two-step VAM. Second- and fourth-grade ECE scores are expressed in standard deviations. TVA = teacher value-added; ECE = Evaluación Censal de Estudiantes; SES = socioeconomic status; VAM = value-added model; FE = fixed effects.
p < .1. **p < .05. ***p < .01.
TVA Estimation Regression Results—Reading
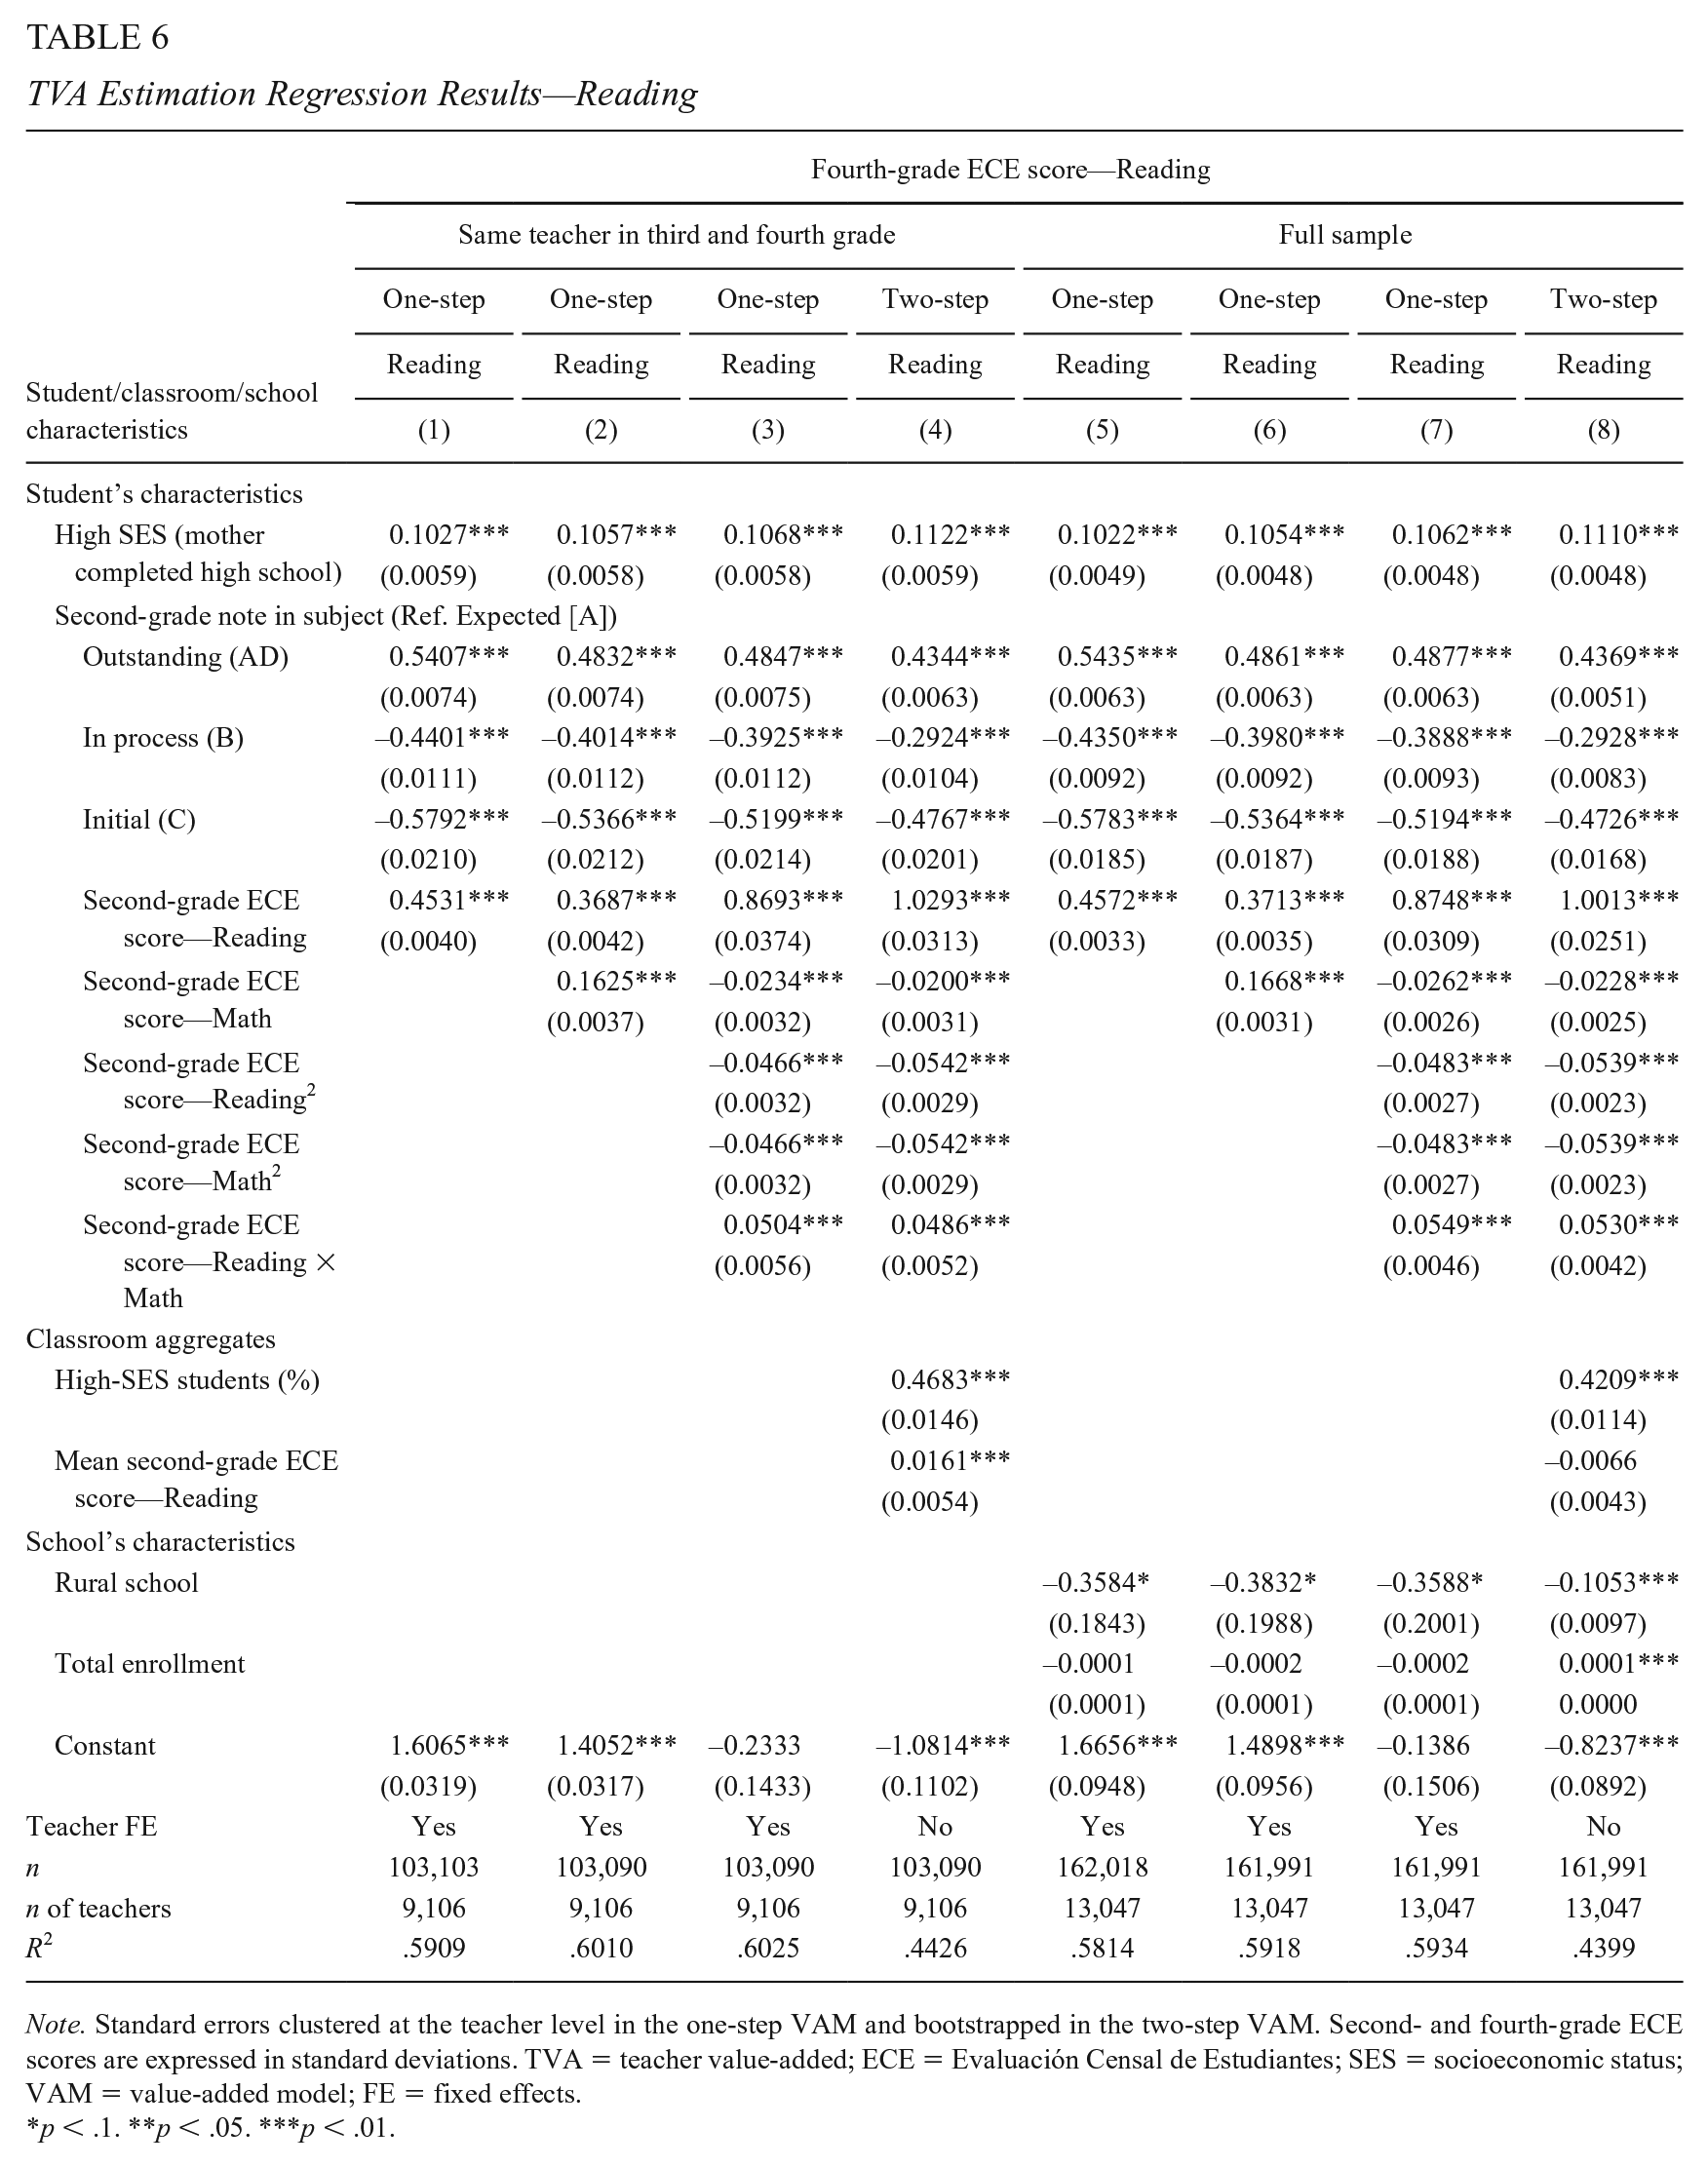
Note. Standard errors clustered at the teacher level in the one-step VAM and bootstrapped in the two-step VAM. Second- and fourth-grade ECE scores are expressed in standard deviations. TVA = teacher value-added; ECE = Evaluación Censal de Estudiantes; SES = socioeconomic status; VAM = value-added model; FE = fixed effects.
p < .1. **p < .05. ***p < .01.
Table 5 shows the TVA estimation regression results for math. Students’ SES is positively correlated with the fourth-grade ECE math score in all specifications, an effect ranging between 0.06 and 0.08 standard deviations (SDs). Students scoring in the highest category in this subject on their second-grade evaluation (“Expected” being the reference category) then score between 0.47 and 0.56 SD higher on their fourth-grade ECE, while students in the lowest category score between 0.50 and 0.64 SD lower. 11 The most important control in this model is the student lagged ECE scores. When we include only the lagged score in the same subject, we find that the fourth-grade math score increases by around 0.41 SD for each additional SD in the second-grade score (Columns 1 and 5). When the second-grade reading score is included (Columns 2–4 and Columns 6–8), the effect on math is reduced to 0.32 SD, and the second-grade reading score increases the fourth-grade math score by about 0.17 SD. This suggests that reading skills positively influence math skills. In addition, when nonlinearities are included, we find that the impact of second-grade scores is positive and decreasing; the positive interaction effect implies that a student with a high score in both subjects has an additional positive effect on the fourth-grade score. The findings are robust to the two-step VAM estimation (Columns 4 and 8) and show positive relationships of classroom characteristics with students’ ECE score. Finally, we include controls at the school level (Column 8): Attending a rural school has a negative effect on fourth-grade scores while the effect of school size does not seem robust to the different specifications. Table 6 shows the same set of results for reading. While the findings are slightly different in terms of magnitude, the interpretation is similar as that for the math results.
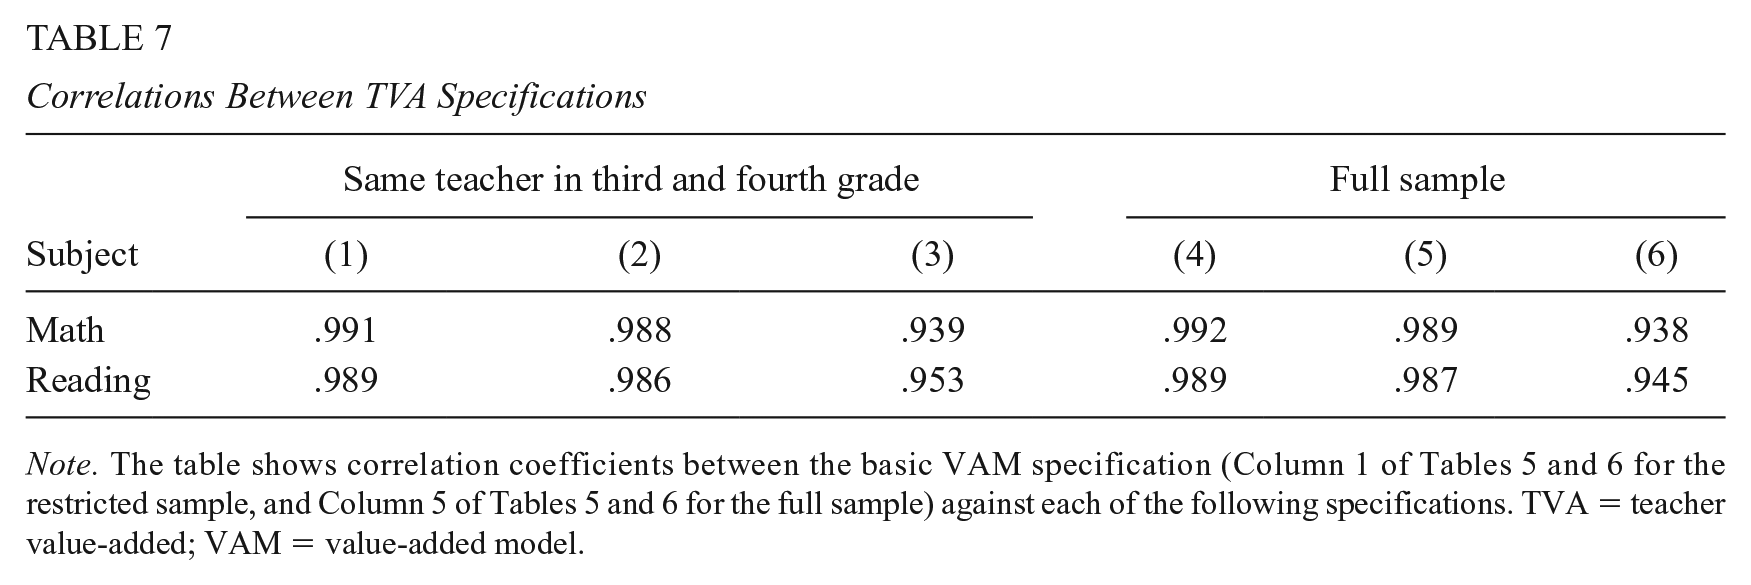
To check the stability of our TVA measures, in Table 7, we present correlations between the results of the models estimated in Tables 5 and 6. Table 7 shows that the TVA measures we estimate are highly correlated across all of the different specifications, which suggests that the different models have a low significant impact on the ranking of teachers according to the estimated VA measure. Also, we implement two additional exercises to compare the quintiles in which teachers are classified using the different specifications to estimate the TVA and the two samples. The results, presented in the Supplementary Appendix C (in the online version of the journal), show that the TVA measurements remain stable, especially in the lowest and highest quintiles.
Correlations Between TVA Specifications
Finally, we perform two robustness checks. First, we run Equation 1 over the sample of instructors who teach a class with at least five students, or the minimum number of students per classroom for the ECE evaluation to be implemented, and second, over the sample of urban schools. Results of this exercise, presented in the Supplementary Appendix D (in the online version of the journal), show that findings are robust to these sample restrictions.
Teacher Characteristics and TVA
Table 8 shows the relationship between mean TVA and teacher characteristics. 12 Consistent with Tanaka et al.’s (2020) results for Japan, we find that female teachers tend to have higher VA than male teachers. Specifically, female teachers have a VA that is 0.05 to 0.1 SD higher than male teachers. Meanwhile, TVA appears to be 0.04 to 0.06 SD lower for teachers with a temporary contract than those with a permanent position. In Peru, temporary teachers and those who begin their careers through the teacher hiring process receive a salary corresponding to the first (lowest) level. This result is different from that reported by Bau and Das (2020) for the case of Pakistan. The authors find that teachers entering on temporary contracts with 35% lower wages have similar distributions of TVA to the permanent teaching workforce. Some empirical evidence suggests that temporary teachers apply higher levels of effort and can have a positive impact on student achievement when faced with performance incentives for contract renewal (e.g., Duflo et al., 2015; Muralidharan & Sundararaman, 2013). However, when temporary contracts are not subject to accountability mechanisms, temporary teachers are found to have a negative influence on test scores, particularly for low-income students (Marotta, 2019). The latter may be the case in Peru, where teachers with temporary contracts are hired for vacancies not filled in the teacher evaluation, without transparent and objective selection criteria (Bertoni et al., 2021). Finally, we observe a positive, although not robust, relationship between TVA and salary scale, with higher TVA for teachers at higher salary levels. This can be related to the design of the teacher salary scale in Peru, where teachers may ascend through public evaluations after having spent the mandatory time of service in each previous scale (Bertoni et al., 2018).
Relationship Between Mean TVA and Teacher Characteristics
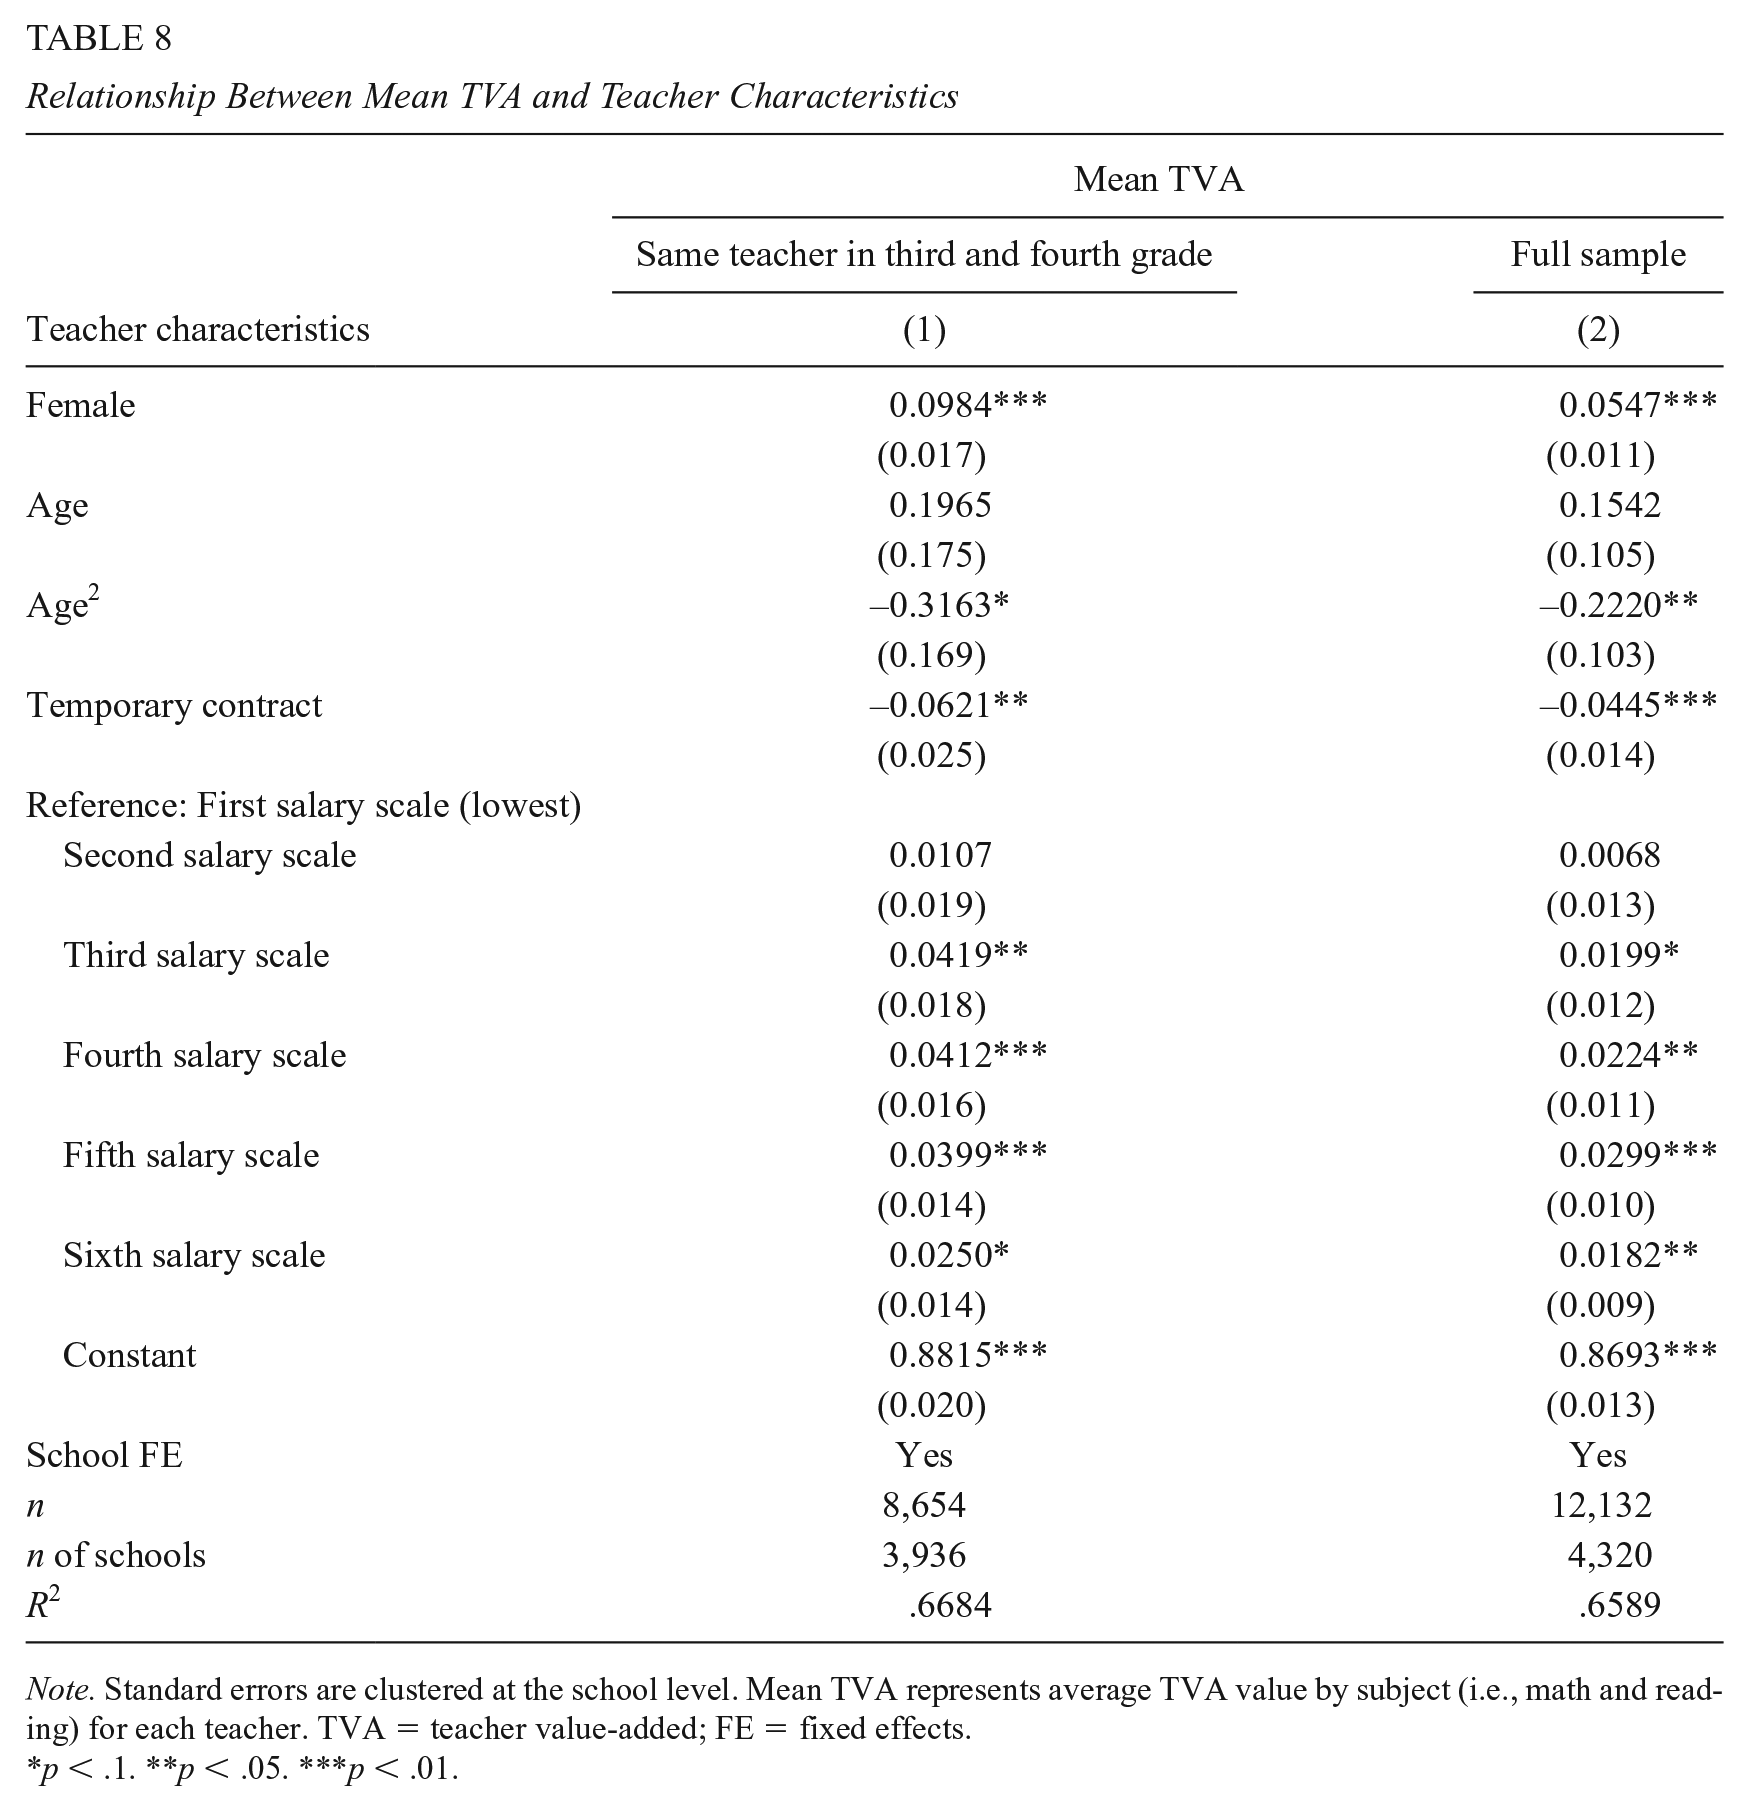
Note. Standard errors are clustered at the school level. Mean TVA represents average TVA value by subject (i.e., math and reading) for each teacher. TVA = teacher value-added; FE = fixed effects.
p < .1. **p < .05. ***p < .01.
Relationships Between TVA and Teacher Evaluation Instruments
Supplementary Appendix Table A14 in the online version of the journal presents the descriptive statistics of the instruments used in the centralized and decentralized stages (standardized) for the sample of teachers used in the estimations. Tables 9 and 10 show the coefficients of a regression between estimated TVA and the different teacher evaluation instruments for math and reading, respectively, both standardized to have a mean of 0 and a SD of 1. We run these regressions for TVA measures estimated with Models (3) and (4) of Table 5 (math) and Table 6 (reading) for the restricted sample of students and Models (7) and (8) of the same tables for the full sample of students. We present results for nonadjusted and selection-adjusted coefficients, where the latter were estimated as explained in the “Method” section. The coefficients from the nonadjusted models are equal to the correlation coefficient because they are estimated from a univariate regression using standardized variables.
Coefficients From a Regression Between TVA Measures and Teacher Evaluation Instruments—Math
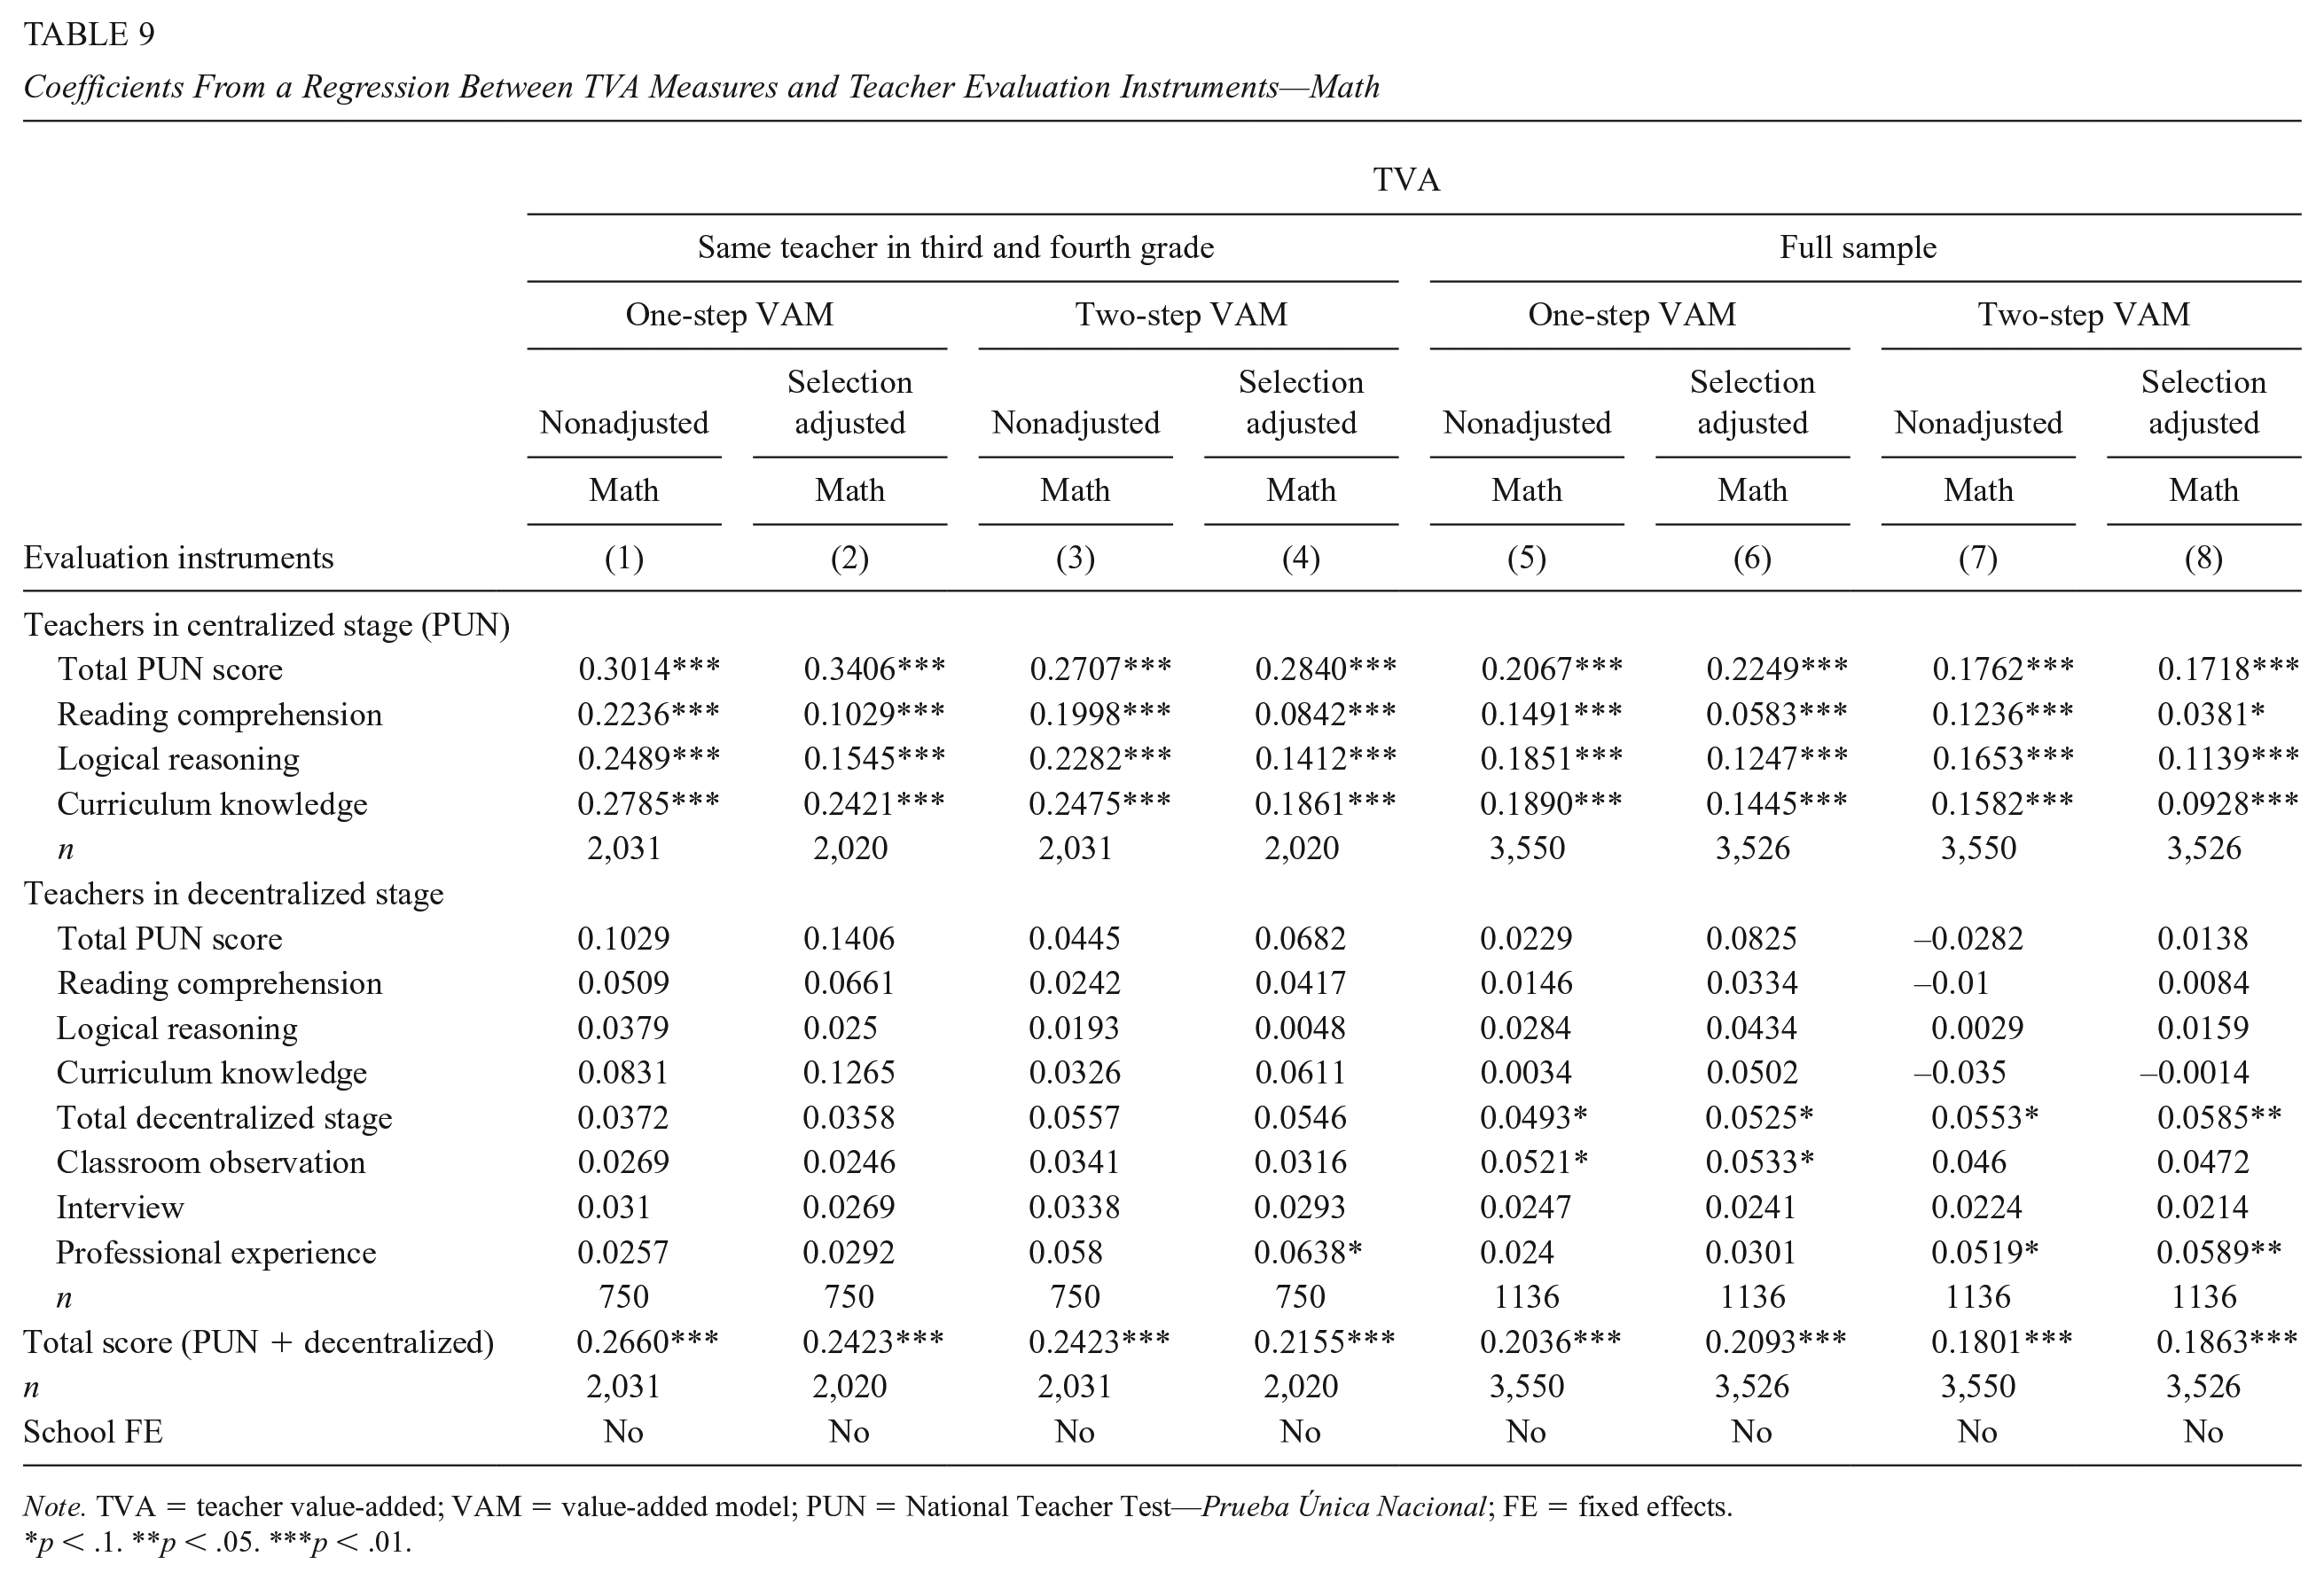
Note. TVA = teacher value-added; VAM = value-added model; PUN = National Teacher Test—Prueba Única Nacional; FE = fixed effects.
< .1. **p < .05. ***p < .01.
Coefficients From a Regression Between TVA Measures and Teacher Evaluation Instruments—Reading
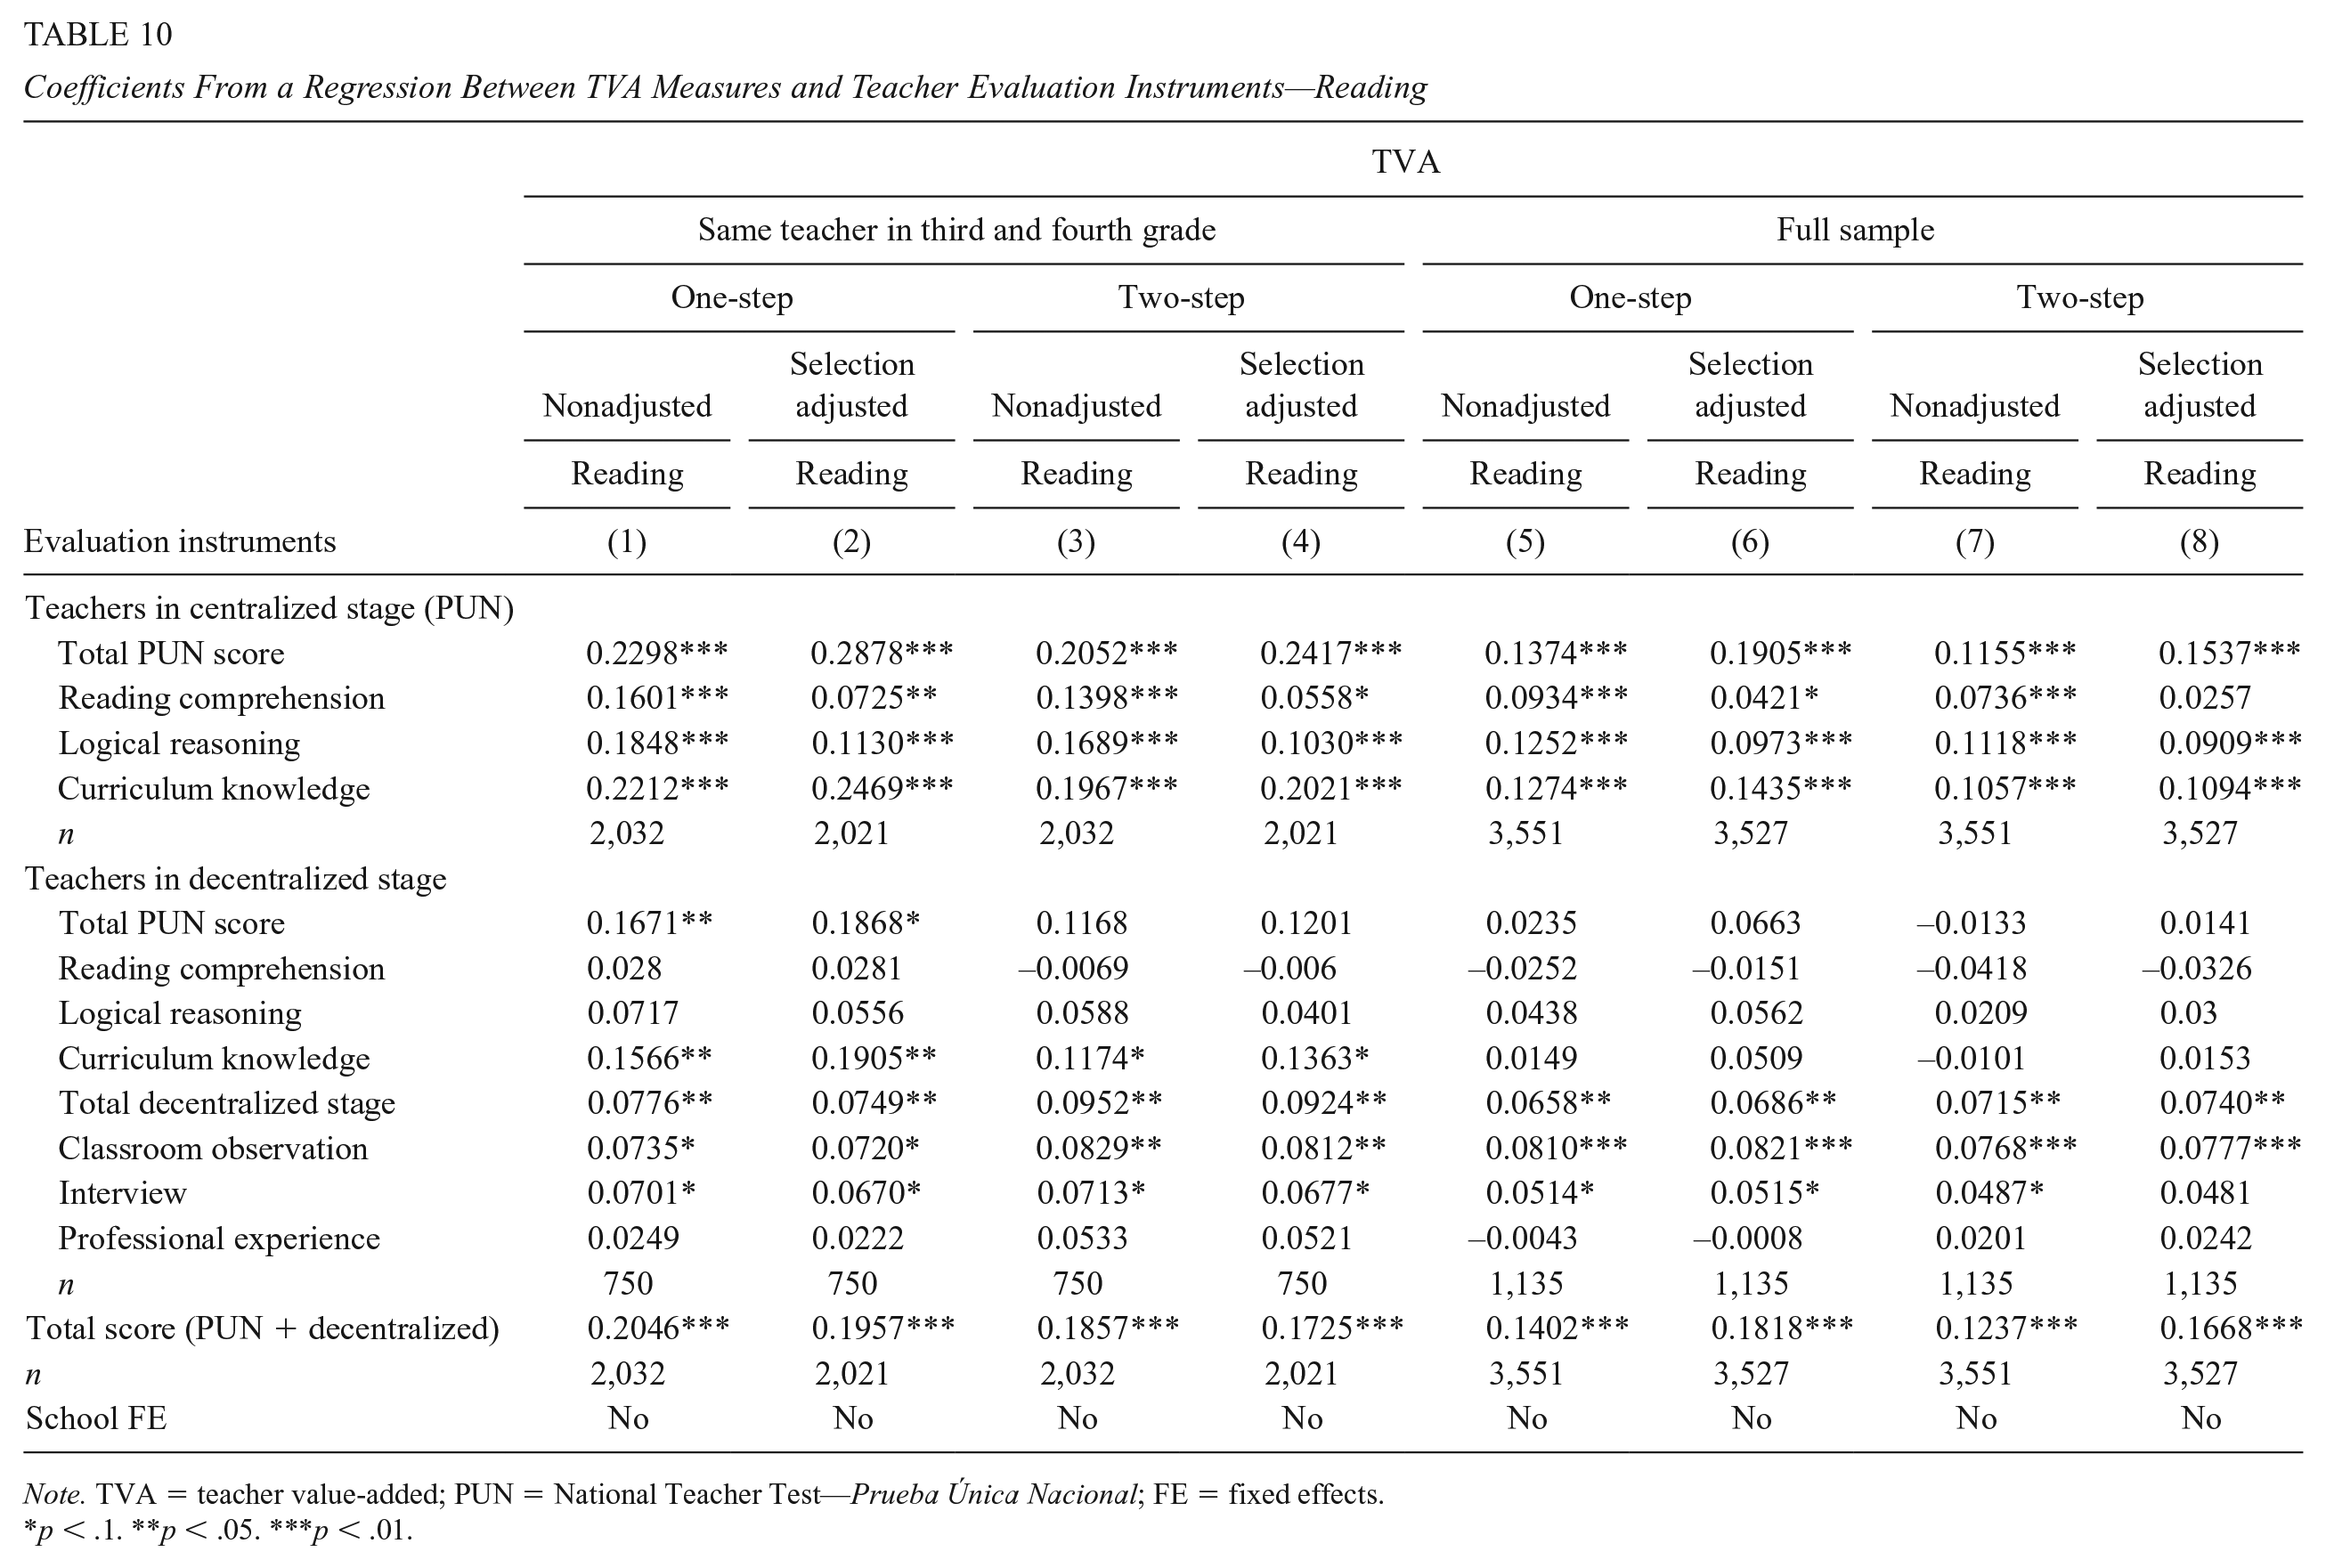
Note. TVA = teacher value-added; PUN = National Teacher Test—Prueba Única Nacional; FE = fixed effects.
< .1. **p < .05. ***p < .01.
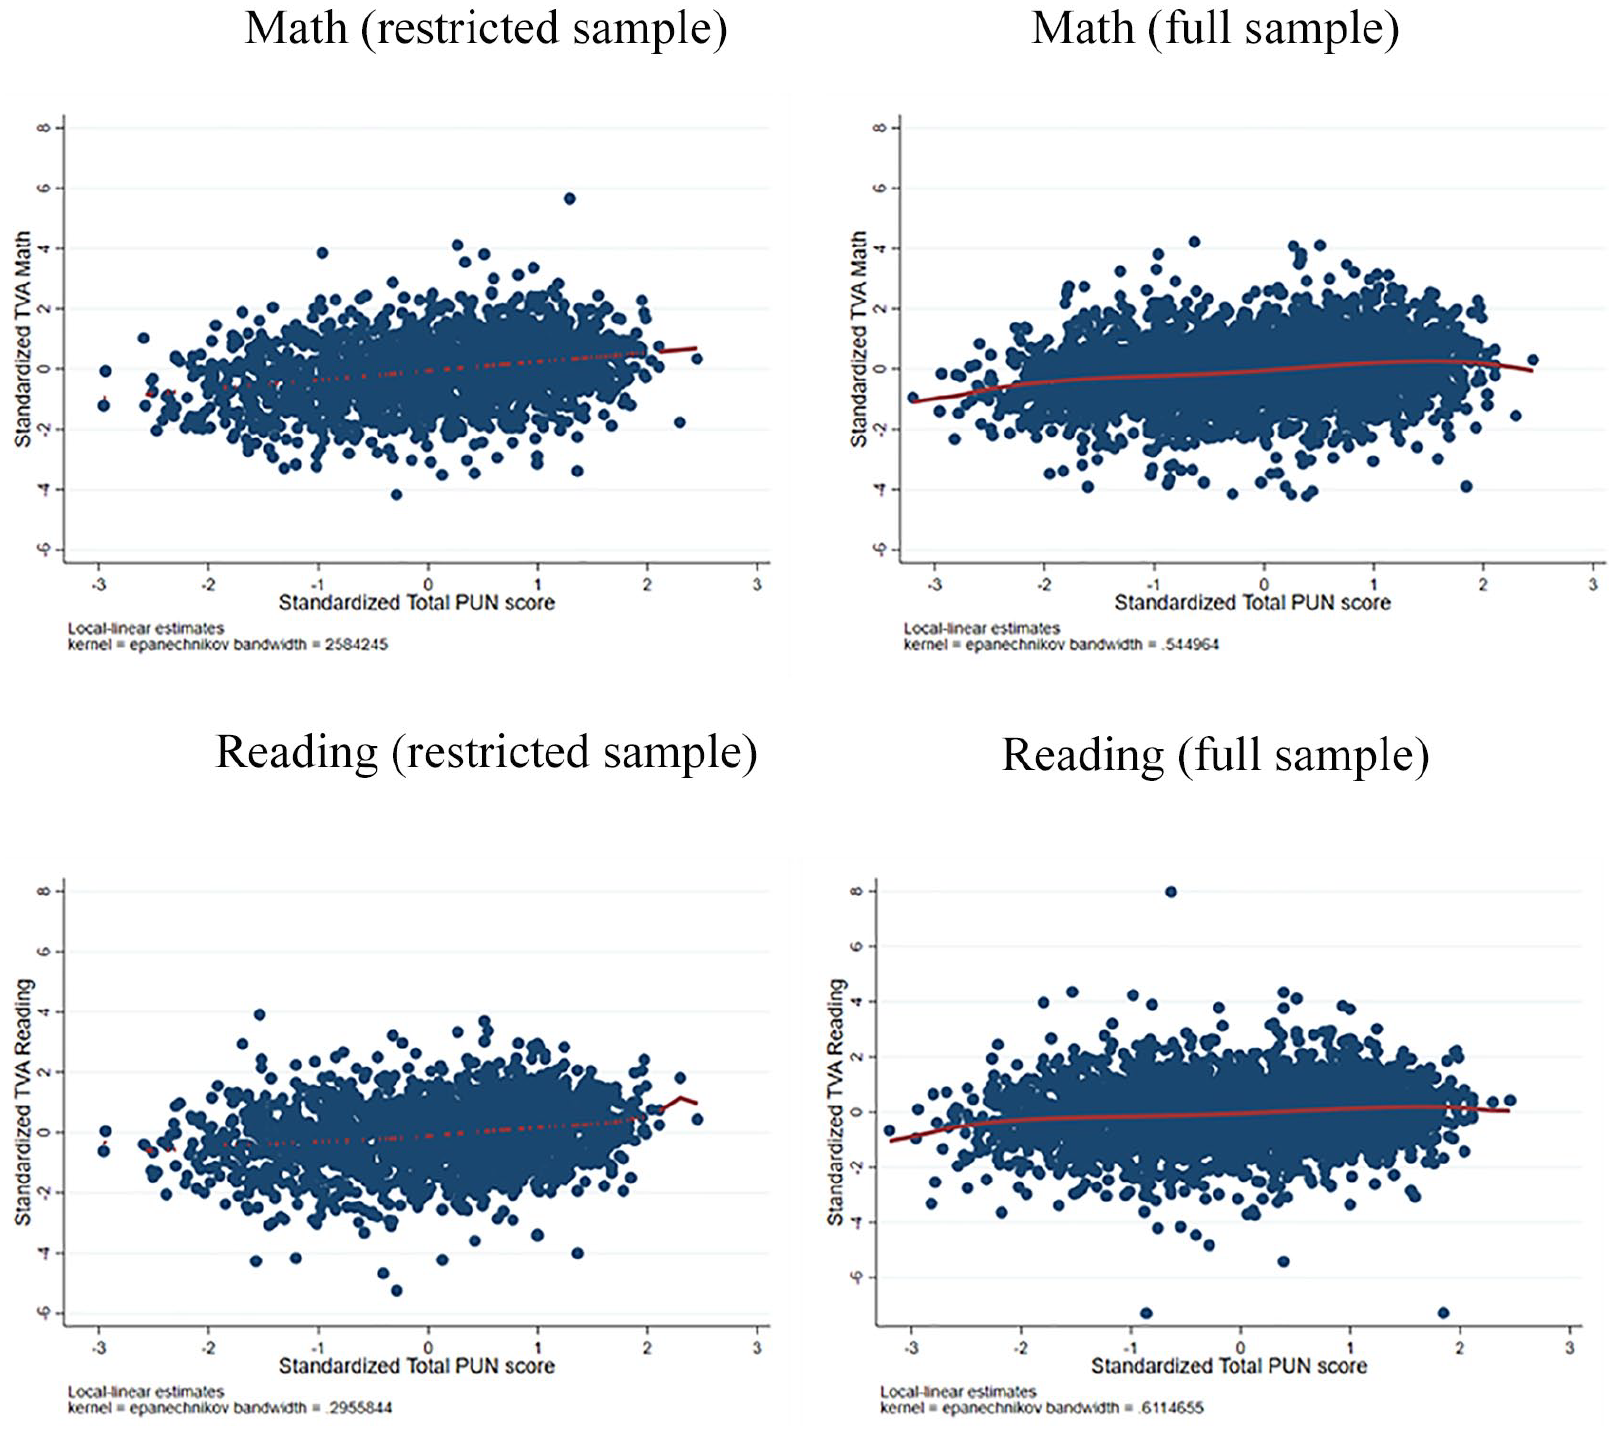
Overall, among the centralized stage instruments, the logical reasoning (0.09–0.25) and the curriculum knowledge (0.09–0.28) subtest presents the highest relationship with our different estimated TVA measures. The reading comprehension subtest shows the lowest relationship with TVA (0.04–0.22) in all specifications and for both subjects—not surprising given that this instrument is simply testing whether the teacher can read and comprehend a text in her own language. Moreover, the weighted average of the three PUN subtests has a higher predictive power than the single subtests, suggesting that the weighted combination of the different instruments possibly increases the ability to predict the added value of a teacher. For math specifically, the relationship between TVA and the total PUN score varies between 0.17 and 0.34, depending on the specification and the sample used. This magnitude is similar to that found in Chile by Taut et al. (2016), where the authors find significant correlations between 0.18 and 0.20 in math for the written instrument of the teacher evaluation. For reading, the relationship varies between 0.12 and 0.29. Figure 4 illustrates the relationship between teacher evaluation instruments and value-added measures 13
Relationship between teacher evaluation instruments and value-added measures.
When run over the full sample of students, the regression coefficients appear to be lower. This could be due to the inclusion of a higher proportion of temporary teachers or schools with lower teacher retention rates. Once we correct for the bias due to nonrandom selection into teaching, the relationship between TVA and the aggregate PUN score increases slightly. This may be due to inclusion of applicants who received lower PUN scores on the three instruments (Figure 2) and nonobservable characteristics making the pool of candidates more heterogeneous. Among the three instruments, the reading comprehension coefficients drop significantly once we correct for selection into teaching, suggesting that the predictive power of this instrument is specific to a more homogeneous group of candidates. The logical reasoning coefficients also decrease when correcting for selection bias but by a much smaller amount. On the contrary, coefficients of the curriculum knowledge instrument increase slightly when selection bias is taken into account, and is likely what drives the effect of the aggregate PUN score.
Moreover, we find no significant relationships between the decentralized stage instruments and our measures of TVA for math. For reading, we find a positive and significant relationship between the classroom observation (0.07–0.08) and interview (0.05–0.07) components and TVA. For the United States, Kane and Staiger (2012) report that the correlation between math TVA and score on the classroom observation (measured across different classrooms) ranges from 0.16 to 0.26, depending on the observation rubric. However, they find higher correlations with other instruments, such as the teacher’s portfolio (0.24–0.31) and video-taped lessons (0.20–0.24). Although not directly comparable with the decentralized stage in Peru, other studies for the United States analyze a decentralized evaluation instrument in the form of school principal assessments. For example, Jacob and Lefgren (2008) report a correlation of .32 between estimates of TVA in math and ratings based on principals’ beliefs about the ability of teachers to raise math achievement. The analogous correlation for reading is .29 (correlations are reported after adjusting for estimation error in the VA measures). Meanwhile, Harris and Sass (2014) report slightly larger correlations for the same principal assessment—.41 for math and .44 for reading—as well as correlate VA with “overall” principal ratings, documenting correlations in math and reading of .34 and .38, respectively.
It is important to stress that in the case of Peru, the decentralized stage evaluations are only taken up by the teachers who passed the PUN (the passing rate of the PUN has been consistently low in all of the teacher selection years: 13% in 2015, 11% in 2017, 12% in 2018, and 7% in 2019). This means that the sample of teachers at the decentralized stage is much smaller and more homogeneous, possibly affecting predictive power and comparability with other studies based on hiring systems where all the instruments are applied to the full set of applicants (e.g., Bertoni et al., 2020). Indeed, we observe that for the group of teachers who pass to the second stage, the PUN is no longer predictive. This suggests that the homogeneity of the pool of candidates can affect the predictive power of the evaluation instruments at both the centralized and decentralized stages. In addition, although its implementation should follow ministerial guidelines, the decentralized stage of the teacher recruitment in Peru is a more arbitrary process than the centralized stage. The dynamics of the classroom observation leave, for example, room for subjective assessment. Moreover, schools have the freedom to tailor the content of the interview to their specific needs, making it more difficult to preserve an entirely objective outcome of the evaluation.
To test for the possibility that the relationships between our TVA measures and teacher evaluation instruments are explained by the sorting of teachers into schools (i.e., that the most effective teachers teach in schools with better attributes), we reestimated the specifications in Tables 9 and 10 including fixed effects at the school level. The results of this exercise are presented in Tables 11 and 12. The main conclusions presented above hold: The logical reasoning and curriculum knowledge instruments show the highest relationships, reading comprehension instrument shows the lowest relationship, and total PUN score has a higher predictive power than the single subtests. However, coefficients’ magnitudes are reduced. For example, in math, the relationship between TVA and the total PUN score varies between 0.06 and 0.23, depending on the specification and the sample used. For reading, coefficients range between 0.05 and 0.20. Also, in some specifications, the relationship between TVA and reading comprehension/local reasoning instruments become statistically not-significant in the selection-adjusted model. Similar to the model without school fixed effect, no statistically significant coefficients are observed between the TVA and the instruments of the decentralized stage for math teachers. However, when adding school fixed effects, the classroom observation instrument is also not related to the VA measure of reading. These results suggest that a fraction of the relationship between TVA and the evaluation instruments could be explained by teacher sorting, which is to be expected given that the design of the teacher contest in Peru gives candidates with higher PUN priority in the selection of the vacancies.
Coefficients From a Regression Between TVA Measures and Teacher Evaluation Instruments With School FE—Math
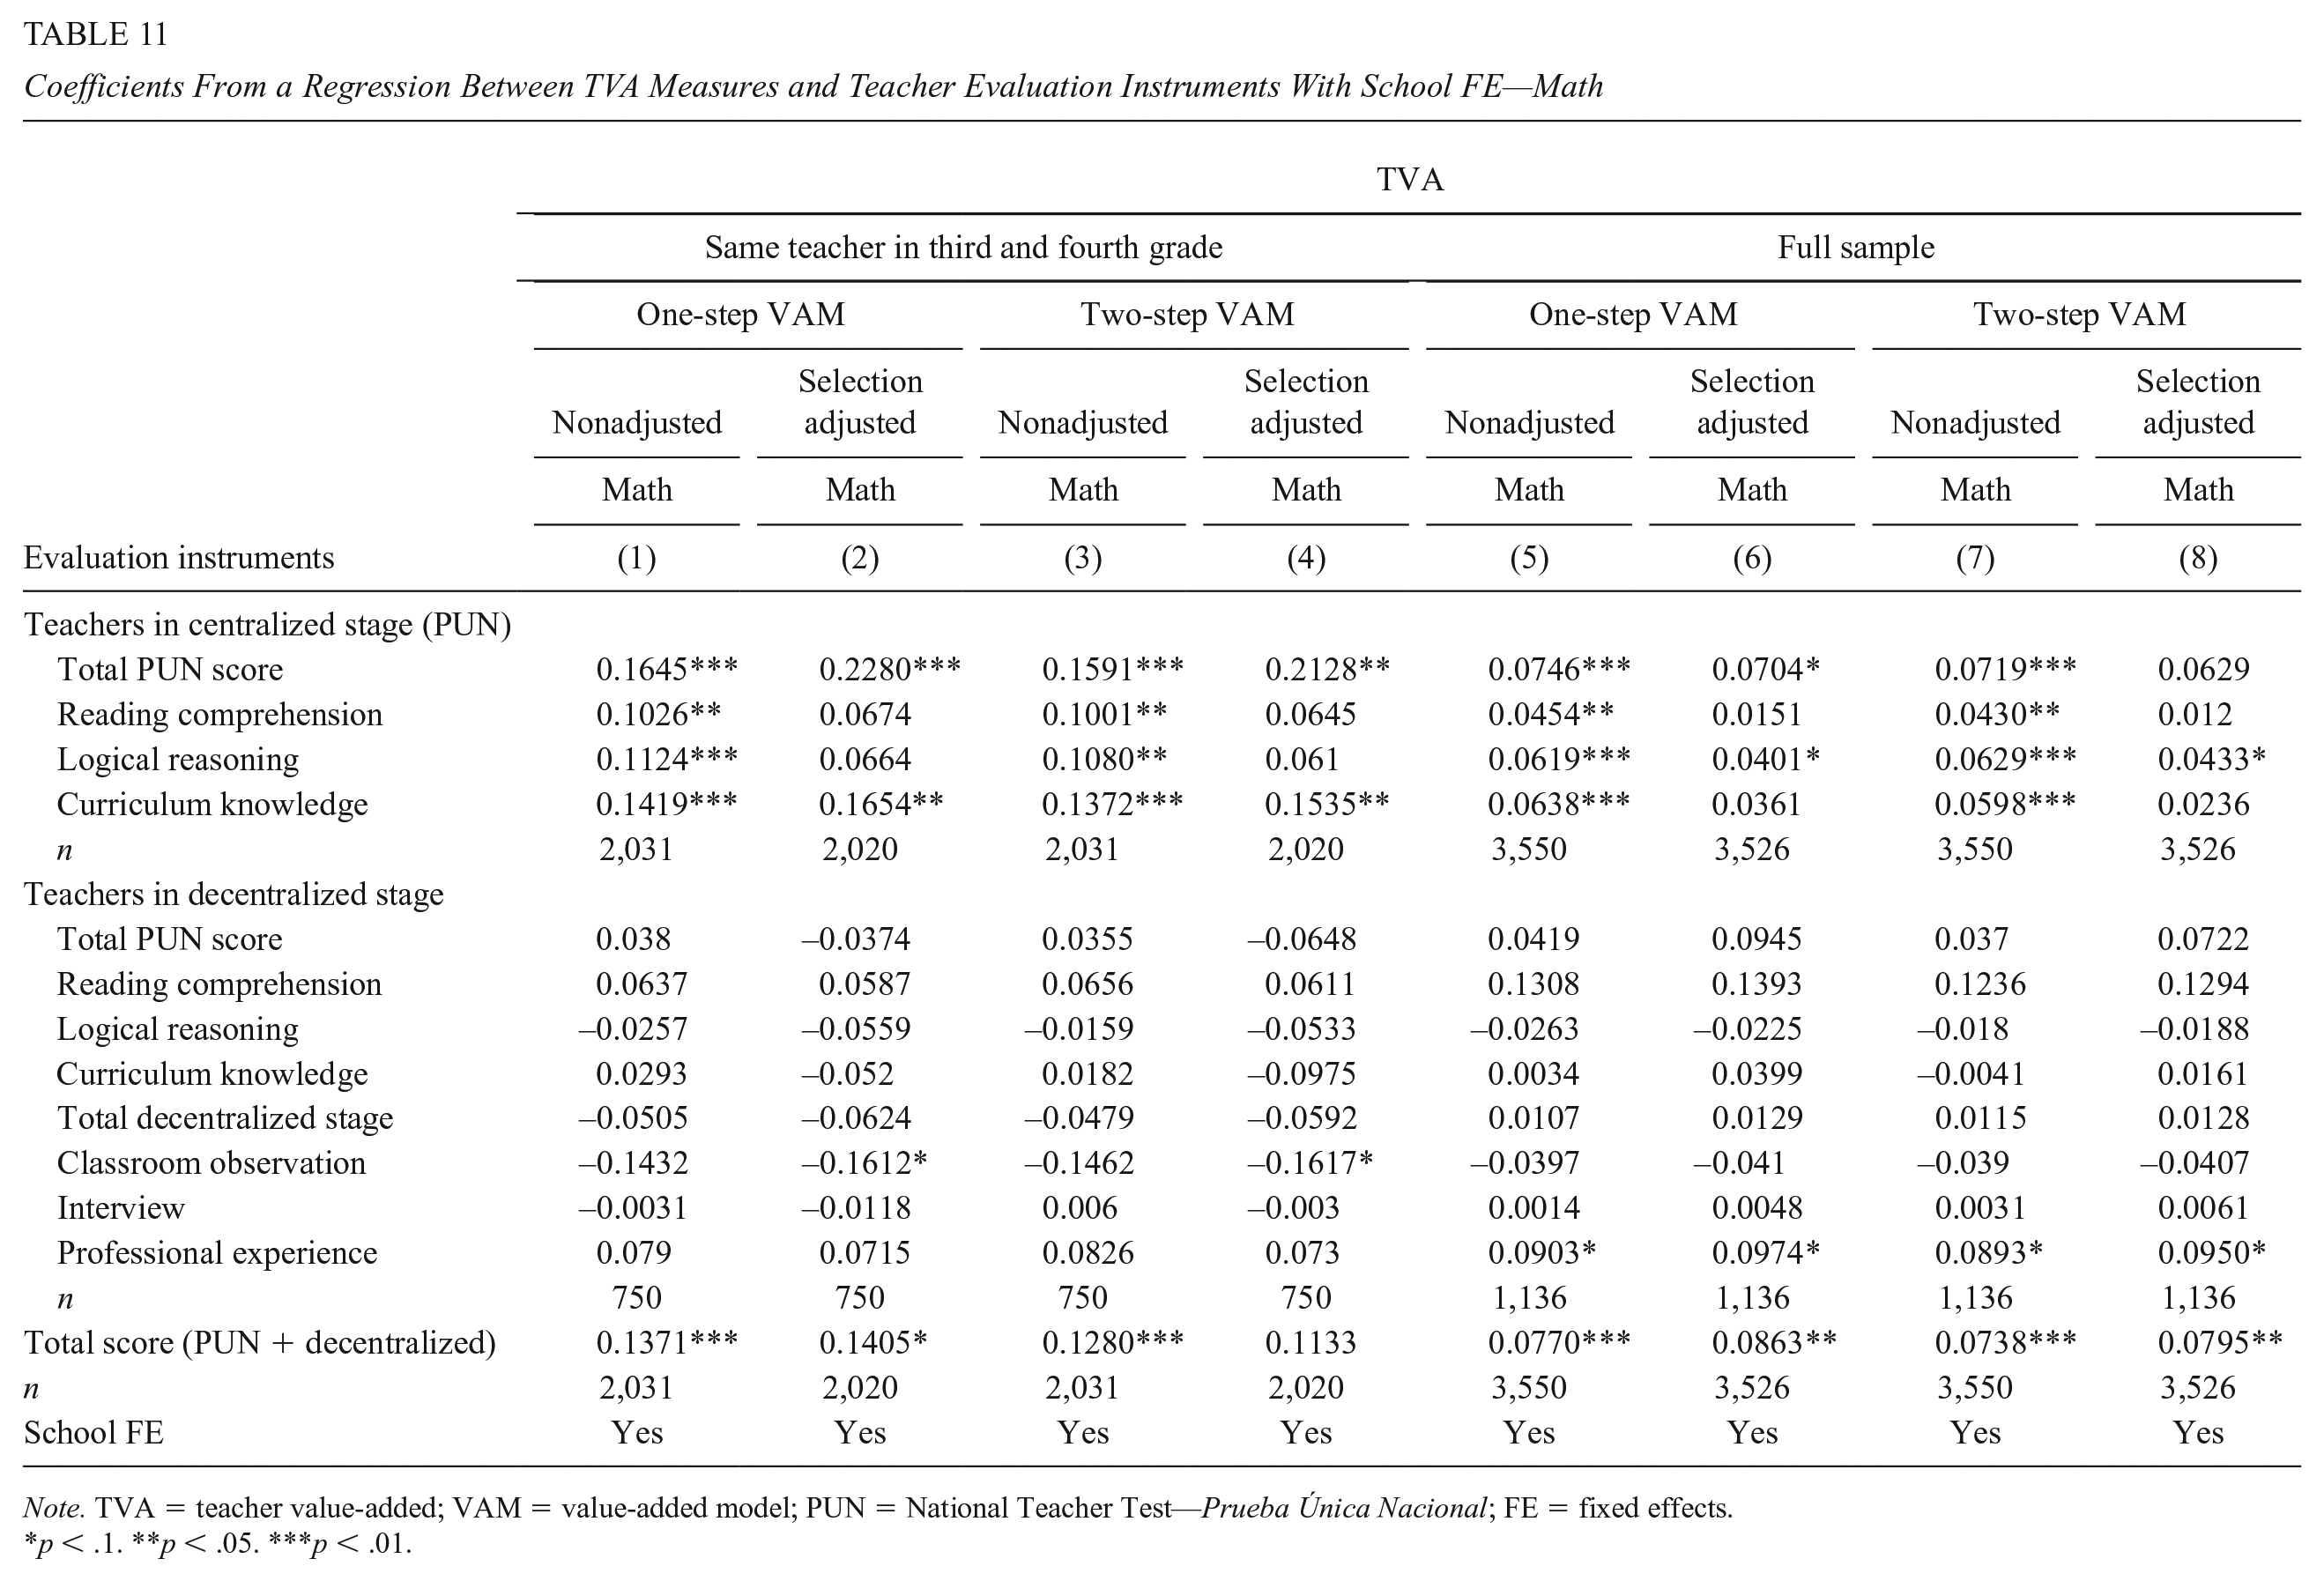
Note. TVA = teacher value-added; VAM = value-added model; PUN = National Teacher Test—Prueba Única Nacional; FE = fixed effects.
< .1. **p < .05. ***p < .01.
Coefficients From a Regression Between TVA Measures and Teacher Evaluation Instruments With School FE—Reading
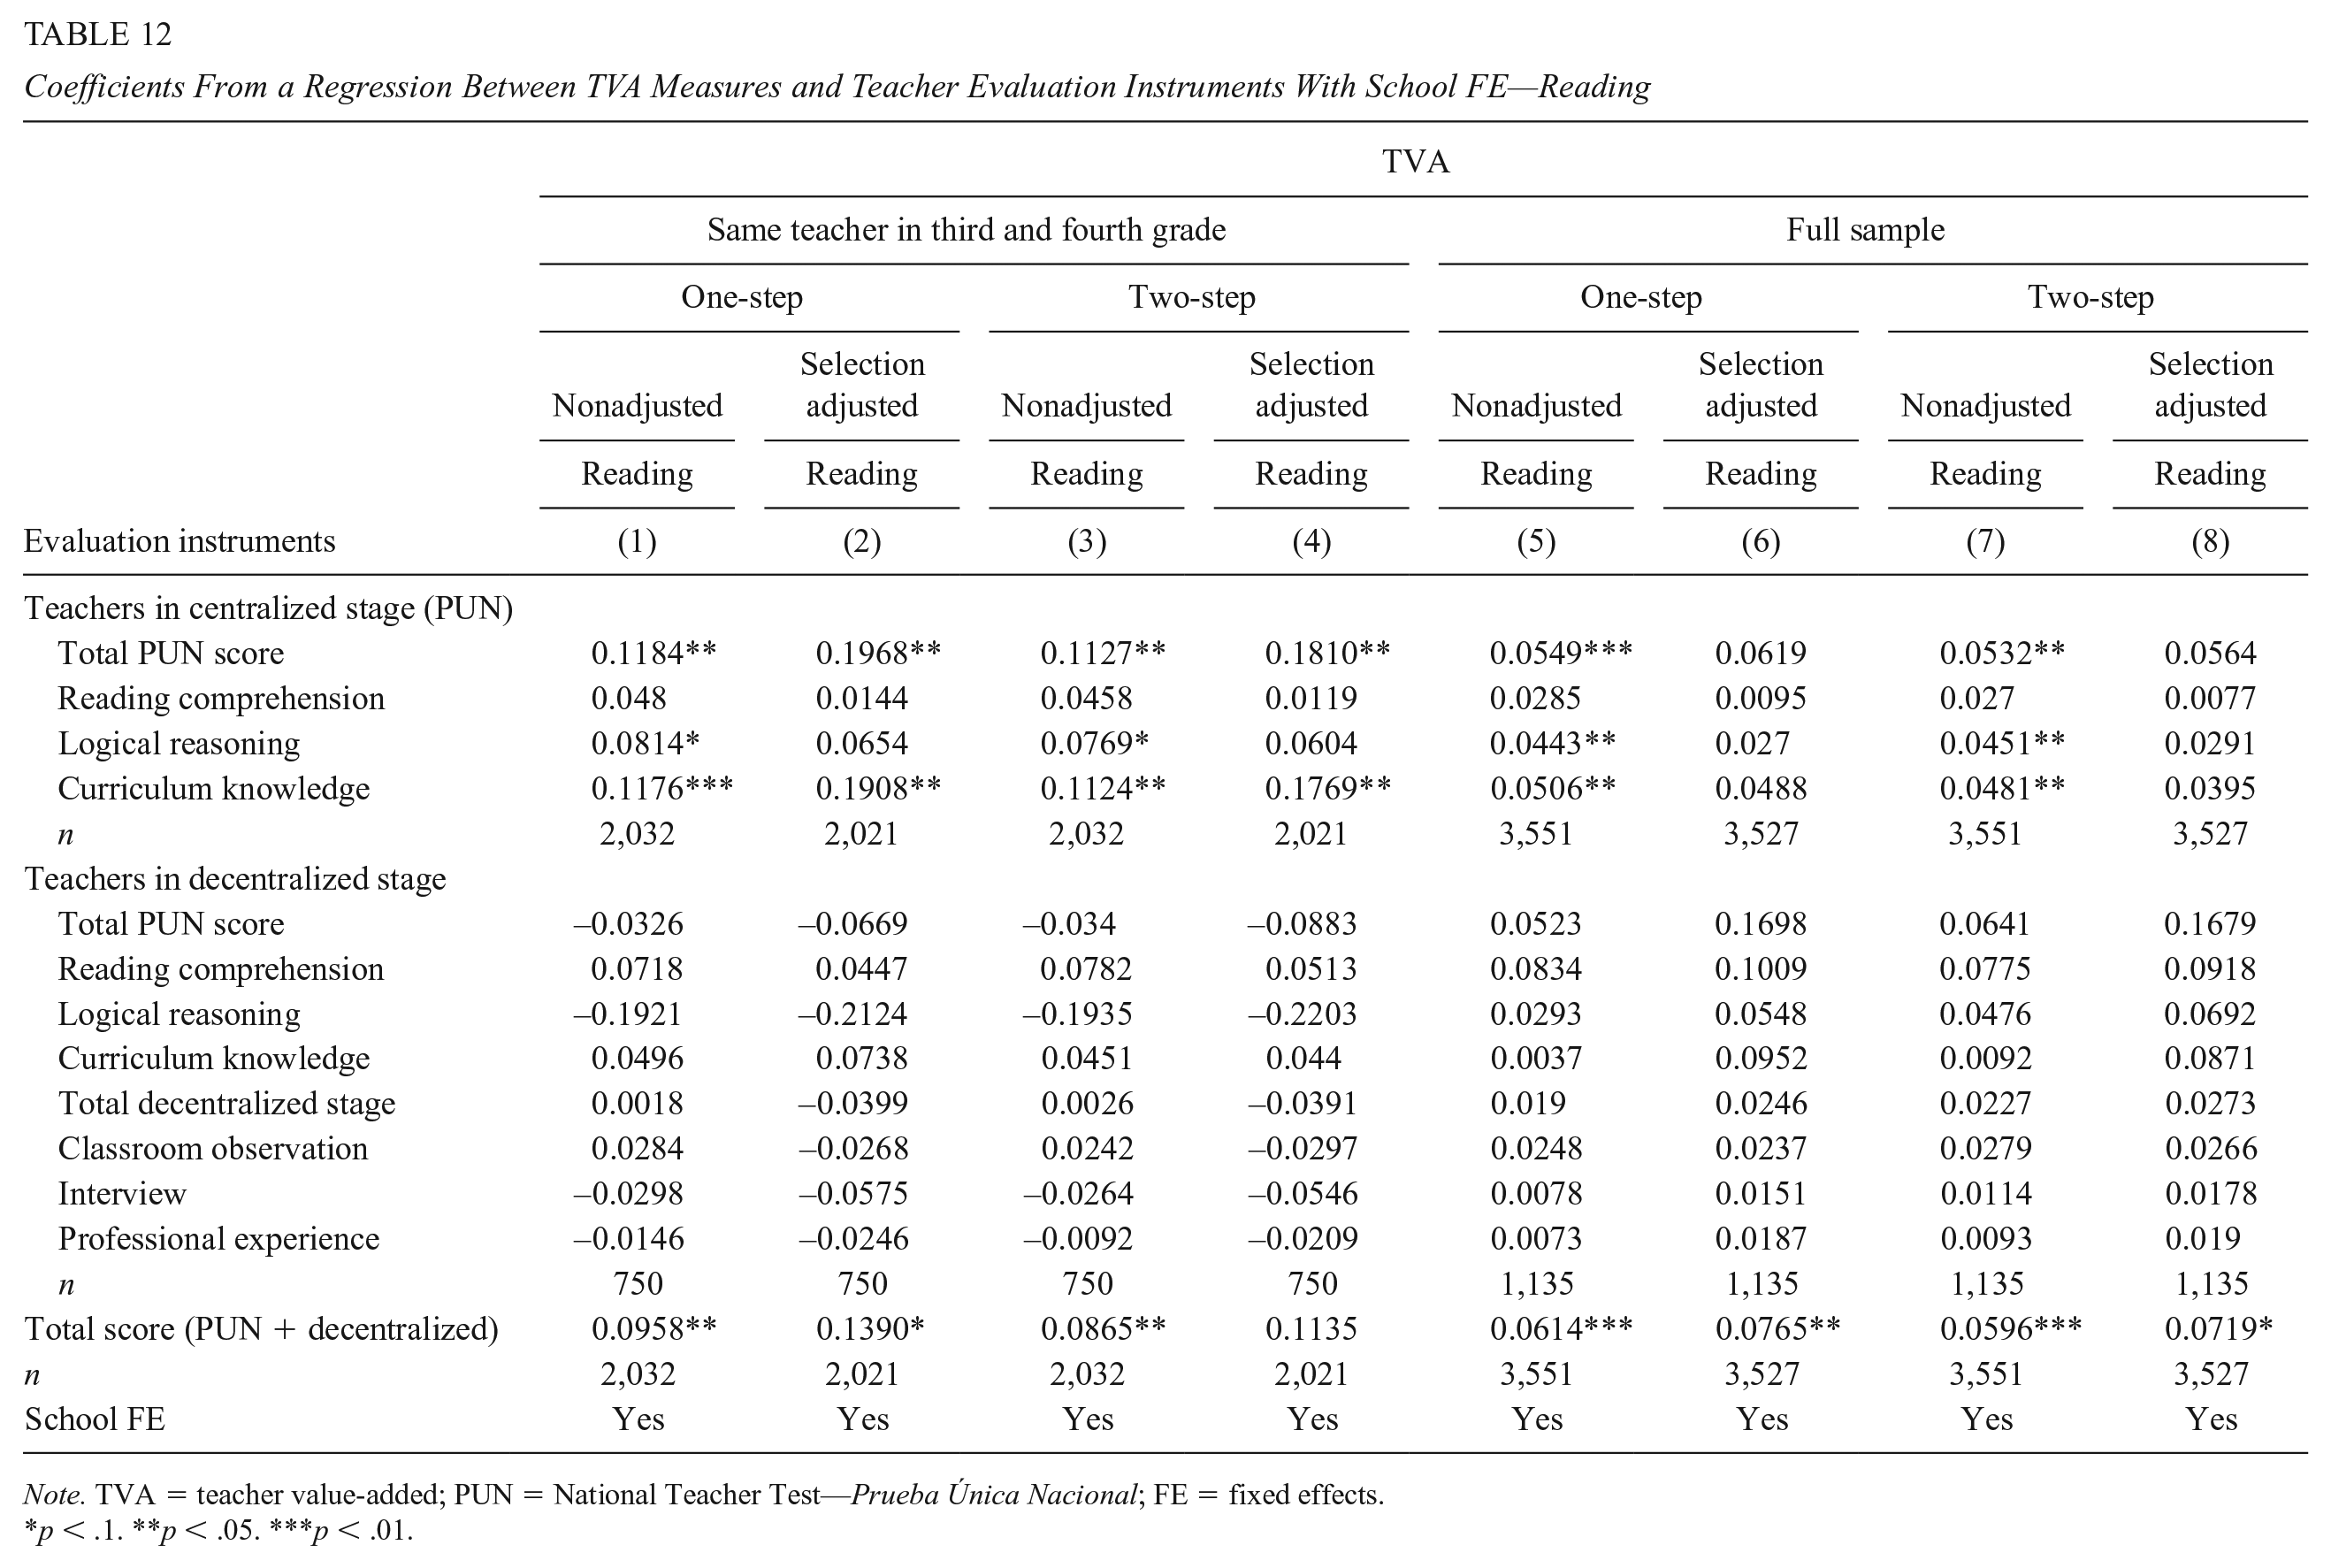
Note. TVA = teacher value-added; PUN = National Teacher Test—Prueba Única Nacional; FE = fixed effects.
< .1. **p < .05. ***p < .01.
Finally, to adjust TVA estimates by their precision level, 14 we implement the Empirical Bayes (EB) shrinkage procedure outlined in Morris (1983) and applied in Herrmann et al. (2016). Statistically, the teacher’s shrinkage estimate is the weighted average of the teacher’s pre-shrinkage VA estimate and the estimate for the average teacher, where weights are based on the variance of the TVA measure. 15 We applied the procedure to the one-step VAM estimated on the restricted sample (same teacher in third and fourth grades).
In Table 13, we present the selection-adjusted relationship between the teacher’s EB estimate and the PUN scores. For mathematics, the magnitudes and significance of the relationships do not change. For reading, the magnitudes as well as some of the conclusions change. For example, in the specification with school fixed effects, the total PUN score and the curriculum knowledge test become nonstatistically significant, and the logical reasoning test shows the highest relationship with the TVA measure. In the model without school fixed effects, the main results remain (i.e., a positive and significant relationship of total PUN score with TVA, a higher relationship of the weighted aggregate score compared with the specific subtests, and a higher relationship with the curriculum knowledge test compared with the other instruments). 16
Coefficients From a Regression Between Empirical Bayes TVA Measures and PUN Scores
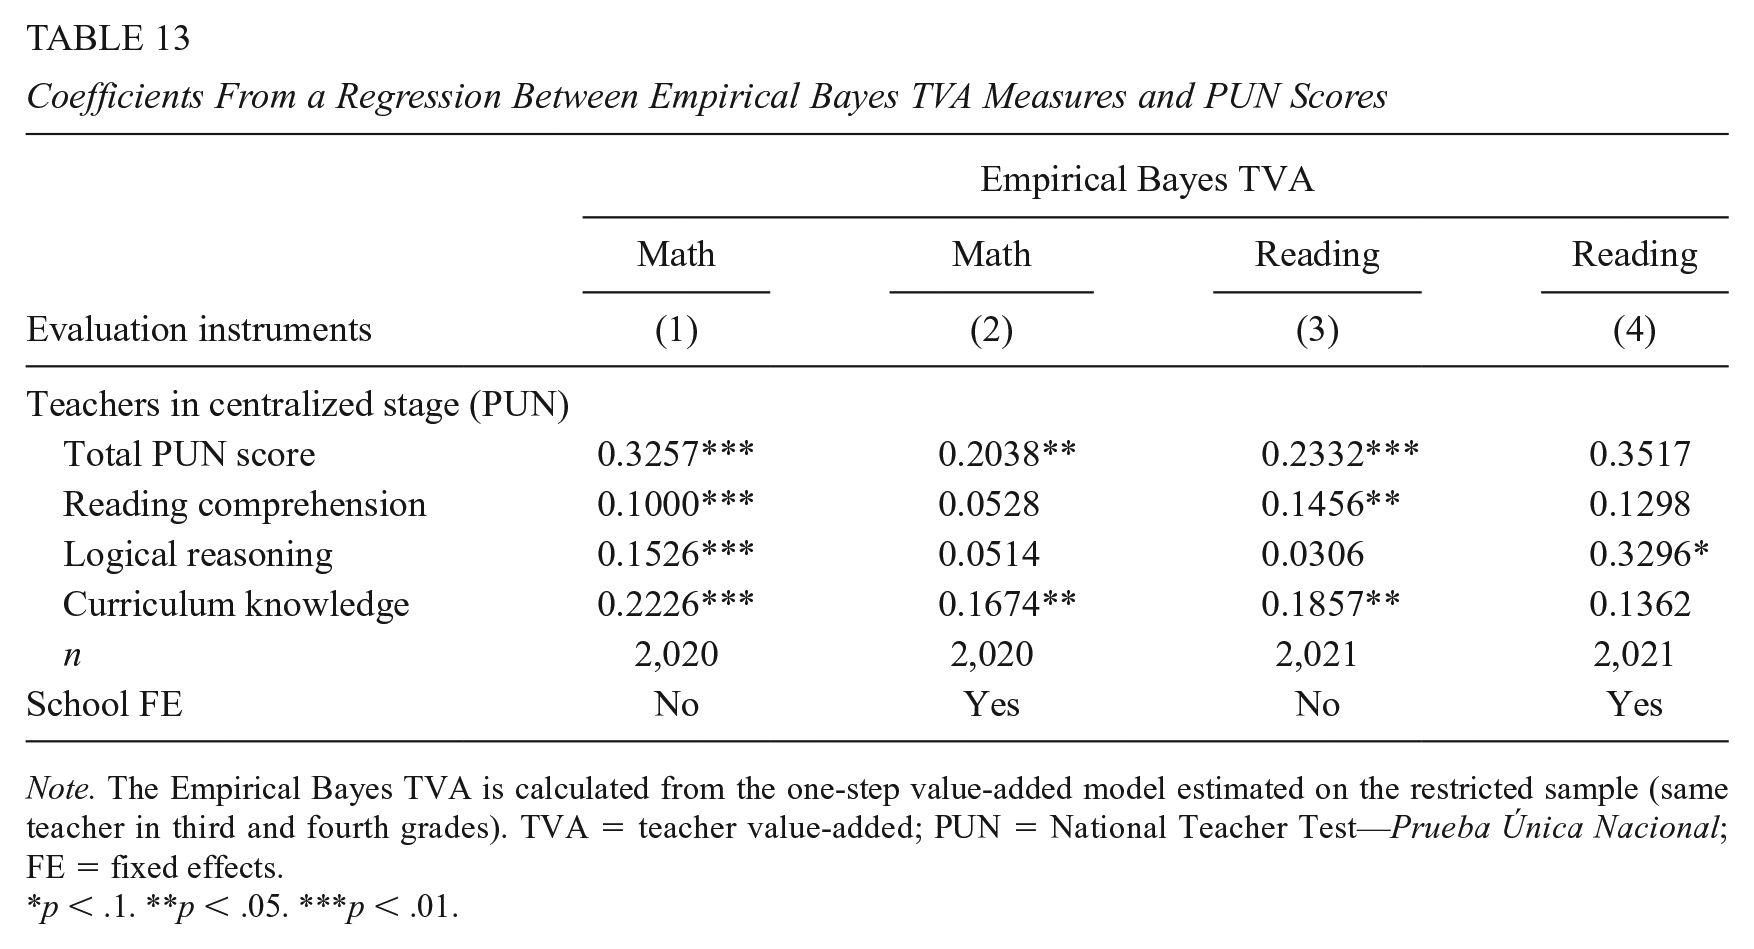
Note. The Empirical Bayes TVA is calculated from the one-step value-added model estimated on the restricted sample (same teacher in third and fourth grades). TVA = teacher value-added; PUN = National Teacher Test—Prueba Única Nacional; FE = fixed effects.
< .1. **p < .05. ***p < .01.
Discussion
In this article, we estimate TVA measures for public primary school teachers in Peru and test for their relationship with the results of two national teacher selections (2015 and 2017). In doing so, we assess whether the instruments used to assign vacancies in the teacher selection process are effective in identifying the most competent teachers.
Our findings indicate that among the three subtests of the first, centralized stage of the teacher recruitment, the logical reasoning and curricular and pedagogical knowledge components have the highest (and significant) relationship with the TVA measure, while the lowest is found for the reading comprehension component. Second, we find that the aggregate PUN score has a higher relationship with our TVA measure than do the individual subtests, suggesting that the current design (a weighted combination of different instruments where the weights are assigned by the MINEDU) possibly increases the ability to predict the VA of a teacher. These results can be a relevant input to evaluate the distribution of the weights of the different components of the evaluation in the Peruvian teaching contest, to identify the most effective teachers. However, calculating the “optimal” weighting requires additional research that, for example, simulates the predictive power of PUN under different weights for the current subtests or under a different set of teacher skills. This is important to extend our conclusions to other educational systems, as our results could vary in education systems with different policy objectives (e.g., where the development of teachers’ mathematics skills is considered more important than reading skills) or where other students’ abilities, beyond their knowledge in mathematics or reading (e.g., noncognitive skills), are evaluated. In addition, when we correct for the bias due to nonrandom selection into teaching, the coefficients of the aggregated centralized stage and the curriculum knowledge instrument increase, while those of the reading comprehension and the logical reasoning instruments decreases. Likewise, the introduction of a school fixed effect reduces the magnitude of the relationships, suggesting that there is some degree of teacher sorting, possibly because candidates with higher PUN scores have preference in the selection of vacancies. Finally, the results for the relationship between TVA and the PUN scores for reading teachers change when we estimate TVA with the EB shrinkage procedure and introduce a school fixed effect in the regression. This finding should be considered when interpreting the results for reading. For mathematics’ teachers, the results remain stable after corrections. Future analysis is needed to understand the differences between adjusted and unadjusted TVA measures for reading.
Among the decentralized, second-stage instruments, we find no significant relationships with our measures of TVA for math, as well as nonrobust coefficients for the classroom observation and interview instruments for reading. The lack of relationship between the decentralized stage and TVA may be driven by several factors. First, the homogeneity of the group of applicants who pass on to the decentralized stage can affect the predictive power of these instruments. The nonstatistically significant relationship with the scores of the centralized stage in the sample of candidates that reaches the decentralized stage reinforces this conclusion. Second, although regulated by ministerial guidelines, the implementation of the decentralized stage is also shaped by local aspects, such as the freedom schools have to tailor the content of the interview to the specificities of their institution or the availability of personnel in forming the Evaluation Committee on the day of the test, among others. For example, in an interview with two professionals from the instrument design team of the Teaching Evaluation Directorate of the Ministry of Education of Peru, they argued that, in practice, those candidates who already teach in a school as temporary teachers tend to receive better scores than those who come from outside. They also point out that in class observations, they have found differences in the application of the scoring criteria among schools. Also, further analysis of the implementation of the classroom observation instrument at the school level would help to disentangle the variation in the results for different subjects and model specifications. This evidence may be relevant for other educational systems that are considering the introduction of teacher evaluation instruments applied at the school level. For example, the results suggest that adequate accountability mechanisms are important to reduce the discretion of schools and avoid distortions in the implementation.
We also find that our measure of TVA is higher for female teachers and for instructors at higher salary levels. At the same time, TVA measures are lower for teachers with temporary contracts compared with those with permanent positions.
Future research could test the stability of these TVA estimates by, for example, estimating TVA models for an additional cohort of students. This analysis could also be further developed by studying the impact of TVA on student achievement and its effectiveness in bridging learning gaps. These extensions would require more systematic student and teacher classroom data. In addition, more information on the quality of the implementation of the decentralized stage of the teacher selection process would improve the set of inputs necessary to evaluate its relationship with teacher effectiveness.
Certainly, defining the optimal weights of the different evaluation components and the skills evaluated ultimately depends on the MINEDU’s policy objectives. Over the last decade, Peru has made significant efforts to reform its public school teacher selection, promoting a more meritocratic and effective process, which has helped to recover the prestige of the profession and improve the quality of teaching (Elacqua et al., 2018). Our results suggest that adjusting the scope and monitoring the implementation of the evaluation instruments employed in the teacher selection process would not only help to successfully identify the most effective teachers but also represent a significant step in increasing equitable educational opportunities in the country.
Supplemental Material
sj-pdf-1-epa-10.3102_01623737221149417 – Supplemental material for Teacher Selection Instruments and Teacher Value-Added: Evidence From Peru
Supplemental material, sj-pdf-1-epa-10.3102_01623737221149417 for Teacher Selection Instruments and Teacher Value-Added: Evidence From Peru by Eleonora Bertoni, Gregory Elacqua, Carolina Mendez and Humberto Santos in Educational Evaluation and Policy Analysis
Footnotes
Acknowledgements
We thank Giuliana Espinosa, Norbert Schady, the IDB-Education BBL, and the IDB regional seminar on teacher assignment for their valuable comments. We thank the Ministry of Education of Peru for their willingness to collaborate, especially Anna Balbuena, Karim Boccio, Luz Jaramillo, Gelsys Meza, Cynthia Neira, and Carlos Venturini.
Declaration of Conflicting Interests
The author(s) declared no potential conflicts of interest with respect to the research, authorship, and/or publication of this article.
Funding
The author(s) disclosed receipt of the following financial support for the research, authorship, and/or publication of this article: We acknowledge the Inter-American Development Bank for funding the research presented in this paper. The opinions expressed in this publication are those of the authors and do not necessarily reflect the views of the Inter-American Development Bank, its Board of Directors, or the countries they represent.
Notes
Authors
ELEONORA BERTONI, PhD, is a computational social scientist at the European Commission, Joint Research Center. Her research focuses on economics of education, labor economics, and public policy impact evaluation.
GREGORY ELACQUA, PhD, is the principal economist in the Education Division at the Inter-American Development Bank in Washington, D.C. His research and technical policy work focus on the economics of education, school finance and efficiency of spending, teacher policy, school accountability, school choice, and the political economy of the educational system.
CAROLINA MENDEZ, PhD, is a senior sector specialist in the Education Division at the Inter-American Development Bank in Colombia. Her research and technical policy work focuses on the economics of education, school finance and efficiency of spending, decentralization, and higher education.
HUMBERTO SANTOS, MA, is an independent researcher with more than 10 years of experience in educational policy analysis. His research focuses on inequalities in school funding systems, analysis of school choice and vouchers, and the experimental evaluation of educational programs.
References
Supplementary Material
Please find the following supplemental material available below.
For Open Access articles published under a Creative Commons License, all supplemental material carries the same license as the article it is associated with.
For non-Open Access articles published, all supplemental material carries a non-exclusive license, and permission requests for re-use of supplemental material or any part of supplemental material shall be sent directly to the copyright owner as specified in the copyright notice associated with the article.