
Abstract
Over the last forty years, non-elite private institutions have steadily increased listed tuition and institutional aid. This practice has continued even though the net tuition revenue gains from incoming students have become minimal. We present a new explanation for why these yearly increases continue: The pricing structure of non-elite privates relies upon net price differentials by year of study that are generated through annual increases in listed tuition. We describe how the presence of transfer costs encourages the use of this pricing structure and then document the presence of this pricing structure using data from IPEDS and NPSAS. Similar analyses of public and elite private institutions reveal differences across sectors in the use of differential pricing by year of study.
Keywords
Introduction
Non-elite private higher education institutions 1 did not experience similarly sized growth in student demand. As a result, they needed to increase institutional aid (i.e., discounting) substantially alongside listed tuition to continue to attract new students. Despite this growth in aid, this pricing strategy led to substantial gains in net tuition revenue for these institutions in the 1980s and 1990s (Breneman, 1994; Breneman et al., 2007). The existing literature provides two reasons for this: First, the previous listed tuition prices were below the willingness to pay of a substantial share of each incoming class, so while increasing listed tuition, these schools could expand price discrimination by charging higher net prices to this share of students (Breneman, 1994; McPherson & Schapiro, 1998). Second, the rising prices had helpful framing effects, such as differentiating privates from lower-priced publics in regard to perceived quality (Cheslock & Riggs, 2021; Duffy & Goldberg, 1998).
These two benefits of rising listed tuition and institutional aid fell over time for non-elite private institutions. The steady expansion of price discrimination led to declines in the gap between reservation prices (i.e., the highest amount students are willing to pay) and actual prices (i.e., the net prices students actually pay). As the consumer surplus (i.e., the differences between these two prices) steadily fell over time, the growth in net tuition revenue generated by further price discrimination among entering students also steadily declined.
The psychological framing benefits of rising tuition also became more tenuous as listed tuition reached greater heights (Cheslock & Riggs, 2021). Once prospective students realize that almost all incoming students are receiving distinguished sounding institutional grant awards, they may no longer view a high listed price as an indicator of institutional quality and no longer experience a grant award as a boost to their ego. If these benefits continue because prospective students are unaware that institutional aid awards are ubiquitous, then a different set of problems pertaining to “sticker shock” grow in importance. Prospective students, especially those with less knowledge about the college-going process, may be deterred from applying to the institution due to the high listed tuition price (Levine et al., 2020; Longmire and Company, Inc, 2013).
Despite these concerns, nonelite private institutions continued to raise listed tuition and increase discounting throughout the 2000s and 2010s. This paper examines a potential explanation for why non-elite privates continue to increase their listed prices. This explanation also centers on the organizational desire to generate net tuition revenue, but the focus turns to maintaining rather than increasing this revenue source. When institutions employ a specific type of pricing structure that includes net price differentials by year of study, they must increase listed tuition annually just to maintain existing levels of net tuition revenue. Net price differentials by year of study occur when entering students pay a lower average net price than second-year students; second-year students pay a lower average net price than third-year students; and so on. An institution can easily enact such differentials by charging different listed tuition prices to students from different years of study or by front-loading institutional aid awards so that the institutional grant awards for individual students decline over time.
The specific type of pricing structure highlighted in this paper, which we term an ever-increasing pricing structure, relies on a very different mechanism to produce net price differentials by year of study. For each entering cohort, institutional grant awards are roughly fixed in that the average grant award for students in that cohort does not increase as students advance in their studies. The average net price for the cohort does rise over time because listed tuition increases each year. Across incoming cohorts of students, average institutional grant awards increase each year so that more recent entering cohorts receive larger average aid awards than previous entering cohorts. Assuming no change in student demand, the increase in aid for incoming students is similar to the growth in listed tuition for all students. In combination, these items cause net prices for individual students to increase as they advance in their studies but leaves overall net tuition revenue for the institution stable over time.
The listed tuition increases play a key supporting role in an ever-increasing pricing structure, because without an increase in listed tuition, individual returning students would pay the same net price as they paid in the previous year. When returning students no longer pay higher net prices, the total net tuition revenue for the institution will fall. Institutions not wishing to cut their budgets in response to net tuition revenue declines will consequently feel pressure to increase listed tuition each year.
Prior to any empirical analysis, we carefully describe this pricing structure and how it will lead net tuition revenue to decline if listed tuition does not increase. This financial incentive differs from the other benefits of increasing listed tuition described in previous work, because it does not diminish over time and encourages institutions to increase listed tuition in perpetuity. While describing the pricing structure, we also examine reasons why this pricing structure might emerge among higher education institutions, such as non-elite privates, that face strong competition for students and possess pricing autonomy. We highlight a key feature, the market power that institutions hold over their returning students, that could lead such institutions to enact net price differentials by year of study. The market power stems from the transfer costs associated with switching schools.
Our empirical analyses examine whether non-elite private institutions employ this pricing structure. We first use data from the Integrated Postsecondary Education Data System (IPEDS) for the 2001/02 to 2018/19 period and document two key practices relating to this pricing structure: continual increases in average listed tuition and institutional grant aid and the growing custom of providing aid to all (or almost all) incoming full-time students. We then employ data from seven different editions of the National Postsecondary Student Aid Study (NPSAS) that span the 1992/93 to 2015/16 period and find that non-elite privates do engage in differential net pricing by year of study via differential grant awards. A comparison of the IPEDS and NPSAS results implies that differential aid awards are due to an ever-increasing pricing structure rather than front-loaded aid awards that decline as students advance in their studies. The differences over time in first-year institutional grant awards are similar to the grant differences across adjoining years of study within a specific year, which indicates that average awards for each cohort remain similar rather than decline as students in that cohort advance in their studies.
We also examine data for public and elite private institutions. We might expect these institutions to differ from non-elite private institutions in whether and how they utilize net price differentials by year of study. Public institutions possess much less pricing autonomy than non-elite privates while elite private institutions possess stronger student demand and distribute institutional grant awards solely or primarily on the basis of financial need. Our findings reveal differences by institutional type. Similar to previous research, we find evidence that some public institutions employ differential pricing through straightforward pricing structures that include differential listed tuition. In contrast, elite privates do not appear to utilize differential pricing by year of study.
We close the paper by discussing a range of alternative pricing policies that institutions could employ that would not incentivize ever-increasing listed tuition and institutional aid. Schools could eliminate the use of net price differentials by year of study, utilize methods for generating net price differentials by year of study that do not require yearly listed tuition increases, or combine an ever-increasing pricing structure with periodic tuition resets. We describe each of these options as well as opportunities for further research.
Related Literature
Previous research documents cost pressures that lead higher education institutions to seek to increase net tuition revenue. Archibald and Feldman (2011) note that expenditures rise more rapidly in higher education than in other industries because higher education is a personnel-services industry that relies heavily on highly educated labor and cannot easily reduce costs through technological progress. Bowen (1980), Ehrenberg (2002), and Martin (2011) highlight a range of additional considerations that promote further spending, including an organizational commitment to excellence, prestige, and influence, competition between institutions, and an absence of organizational pressures that might restrain expenditures.
In response to rising spending pressures, non-elite private institutions can seek to increase the net tuition revenue they generate for each entering cohort of students by increasing their use of price discrimination. Breneman (1994) and McPherson and Schapiro (1998) describe how the use of price discrimination expanded when the leaders of these institutions stopped viewing institutional aid primarily as an expense that reduces available resources and started viewing it as a tool—when paired with rises in listed tuition—for increasing net tuition revenue. Listed tuition increases allowed the institutions to generate more net revenue from entering students with high reservation prices and increases in targeted institutional grant awards allowed the institutions to still attract students with low reservation prices. 2
Breneman (1994) and Breneman et al. (2007) provide evidence demonstrating that these listed tuition increases led to substantial growth in net tuition revenue in the 1980s and 1990s (the decades predating the period associated with this study). The successful implementation of price discrimination by nonelite privates was not a surprise because colleges and universities are uniquely positioned to differentiate incoming students by their willingness to pay. The typical barriers preventing price discrimination—asymmetric information and ease of resale—are not present because higher education institutions have detailed information about students’ financial and academic backgrounds and students cannot resell their enrollment slots (Fillmore, 2016).
Recent research has highlighted the declining returns that come from steadily expanding price discrimination over time (Behaunek & Gansemer-Topf, 2019; Hillman, 2012). The financial gains from further price discrimination come from higher payments by students whose reservation prices exceed the previous listed tuition price. Unless student demand is growing, steadily expanding price discrimination will result in reservation prices exceeding listed tuition for a smaller and smaller share of incoming students and consequently produce smaller and smaller gains in net tuition revenue. Indeed, the share of students paying the full listed price at the median non-elite private institution fell from 35% in 1990 to 15% in 2000 to 1% in 2018. 3
The standard economic model of price discrimination is not the only perspective that helps explain why non-elite privates were able to increase net tuition revenue via rising listed tuition and institutional aid. Past research in psychology, marketing, and behavioral economics suggest that rising listed prices and discounts can provide helpful psychological framing effects that might encourage students to enroll. Cheslock and Riggs (2021) review this literature and describe three types of psychological framing effects pertinent to college pricing. First, the price-quality heuristic could lead prospective students to view a high listed price as a signal of high quality. Second, ego-expressive aspects of aid could make students even more likely to matriculate when high listed prices are accompanied by aid awards that confer distinction upon the recipients. And third, the silver lining effect could lead students to prefer a higher listed price accompanied by a $5,000 institutional grant award than a listed price that is $5,000 less and unaccompanied by a discount. Past research suggests that these psychological framing effects should be stronger in industries with characteristics matching those of the higher education industry (Cheslock & Riggs, 2021).
Previous research has examined questions relating to two of the pricing structures that generate net price differentials by year of study. For differentiated listed tuition, researchers have examined the prevalence of this pricing structure. In a representative survey of U.S. degree-granting postsecondary institutions, Simone (2010) finds that only 2.6% of four-year privates and 7.1% of four-year publics vary listed tuition by year of study. Similarly, Ehrenberg (2012) finds that 6.6% of four-year publics charge differential listed tuition by year of study.
Previous research has not described the prevalence of front-loaded grant awards that decline with year of study but has provided insight into this pricing structure’s possible utility for institutions and students. Conducting simulations, DesJardins et al. (2002a) show that front-loading student grant awards to the first two years decreases the probability of stop out and the effect is even stronger when the front-loading of grant awards is combined with loan increases in later years. Further, Avery and Hoxby (2004) find that front-loading a student’s grant award increases the probability of initial enrollment by 48% of the prior probability.
Theoretical Framework
Before discussing how the use of net price differentials by year of study could contribute to ever-increasing listed tuition and aid, we focus first on the use of net price differentials by year of study in general. Why might schools employ a pricing strategy that leads students in later years of study to pay higher net prices than students in earlier years? One potential explanation is that university policymakers may have implemented such a policy so that prices aligned more closely with actual instructional costs and students’ ability to pay post-graduation. The instruction of upper division students costs substantially more than the instruction of lower division students because upper division students enroll in smaller courses (Conger et al., 2010). Upper division students are also more likely to be able to pay post-graduation, because the lower division includes many students who eventually drop out (Stange, 2015).
A second potential explanation for why schools may adopt differential pricing by year of study is that the price sensitivity of students might vary by year of study. As noted in the previous section, a pricing policy that sets lower prices for more price-sensitive students and higher prices for less price-sensitive students will generate higher net tuition revenue than similar schemes that ignore price sensitivity. Our earlier discussion focused on variation in price sensitivity across students in the same entering cohort, but the same principles apply to variation across years of study. If the average reservation price rises with year of study, then higher education institutions may choose to adopt pricing policies containing differential net pricing by year of study because they possess an attractive feature: They will produce more net tuition revenue than alternatives. 4
We might expect the average reservation price to increase with year of study for two reasons. 5 First, students may recognize the previously mentioned higher instructional costs and earnings benefit associated with later years of study and be willing to pay more in later years as a result. Second, higher education institutions possess market power over their continuing students due to the cost of transferring between institutions. This market power grows as students advance in their studies and leads to decreases in price sensitivity.
This second point deserves further explanation. When students initially select which college to attend, they consider the relative merits of multiple institutions. After they enroll, they then face an additional decision at the end of their first academic term: Should I continue at this institution or transfer to an alternative institution? When making this decision, students again consider the relative merits of multiple institutions but now also consider the transfer costs that they would face at every institution other than their current one. As a result, their reservation prices for their current institutions are higher at the end of their first term than they were when they initially enrolled. Students face additional enrollment decisions at the end of every subsequent academic term. Because transfer costs grow as students advance in their studies, reservation prices also grow. 6
If an institution seeks to increase its net tuition revenue, it may try to capture these higher reservation prices by charging higher net prices for continuing students. The presence of higher net prices in later years of study can increase the competition for entering students, which can lead to lower net prices in the first year of study. The result is a pricing structure where net prices increase as students advance in their studies.
Previous research has presented theoretical models that illustrate how transfer costs could lead to such a pricing structure. Klemperer (1987) developed a general model of markets with consumer switching costs that considers the market power that organizations possess over existing consumers when switching costs are present. He highlights how switching costs do not necessarily make organizations better off financially, because the heightened competition for new consumers leads to lower initial prices that may more than offset later financial gains. Ransom (1993) and Black and Loewenstein (1991) present models specific to higher education institutions albeit for a different context. Both papers present a theoretical model that considers the market power that institutions possess when setting salaries because their faculty often incur substantial relocation costs if they leave for a job at a new university. That market power can lead to high-seniority faculty receiving lower compensation than similar faculty that were recently hired. In the Online Supplementary Files associated with this article, we present adjusted versions of their models that align with the context of college pricing. In these adjusted versions, higher education institutions use their market power to charge higher prices to returning students rather than to pay lower salaries to returning faculty.
Net Price Differentials by Year of Study and Ever-Increasing Listed Tuition and Aid
Table 1 describes three different methods for creating net price differentials by year of study. For each method, the listed tuition and average institutional grant awards for each entering cohort are listed for three successive years. The illustrations in Table 1 are presented to demonstrate one key point: An ever-increasing pricing structure utilizes annual increases in listed tuition to help generate net price differentials by year of study while the other two pricing structures (differential listed tuition and front-loaded aid awards) do not. The illustrations contain simplifying assumptions that are unrelated to that point. Each entering cohort is equally sized; no students leave the institution before completing four years of study; all students complete their study after four years; and no student enters the institution as a transfer student. In addition, the institution cannot increase net tuition revenue through further increases in listed tuition. 7 Student demand is constant over time, so the entering cohorts in years t+1 and t+2 have an identical distribution of reservation prices as the year t entering cohort. The institution has already enacted price discrimination to the fullest extent possible.
Simulated Pricing Structures With Net Price Differentials by Year of Study
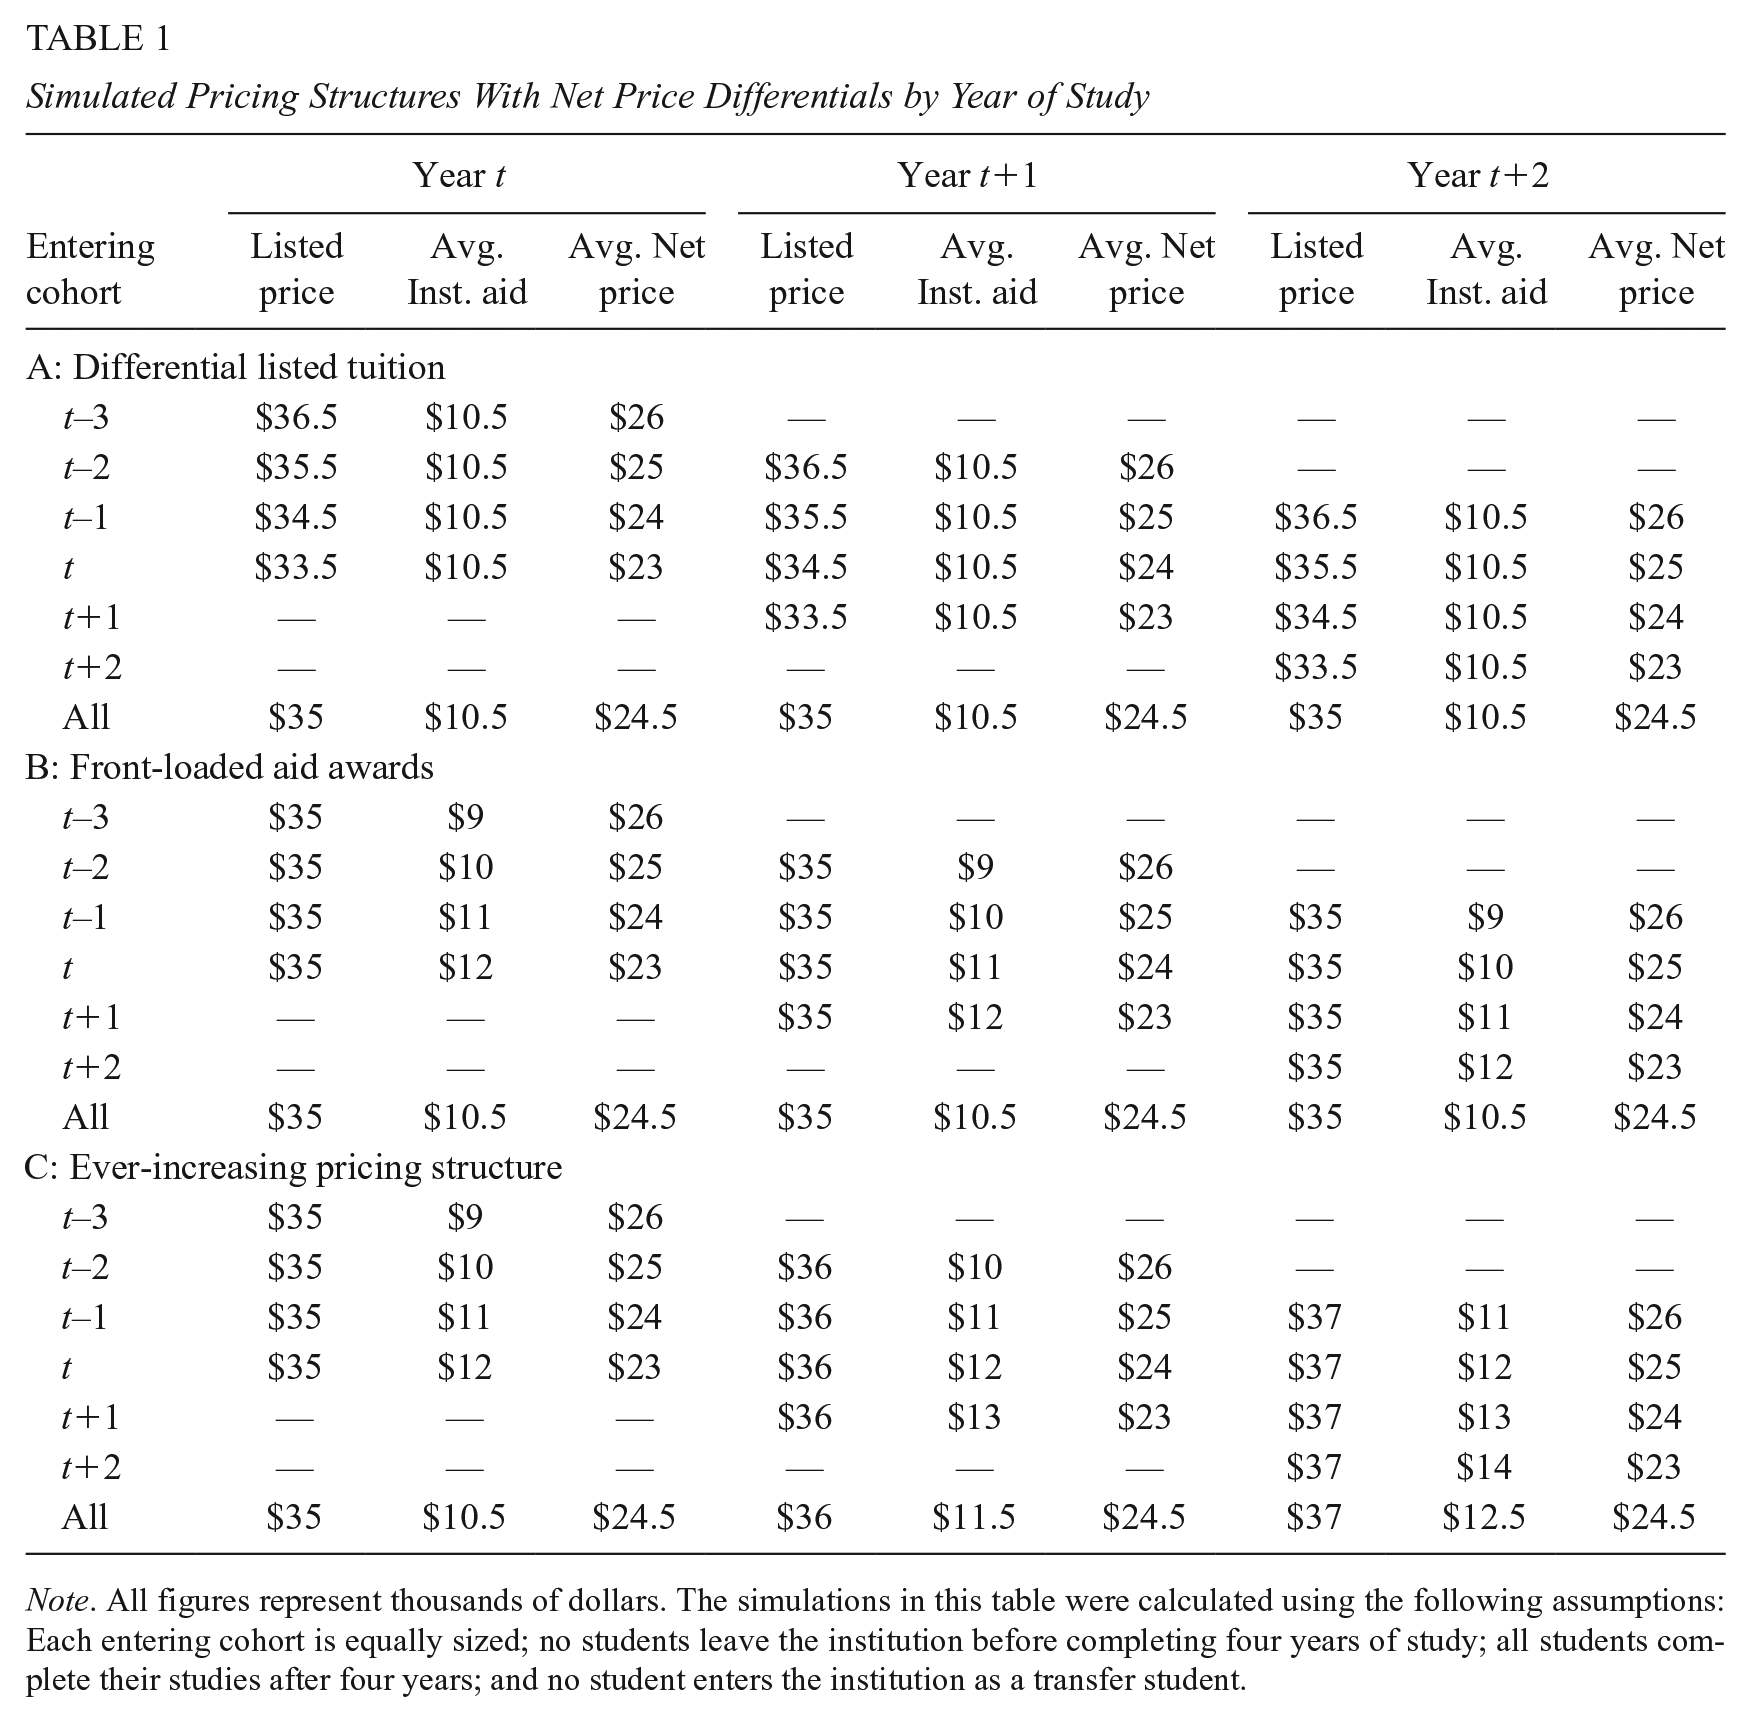
Note. All figures represent thousands of dollars. The simulations in this table were calculated using the following assumptions: Each entering cohort is equally sized; no students leave the institution before completing four years of study; all students complete their studies after four years; and no student enters the institution as a transfer student.
In these illustrations, the average reservation price of students increases with year of study so that the institution can increase the average net price for a cohort by $1,000 each year. The average net price for each cohort can rise from $23,000 to $26,000 over that cohort’s four years of study. The net price differentials by year of study can be observed by comparing differences across cohorts within a given year or by comparing differences across years within a given cohort.
Panel A of Table 1 contains different listed tuition prices for each year of study while Panel B contains front-loaded aid awards that decline as students advance in their studies. For both pricing structures, the average listed tuition remains at $35,000 in years t+1 and t+2. For differential listed tuition, each cohort sees its listed price rise from $33,500 to $36,500 over time, but these increases do not affect the average listed tuition price because graduating cohorts at the top of this pricing ladder are continuously replaced with entering cohorts at the bottom. For front-loaded aid awards, each cohort sees its average grant award fall from $12,000 to $9,000 over time, but the overall average remains at $10,500 due to the changing mix of cohorts.
Panel C of Table 1 contains numbers for an ever-increasing pricing structure. This pricing structure does not rely upon one simple mechanism to generate net price differentials by year of study but instead relies upon multiple items. One mechanism that is not included is differential listed tuition because the listed tuition does not vary across cohorts within a given year. The net price differentials are instead generated through differences in institutional grant aid, and these aid differences are generated through a combination of annual listed tuition increases, annual increases in first-year grant awards, and grant awards that are, on average, consistent over time for each cohort. 8
These three elements can be observed by comparing the numbers for the ever-increasing pricing structure across years. Listed tuition steadily increases from $35,000 to $37,000 between years t and t+2, which forces the institution to increase average first-year grant awards from $12,000 to $14,000 so that the average first-year net price remains at $23,000. Students who entered the institution in year t see their average grant awards remain at $12,000 in years t+1 and t+2, which means that this cohort’s average net price steadily rises from $23,000 to $25,000 due to the listed tuition increases. Similarly generated average net price increases occur for the other cohorts as they advance in their studies.
Table 2 demonstrates the important role that listed tuition increases play within an ever-increasing pricing structure. The illustrations in this table are identical to those in Panel C of Table 1 except that listed tuition remains set at $35,000 across all three years. The frozen tuition results in the institution no longer increasing first-year aid awards, because a $12,000 average grant will continue to produce an average net price of $23,000 in years t+1 and t+2. As in Table 1, the average grant award is consistent over time for each cohort. Because listed tuition is not increasing over time, the average net price is now also consistent over time for each cohort.
Simulated Pricing Structure With Net Price Differentials by Year of Study: Ever-Increasing Pricing Structure (Absent Listed Tuition Increases)
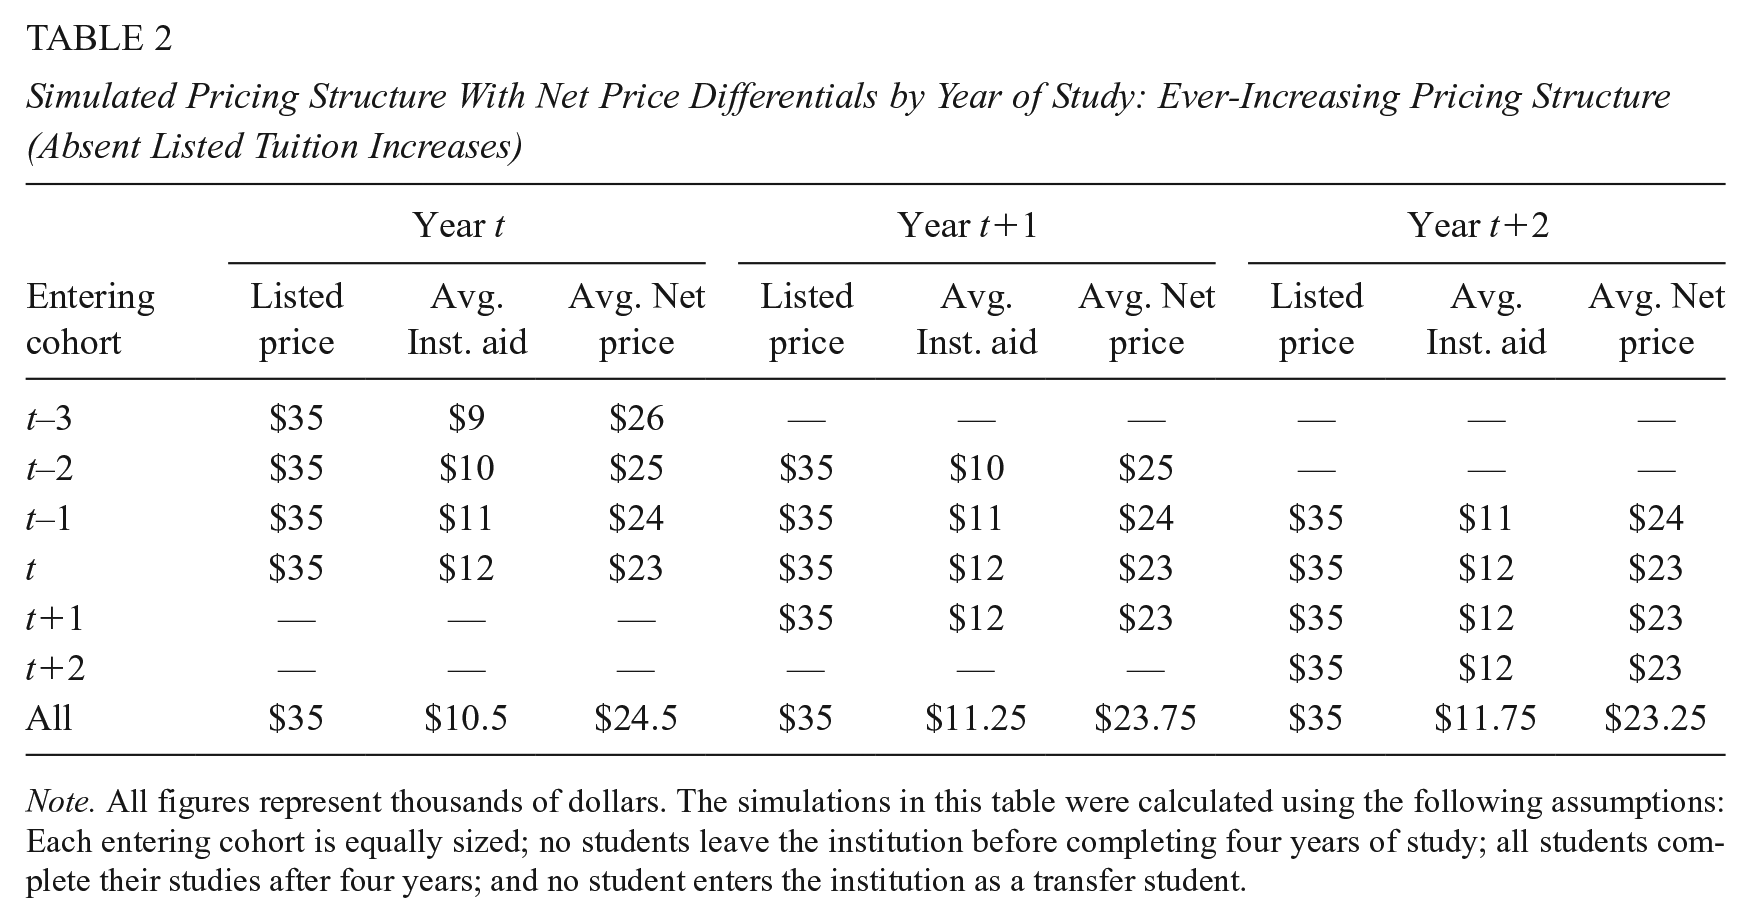
Note. All figures represent thousands of dollars. The simulations in this table were calculated using the following assumptions: Each entering cohort is equally sized; no students leave the institution before completing four years of study; all students complete their studies after four years; and no student enters the institution as a transfer student.
One element that is not consistent over time is the net tuition revenue per-student that is generated by the institution. In Table 2, this figure falls from $24,500 in year t to $23,750 in year t+1 to $23,250 in year t+2. In contrast, this figure remained at $24,500 across all three years in Table 1. The declining net tuition revenue per student is due to the elimination of net price differentials by year of study. The average net price for the year t entering cohort no longer rises to $24,000 in year t+1 and $25,000 in year t+2, but instead remains at $23,000 over the entire period. The average net price of other cohorts are similarly frozen, so the net tuition revenue generated for the institution by second-year, third-year, and fourth-year students declines over time.
The institution portrayed in Table 2 could prevent this decline in net tuition revenue by decreasing institutional grant awards for returning students. Such reductions would essentially cause the institution to move immediately from an ever-increasing pricing structure to one with front-loaded aid awards. An immediate transition would be impossible at an institution that had made formal promises of future grant support and would be awkward at an institution that previously presented the grant award as a marker of meritorious achievement. Even without such extreme considerations, an immediate transition could be challenging for additional reasons such as student expectations and the absence of established procedures for enacting and communicating widespread adjustments to existing grant awards. Because an immediate transition to a new pricing structure is challenging and budget cuts are deeply unpopular, institutions with an existing ever-increasing pricing structure will have a clear short-term financial incentive each year to increase listed tuition. This short-term financial incentive relates to maintaining, rather than expanding, existing levels of net tuition revenue.
Differences in Adoption
Higher education institutions might differ in whether and how they enact net price differentials by year of study. Non-elite private institutions would find an ever-increasing pricing structure easier to implement than public institutions or elite privates would. Public institutions typically possess limited pricing autonomy and would find it challenging to increase listed tuition during periods when state policymakers strongly oppose such increases. Absent the ability to steadily increase listed tuition, they would find differential listed tuition or front-loaded aid awards a more reliable method for generating net price differentials by year of study.
Many elite private institutions would find it challenging to utilize front-loaded aid awards or an ever-increasing pricing structure, because these institutions typically distribute grant awards solely (or primarily) on need-based criteria (McPherson & Schapiro, 1998). As listed tuition increases, the financial need of returning institutional grant recipients will also increase. Generous need-based policies would push elite privates to increase institutional grant awards for returning students rather than freeze or reduce them. If elite privates wanted to enact net price differentials by year of study, they would likely rely upon differential listed tuition. These institutions may be the likeliest to forego net price differentials by year of study in general, as their large endowments and strong student demand allow them to ignore some market-related pressures.
Non-elite privates possess the pricing autonomy that public institutions lack but do not possess the wealth and strong student demand that elite private institutions enjoy. Especially during the 1980s and 1990s, an ever-increasing pricing structure would have been attractive to any non-elite private institution seeking to increase net tuition revenue. The annual increases in listed tuition and institutional aid would have provided helpful psychological framing effects and allowed for greater price discrimination within entering cohorts. The net price differentials by year of study would have aligned net prices with differences in students’ willingness to pay. We turn now to an empirical investigation of whether these institutions employ an ever-increasing pricing structure.
Data & Methods
Our empirical analyses utilize institution- and student-level data to study the pricing behavior of non-elite private institutions. We begin by using both data sets to document the extent to which these institutions annually increase listed tuition and institutional grant aid. We then use student-level data to investigate whether and how non-elite private institutions employ net price differentials by year of study. Both data sets include non-elite private nonprofit, four-year, degree-granting, Title IV eligible higher education institutions with a Carnegie classification of Doctoral, Master’s, or Baccalaureate. We define non-elite institutions as those outside of the top 50 in the U.S. News rankings of liberal arts colleges and national universities. 9
The Integrated Postsecondary Education Data System (IPEDS) is our source for institution-level data because it contains detailed, annual measures of listed tuition and institutional grant aid for the 2001/02 to 2018/19 period. These measures are based on first-time, full-time, degree-seeking undergraduate students. Because we are interested in making comparisons over time, we omit 116 institutions with missing tuition or institutional aid data during our period of study. Our sample for institution-level analyses includes 779 non-elite, private, four-year institutions.
We use student-level data from seven collections of the National Postsecondary Student Aid Survey (NPSAS): 1992/93, 1995/96, 1999/00, 2003/04, 2007/08, 2011/12, and 2015/16. NPSAS is a nationally representative survey providing detailed information on how students pay for postsecondary education. We first use NPSAS data to complement our analyses of IPEDS data by examining how tuition and institutional grant aid levels change over time for first-time, full-time degree-seeking undergraduate students who attend the same institution for the entire year. We then turn to our primary use of NPSAS data to examine whether and how non-elite private institutions charge net price differentials by year of study. For these analyses, we further restrict our sample by excluding independent students, student who receive athletic scholarships, students who receive VA or Department of Defense benefits, and students who are missing data for the variables used in our analyses. 10 Our final sample contains 26,270 students when observations are pooled across years.
To examine the presence and structure of differential pricing by year of study, we estimate regression models using NPSAS for three different outcome variables: net tuition price (equal to listed tuition minus institutional grant aid), listed tuition, and institutional grant aid. Across all models, our independent variables of interest, year of study dummy variables, are derived from an indicator representing the number of years since a student enrolled at any postsecondary institution. This indicator serves as a proxy for our desired measure—the number of years since a student enrolled at her current postsecondary institution—which does not exist in NPSAS. This limitation in our data set is relatively minor, because around 90% of the students in our sample started at their current institution. 11
To explore whether this limitation might be impacting our results, we also examine two alternative specifications with a different set of limitations. 12 First, we use alternative year of study variables that are derived from a measure that is based on total credit accumulation. Second, we use our primary year of study variables but restrict analysis to students whose current institution is also their first institution. As we will describe in our results section, our findings are similar across these various specifications.
In all our regressions, we include a range of control variables to address a second limitation of our data set. A complete analysis of pricing structures would include an examination of tuition and aid levels for the same student across multiple years, yet NPSAS—the only nationally representative data set on how students finance postsecondary education—is cross-sectional and such year-to-year comparisons among the same set of students are not possible. Although we can still shed great light into pricing structures using comparisons between students in different years of study, we need to take great care when making such comparisons. One concern relates to between-institution comparisons. Students who attend more selective institutions, which often charge higher listed tuition prices and award larger need-based aid grants, may be more likely to persist than similar students who attend less-selective institutions. Because the inclusion of between-institution comparisons could misstate true differences in tuition and aid levels by year of study at individual institutions, we include institution-level fixed effects so that we rely solely upon within-institution comparisons.
These within-institution comparisons may also be hampered by attrition. 13 Each entering cohort at an institution contains variation across students in their institutional grant awards. If students that receive lower grant awards disproportionately persist, then the average grant award for each cohort will be pushed downward as the students in the cohort advance in their studies. Such a pattern could produce net price differentials by year of study in cross-sectional data that are due to attrition rather than to the presence of an ever-increasing pricing structure.
We address this concern in two ways. First, we include the controls for observable determinants of listed tuition and institutional aid that also may relate to attrition: expected family contribution, SAT scores, student race/ethnicity, gender, first-generation college student status, whether or not the student attends an institution in her home state, and whether or not the student is from outside of the United States. Second, we examine whether a negative relationship between grant awards and retention actually exists by utilizing data from three different Beginning Postsecondary Students (BPS) surveys: BPS:96/01, BPS:04/09, and BPS:12/17. These surveys longitudinally track first-year students as they advance in their studies and contain information on students’ initial institutional grant award, their enrollment status during each of the six years that follow their initial enrollment, and their values for each of the control variables that we utilize in our NPSAS regressions. Consequently, we can use BPS data to examine whether a negative relationship exists between institutional grant awards and retention as a full-time full-year student in later years of study. 14
Results
A key feature of an ever-increasing pricing structure is annually increasing values for listed tuition and average institutional grant awards. The results in Table 3 clearly indicate that non-elite privates steadily increased both listed tuition and institutional aid for first-year full-time students between 2001/02 and 2018/19. The annual increases (in real dollars) for both items were typically between $400 and $800 during this period.
Mean Listed Tuition & Institutional Grant Aid at Non-Elite Four-Year Private Institutions, 2001/02-2018/19
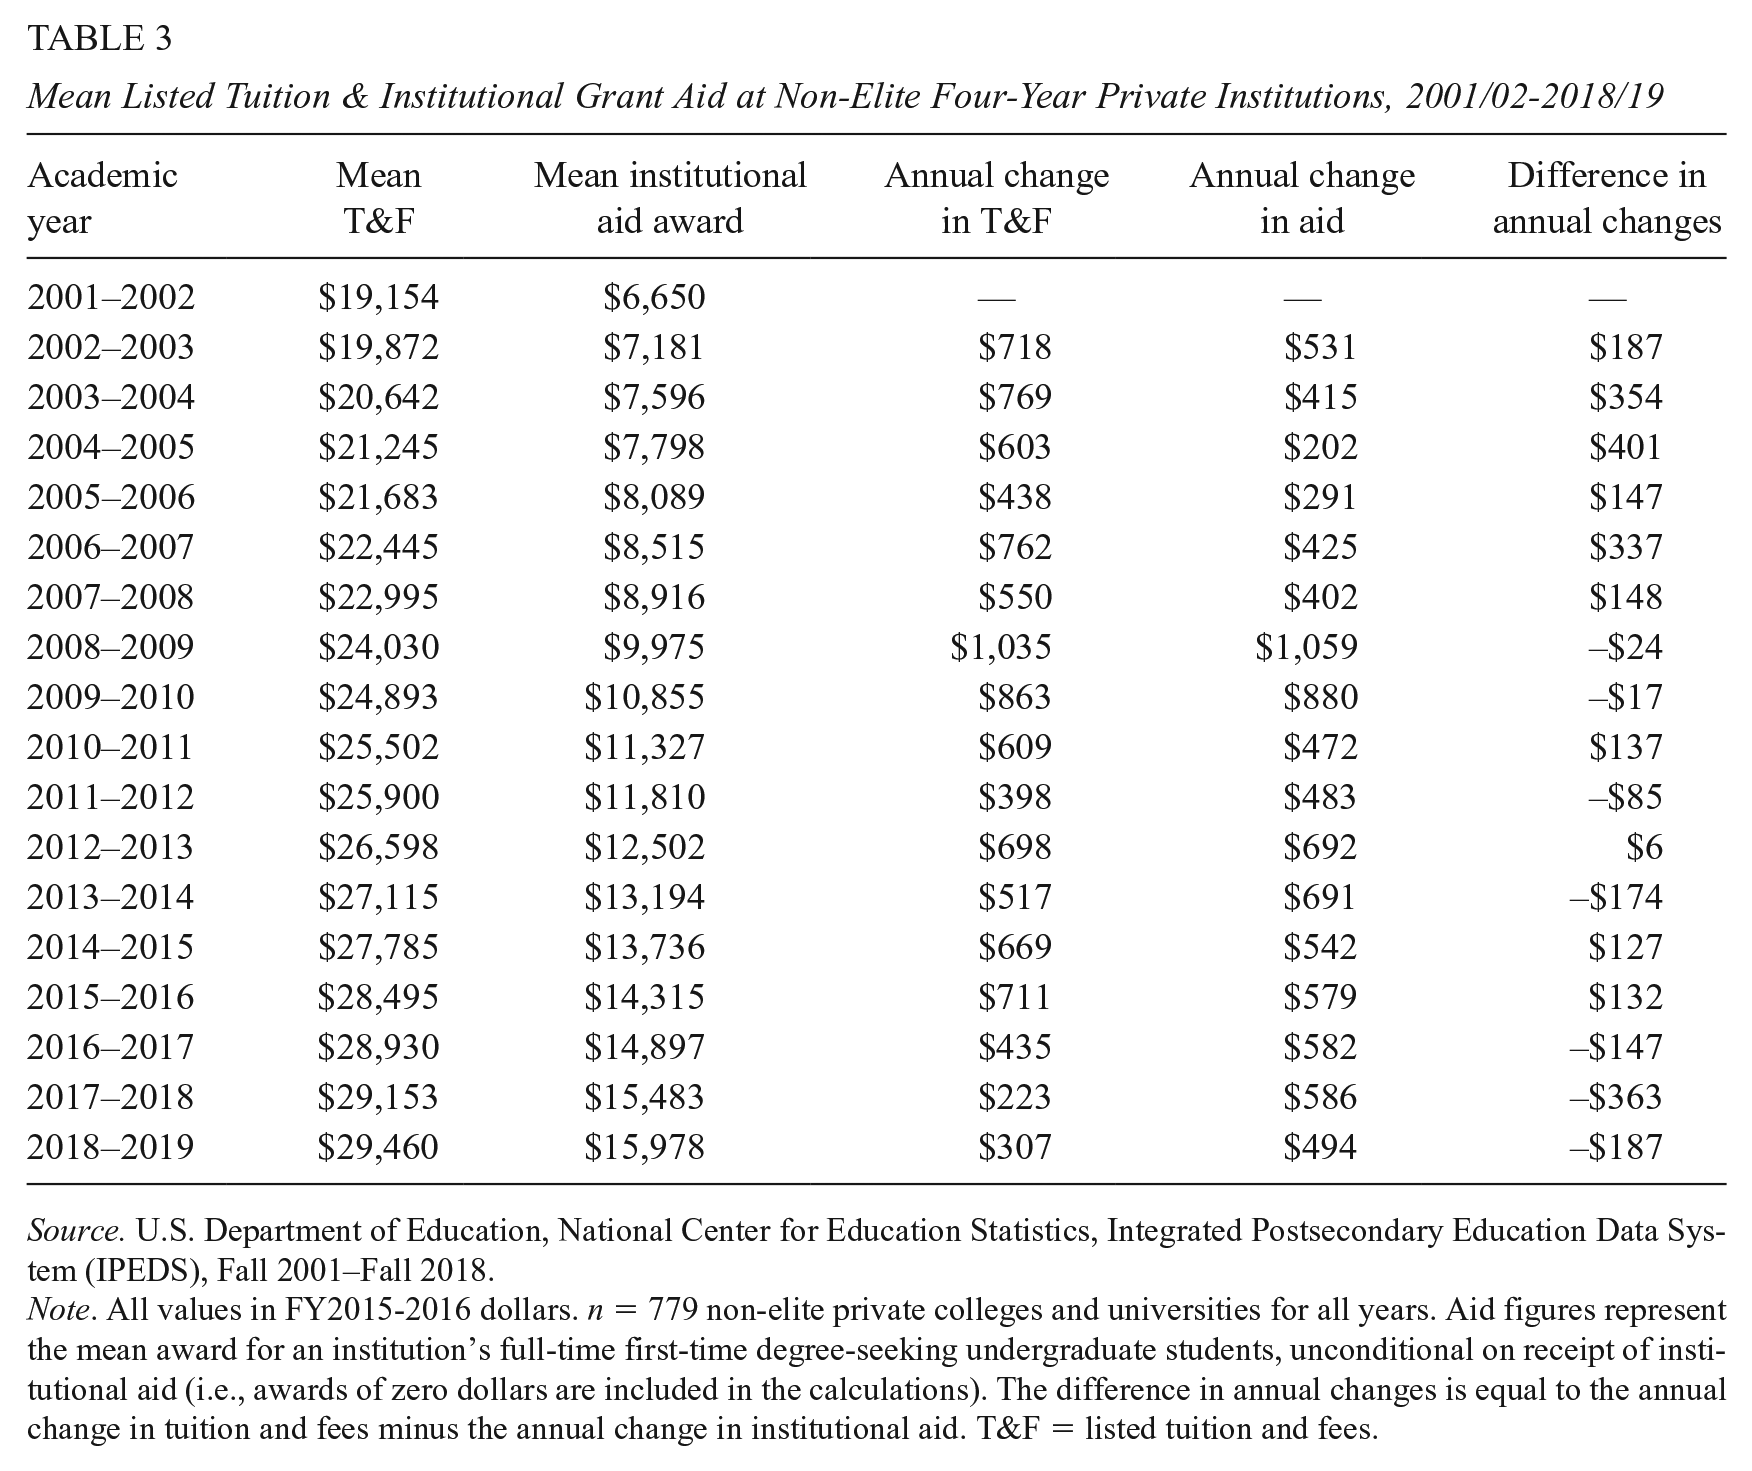
Source. U.S. Department of Education, National Center for Education Statistics, Integrated Postsecondary Education Data System (IPEDS), Fall 2001–Fall 2018.
Note. All values in FY2015-2016 dollars. n = 779 non-elite private colleges and universities for all years. Aid figures represent the mean award for an institution’s full-time first-time degree-seeking undergraduate students, unconditional on receipt of institutional aid (i.e., awards of zero dollars are included in the calculations). The difference in annual changes is equal to the annual change in tuition and fees minus the annual change in institutional aid. T&F = listed tuition and fees.
The relative increases shifted in 2007/08. For the 2001/02 to 2007/08 period, listed tuition increased by $3,841 while the average aid award increased by $2,266, which means that the per-student net tuition received from entering full-time students increased by $1,575. From 2007/08 to 2018/19 however, net tuition fell, as the cumulative growth in average institutional aid awards ($7,062) slightly exceeded the cumulative growth in listed tuition ($6,465). 15 This sharp difference in trends likely relates to changes in student demand that originated at the onset of the Great Recession. A portion of the shift over time is likely also due to the steady expansion of price discrimination, which leads to a steady decline in the net tuition revenue that can be generated through further price discrimination.
Figure 1 provides direct evidence that price discrimination within entering cohorts advanced during this period. Almost four-fifths of non-elite privates provided aid to more than 90% of their incoming full-time students in 2018/19, a drastic change from 2001/02, when less than two-fifths of non-elite privates provided aid to more than 90% of their incoming full-time students. The share of incoming students receiving institutional aid steadily increased over this period to the point where many institutions were offering aid to 100% of their incoming full-time students. The share of institutions offering universal aid increased dramatically between 2001/02 and 2018/19, moving from 4% to 35%. In total, Figure 1 indicates that a progressively smaller share of students is paying the full listed tuition price at non-elite private institutions.
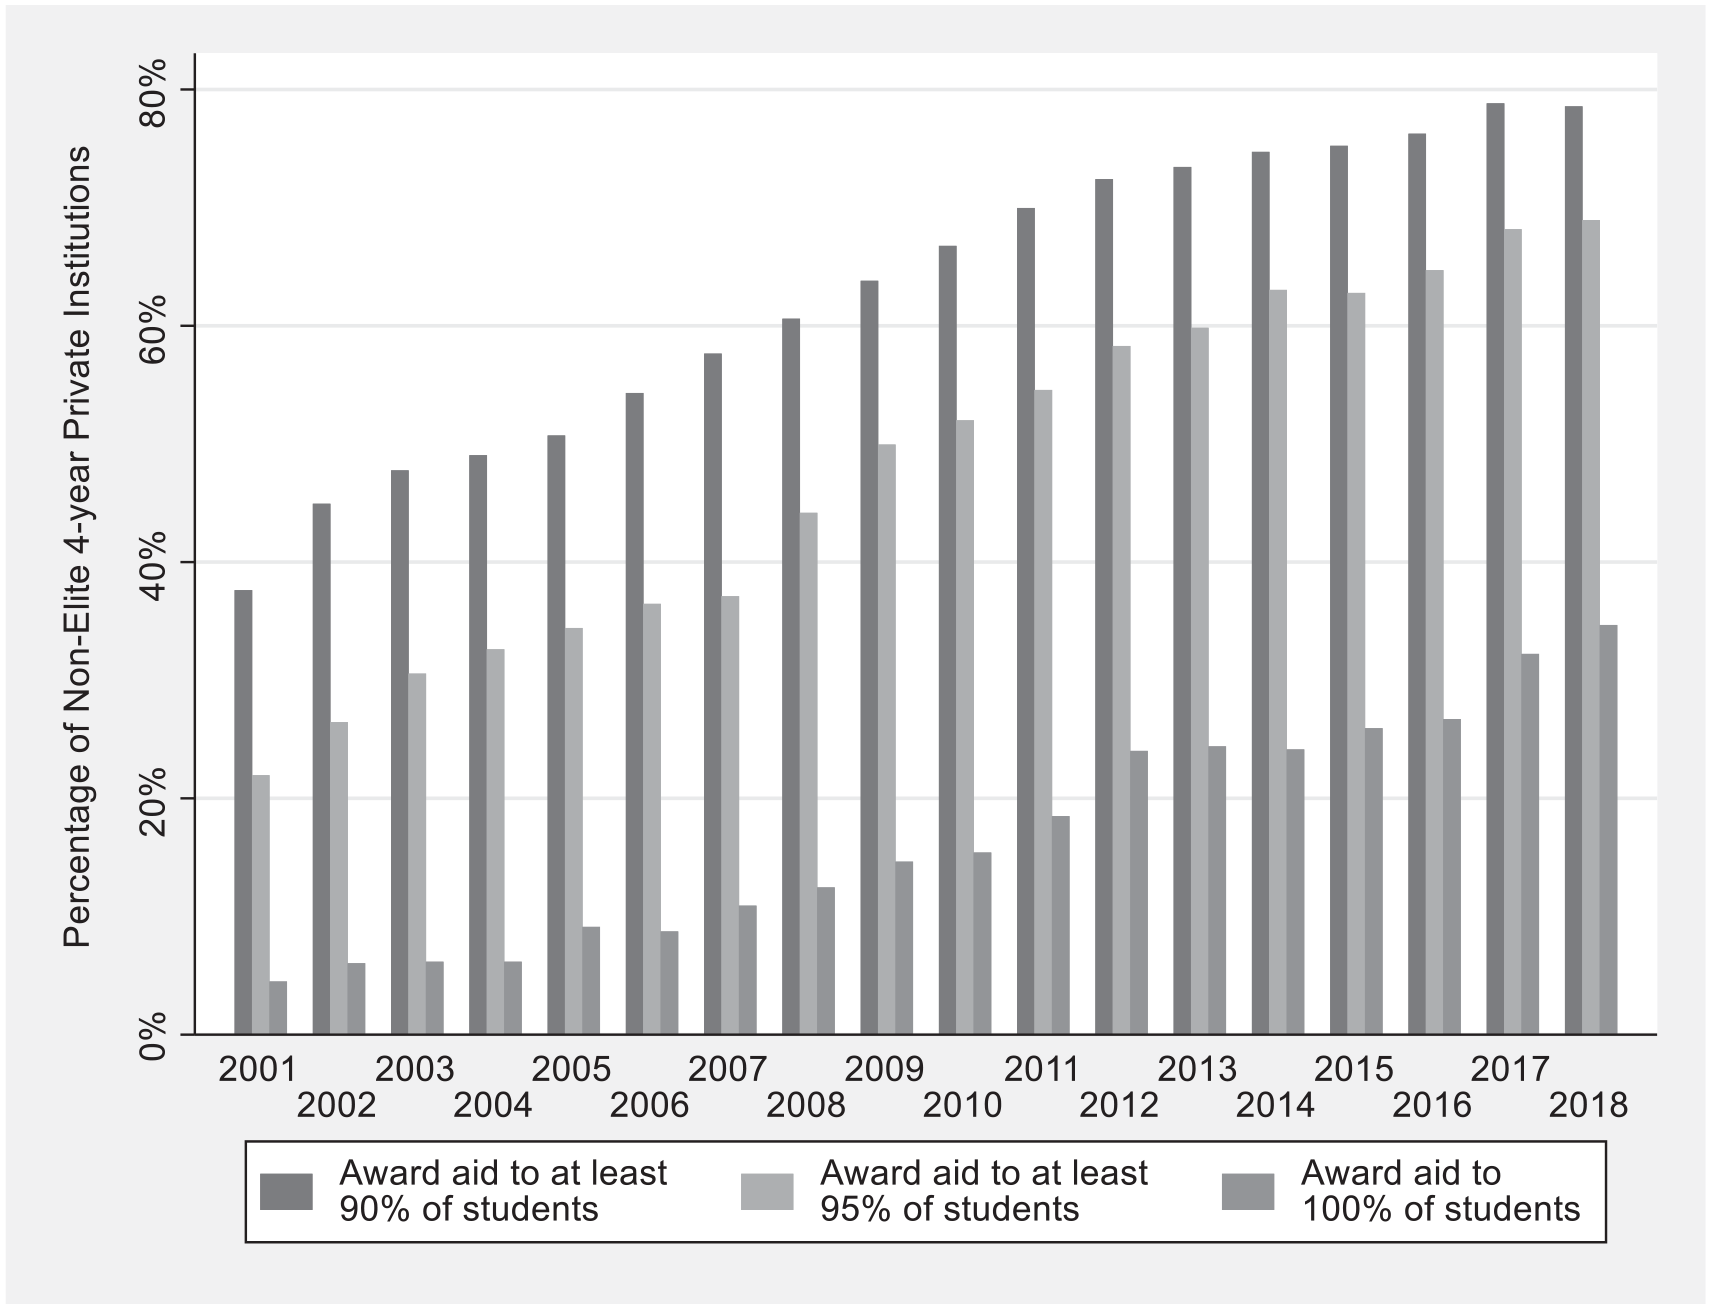
Changes in the provision of institutional grant aid at non-elite four-year private institutions, 2001/02–2018/19.
The trends observed in IPEDS data are also present in NPSAS data. For seven different NPSAS surveys, Table 4 reports mean listed tuition and institutional aid for first-time full-time students at non-elite private institutions. The results again reveal that both listed tuition and institutional aid steadily increased over time, and that this growth occurred even though the share of students receiving institutional aid is approaching 100%. 16
Mean Listed Tuition & Institutional Grant Aid at Non-Elite Four-Year Private Institutions, NPSAS Years
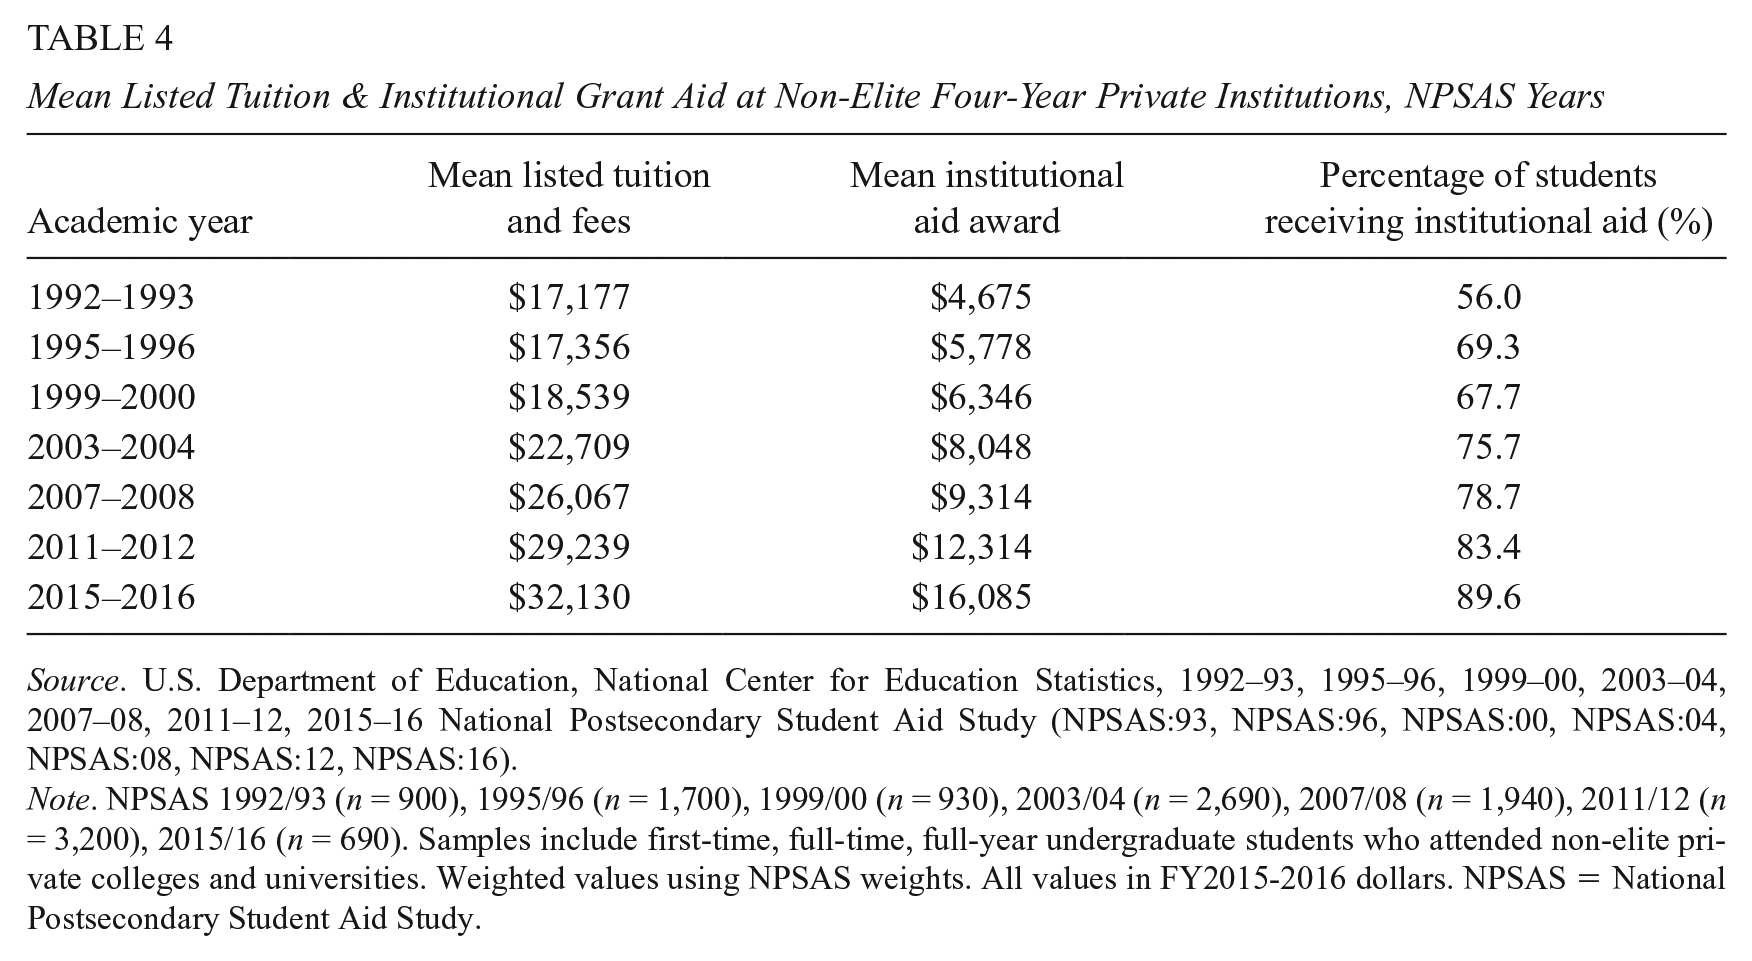
Source. U.S. Department of Education, National Center for Education Statistics, 1992–93, 1995–96, 1999–00, 2003–04, 2007–08, 2011–12, 2015–16 National Postsecondary Student Aid Study (NPSAS:93, NPSAS:96, NPSAS:00, NPSAS:04, NPSAS:08, NPSAS:12, NPSAS:16).
Note. NPSAS 1992/93 (n = 900), 1995/96 (n = 1,700), 1999/00 (n = 930), 2003/04 (n = 2,690), 2007/08 (n = 1,940), 2011/12 (n = 3,200), 2015/16 (n = 690). Samples include first-time, full-time, full-year undergraduate students who attended non-elite private colleges and universities. Weighted values using NPSAS weights. All values in FY2015-2016 dollars. NPSAS = National Postsecondary Student Aid Study.
Having established that listed tuition and institutional aid have increased steadily in recent decades at non-elite private institutions, we now investigate whether and how these institutions employ net price differentials by year of study. Table 5 reports regressions that examine how net tuition and fees, listed tuition and fees, and institutional grant aid vary by a student’s year of study. The first column contains the results for a pooled regression. The regression results for net tuition and fees reveal that non-elite privates engage in differential net pricing by year of study. Net prices clearly increase by year of study, with the coefficient for second-year students equal to $724, the third-year coefficient equal to $1,142, and the fourth-year coefficient equal to $1,626. The second set of regression results—where listed tuition and fees is the dependent variable—show that differential net pricing is not due to differential listed tuition. Not only are the year of study coefficients statistically insignificant, but the coefficients are very close to zero in magnitude. In contrast, the last set of regression results in Table 5 signify that non-elite privates provide differential institutional aid. Institutional grant awards are negatively related to years of study, with the average coefficient for second-year students equaling –$752, the average third-year coefficient equaling –$1,120, and the average fourth-year coefficient equaling –$1,542. 17
The Relationship Between Pricing and Year of Study at Non-Elite Four-Year Private Institutions
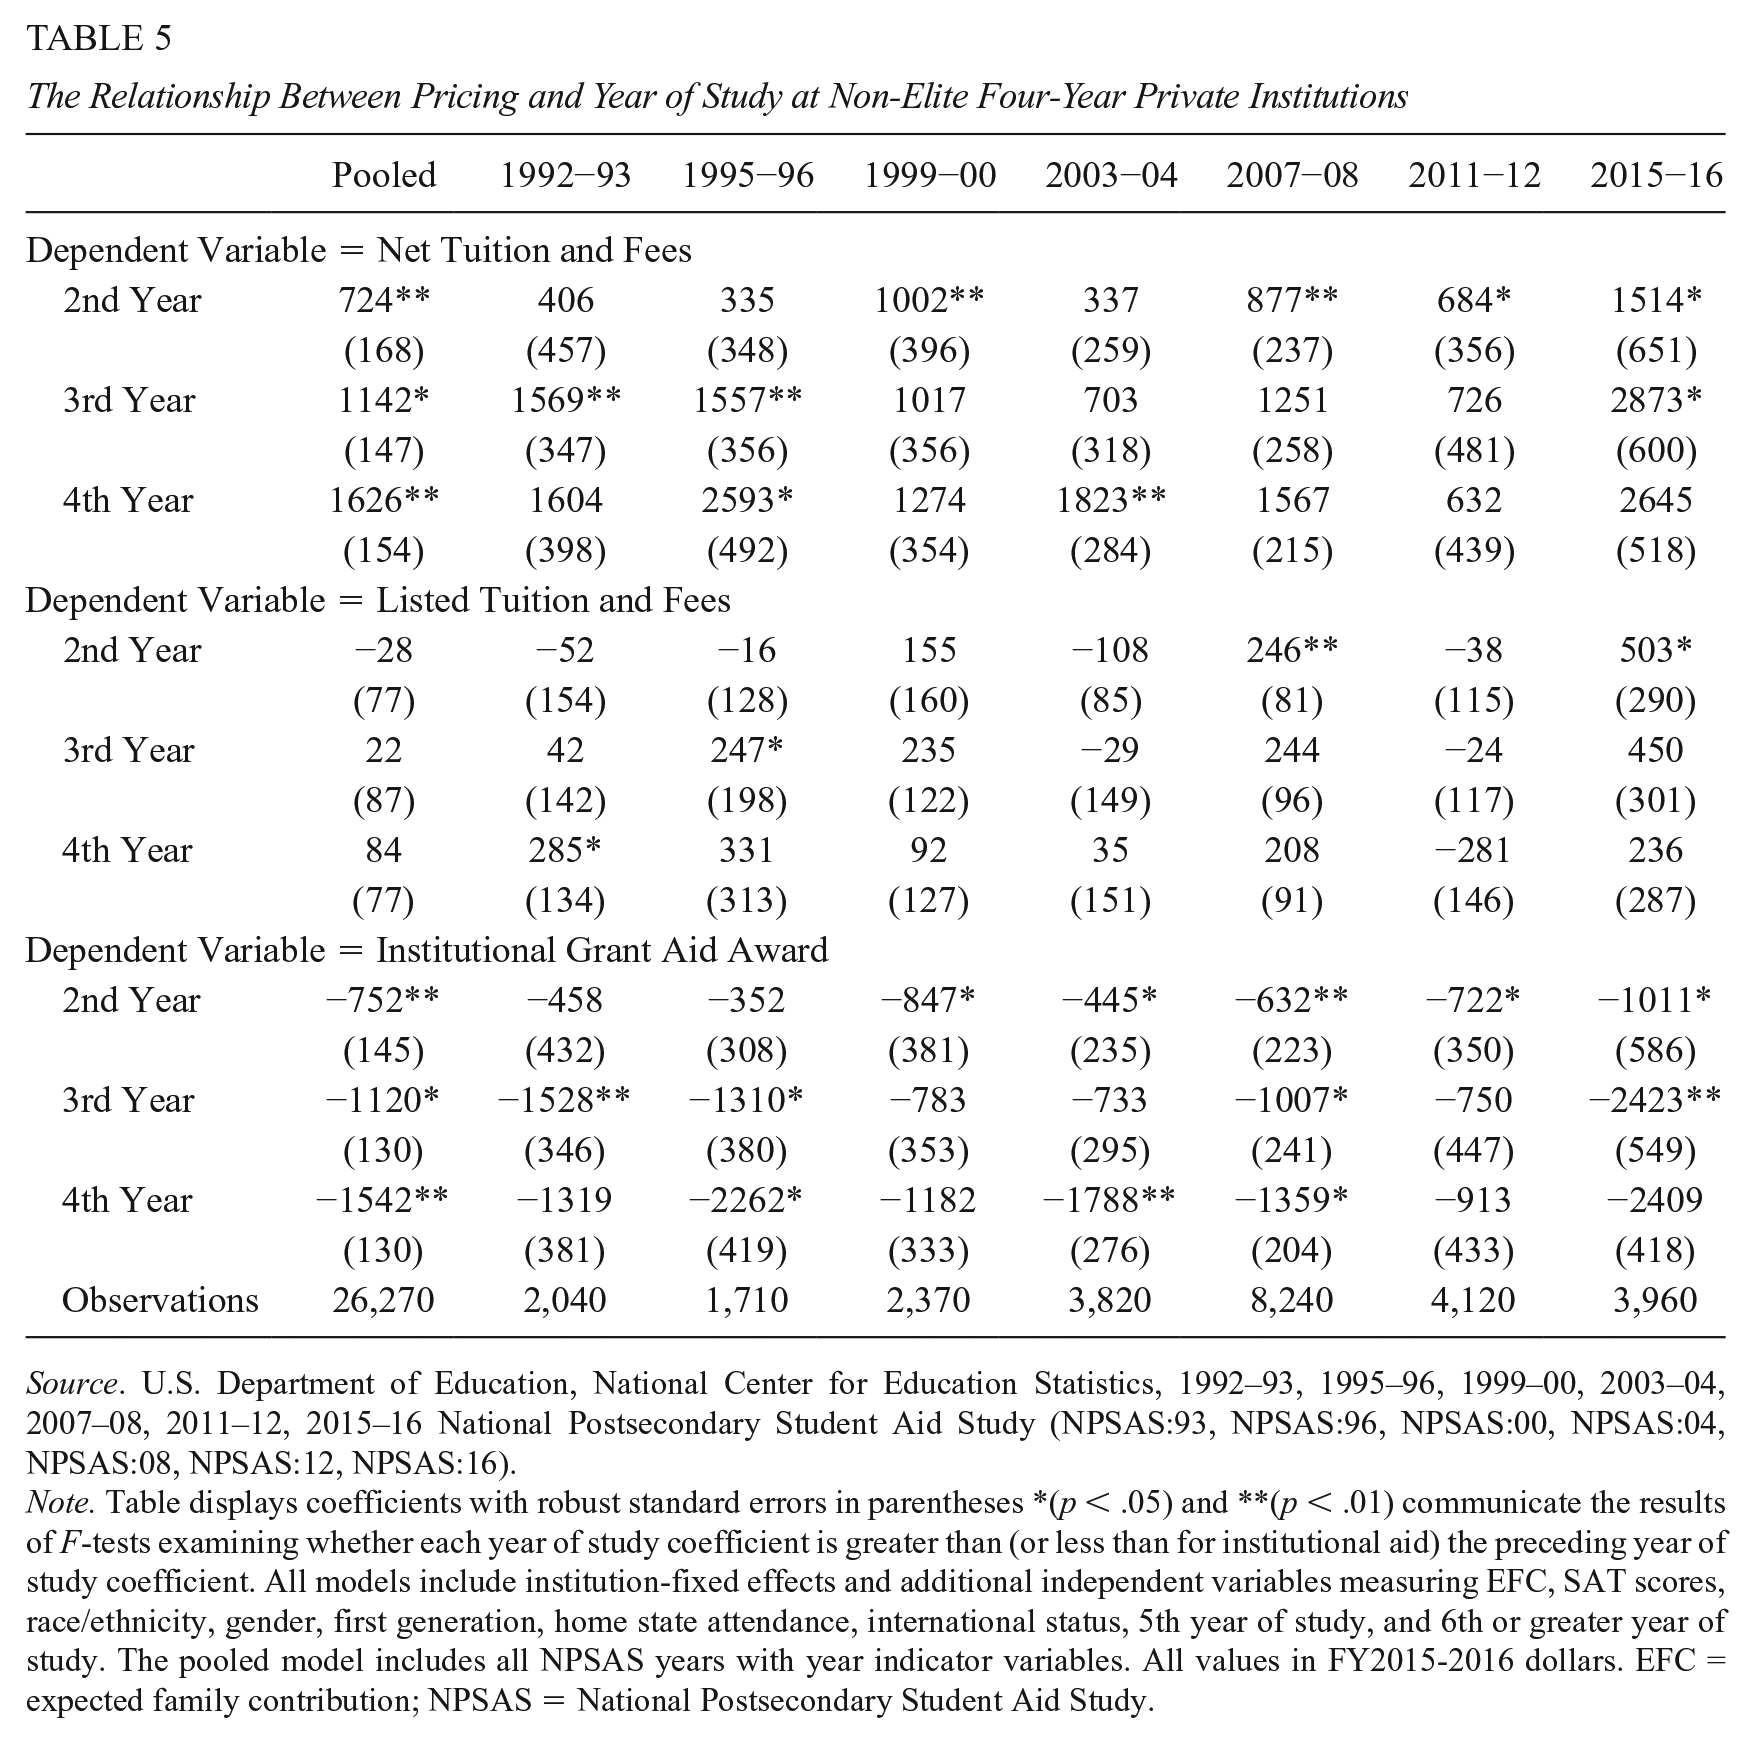
Source. U.S. Department of Education, National Center for Education Statistics, 1992–93, 1995–96, 1999–00, 2003–04, 2007–08, 2011–12, 2015–16 National Postsecondary Student Aid Study (NPSAS:93, NPSAS:96, NPSAS:00, NPSAS:04, NPSAS:08, NPSAS:12, NPSAS:16).
Note. Table displays coefficients with robust standard errors in parentheses *(p < .05) and **(p < .01) communicate the results of F-tests examining whether each year of study coefficient is greater than (or less than for institutional aid) the preceding year of study coefficient. All models include institution-fixed effects and additional independent variables measuring EFC, SAT scores, race/ethnicity, gender, first generation, home state attendance, international status, 5th year of study, and 6th or greater year of study. The pooled model includes all NPSAS years with year indicator variables. All values in FY2015-2016 dollars. EFC = expected family contribution; NPSAS = National Postsecondary Student Aid Study.
Although the results in Table 5 establish that non-elite private institutions engage in net price differentials by year of study through differential institutional grant awards, this does not, by itself, imply that non-elite private institutions employ an ever-increasing pricing structure. We also need to demonstrate that the differential grant awards are generated by a combination of annual listed tuition increases, annual increases in first-year aid awards, and aid awards that are, on average, consistent over time for each cohort. Table 3 provided clear evidence regarding the first two of these three items. We cannot directly test for the last item, because available data sets such as NPSAS do not follow the same student across years of study, so we cannot examine the longitudinal structure of aid awards for individual students. That said, a comparison between Tables 3 and 5 provides indirect evidence into whether, on average, aid awards for individual students increase, decrease, or stay the same as these students advance to later years of study. The average changes in the annual statistics in Table 3 indicate that each entering class receives average aid awards that are around $550 more than the average aid awards received by the preceding entering class. If aid awards stay the same for students as they advance in their studies, then we should expect second-year students to receive $550 less than first-year students. We should similarly expect a difference of $1,100 when comparisons are made between first-year and third-year students and a difference of $1,650 when first-year and fourth-year students are compared. The coefficients for the pooled institutional grant regression in Table 5 are very similar to these numbers, which implies that the differential institutional grant awards observed in the Table 5 results are due to the use of an ever-increasing pricing structure rather than front-loaded aid awards.
For the results presented in Table 5, this consistency generally continues when we move from the pooled regressions to regressions that solely use data for individual years. We do not always find statistically significant differences between adjoining years of study coefficients and the coefficients do not always increase across individual years of study, but these patterns are not unexpected given the larger standard errors stemming from smaller sample sizes. The largest discrepancy from the pooled results is relatively small coefficients for the 3rd and 4th year of study indicators in 2011/12. This discrepancy may be due to the Great Recession, as 3rd and 4th year students from the 2011/12 academic year entered college during 2008 and 2009. Amid the uncertainty and challenging family finances of these years, private non-elites may have increased institutional grant offerings to incoming students.
Robustness Checks
As discussed in our data and methods section, our ideal measure of a student’s year of study would capture the number of years since a student first enrolled at her current institution. Because NPSAS does not contain our ideal measure, we instead use a measure that captures the number of years since a student first enrolled at any higher education institution. This limitation is unlikely to be a major driver of our results, because only 10% of NPSAS students at non-elite privates initially enrolled at another institution before transferring to their current institution. To further explore this limitation, we report several alternative specifications in Table 6; for ease of comparison, column 1 of Table 6 repeats the results from column 1 of Table 5 (the pooled sample).
Comparison With Alternative Year of Study Specifications
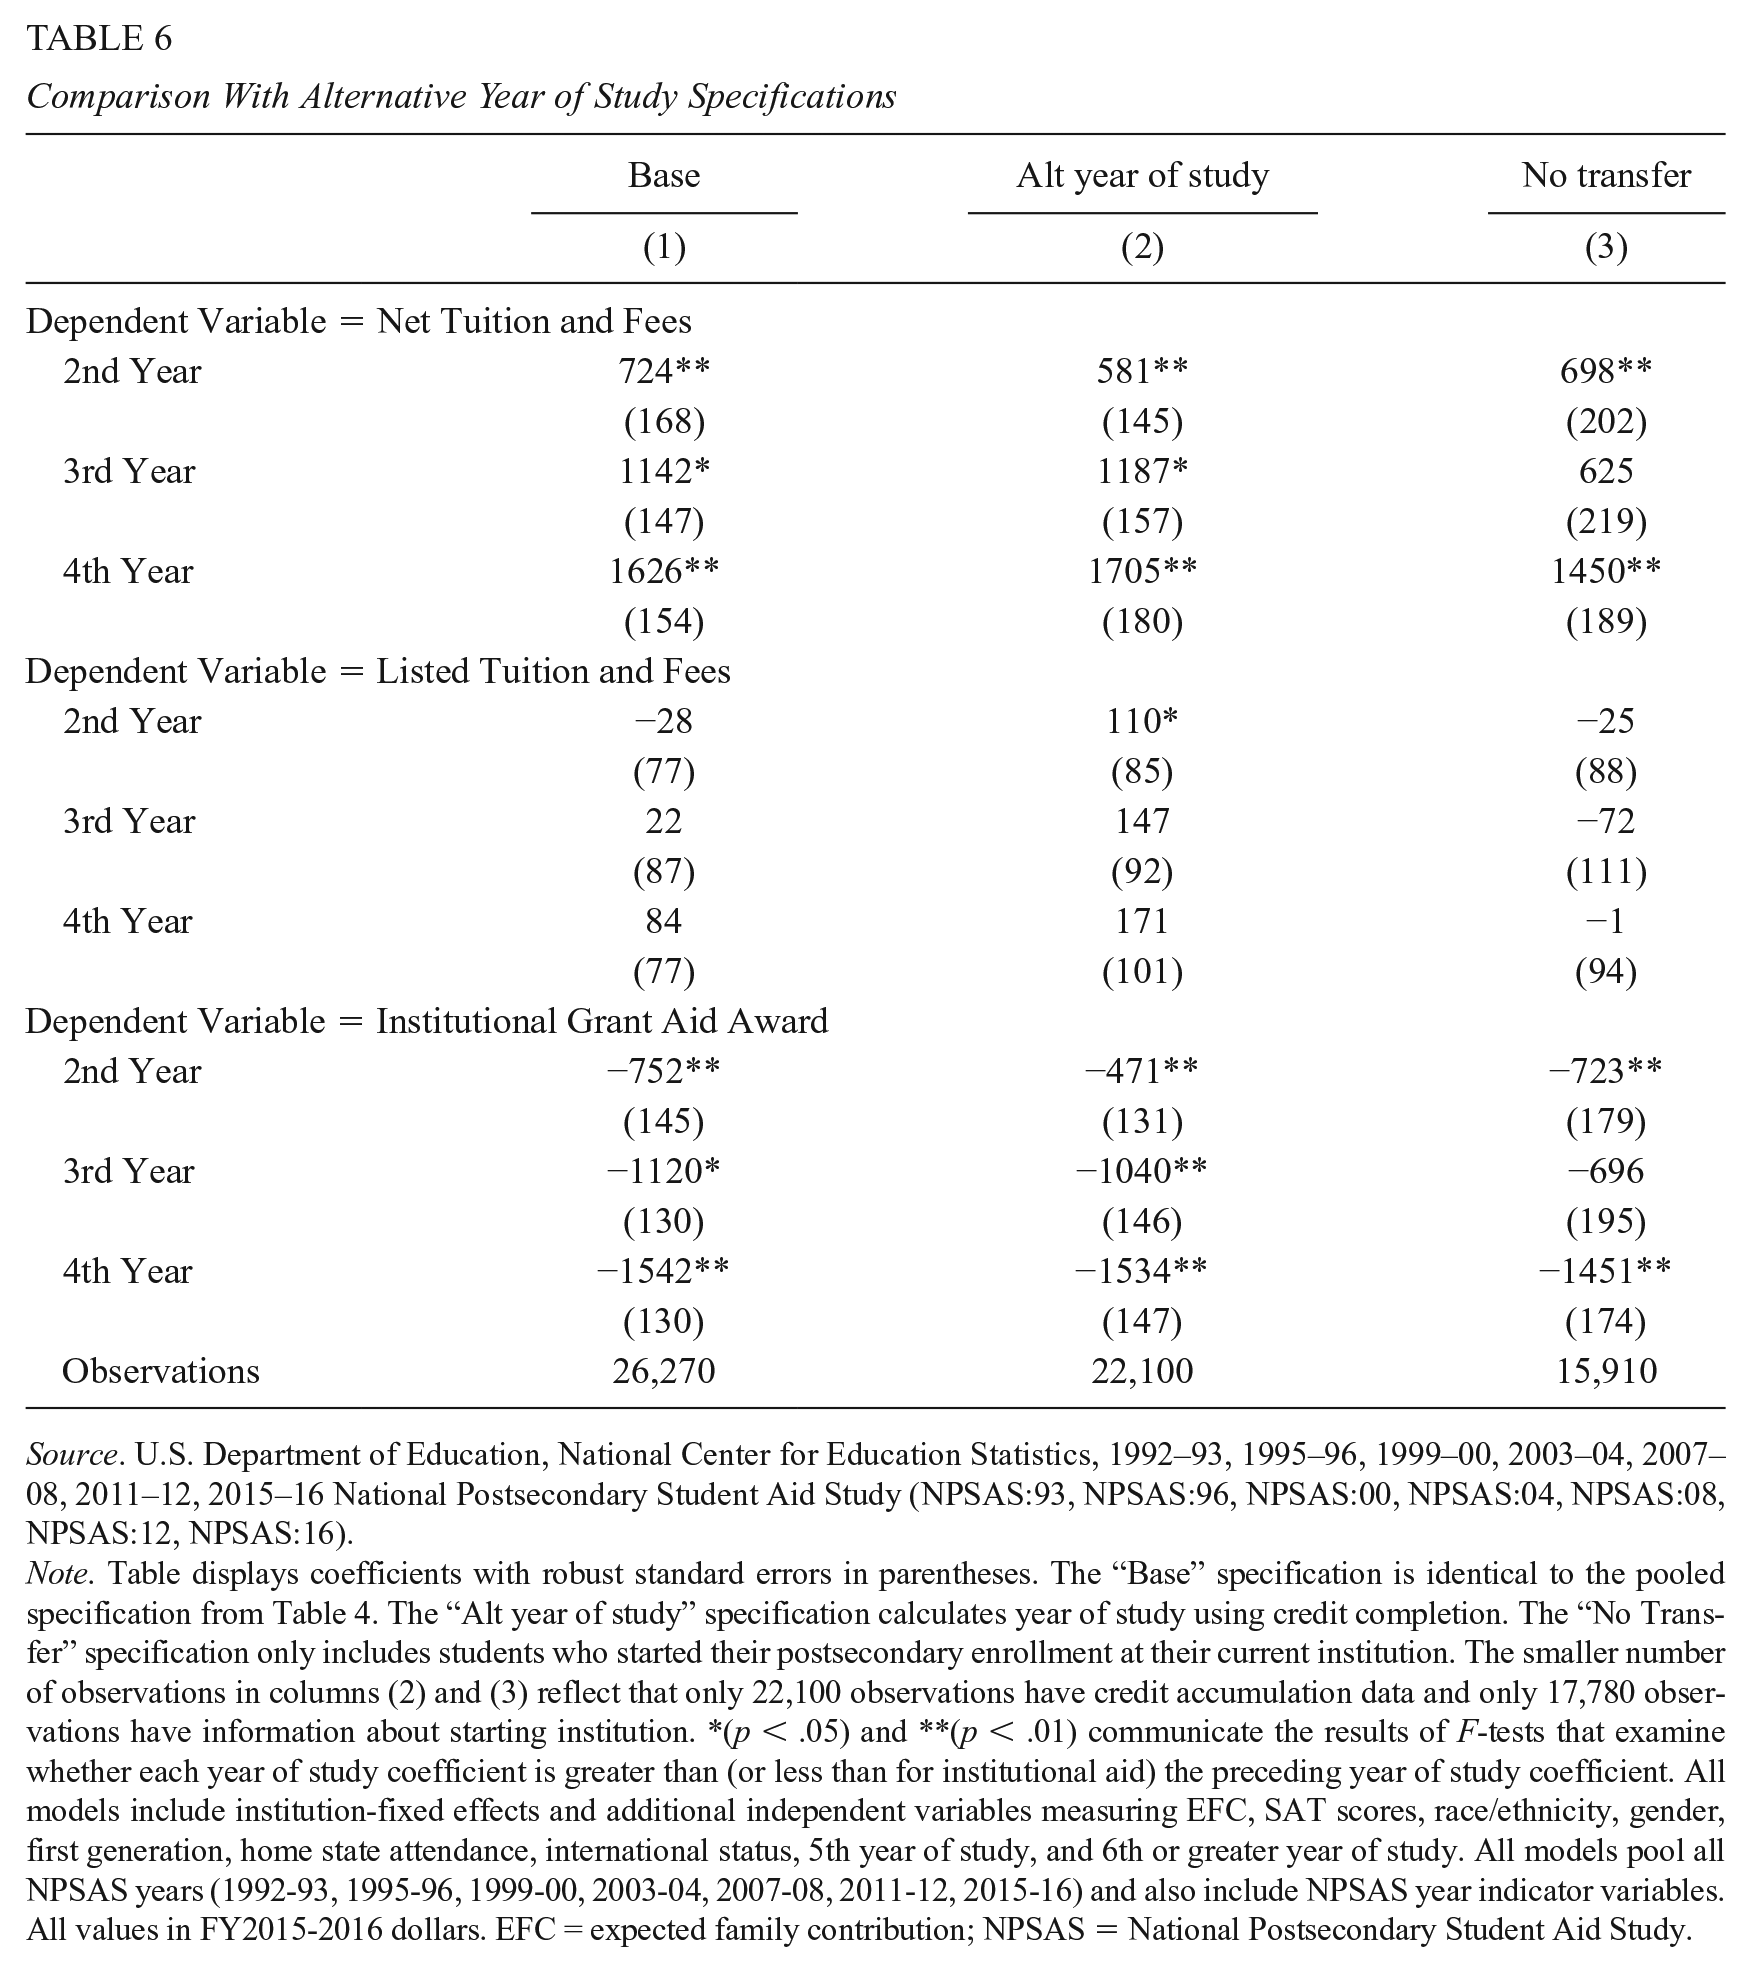
Source. U.S. Department of Education, National Center for Education Statistics, 1992–93, 1995–96, 1999–00, 2003–04, 2007–08, 2011–12, 2015–16 National Postsecondary Student Aid Study (NPSAS:93, NPSAS:96, NPSAS:00, NPSAS:04, NPSAS:08, NPSAS:12, NPSAS:16).
Note. Table displays coefficients with robust standard errors in parentheses. The “Base” specification is identical to the pooled specification from Table 4. The “Alt year of study” specification calculates year of study using credit completion. The “No Transfer” specification only includes students who started their postsecondary enrollment at their current institution. The smaller number of observations in columns (2) and (3) reflect that only 22,100 observations have credit accumulation data and only 17,780 observations have information about starting institution. *(p < .05) and **(p < .01) communicate the results of F-tests that examine whether each year of study coefficient is greater than (or less than for institutional aid) the preceding year of study coefficient. All models include institution-fixed effects and additional independent variables measuring EFC, SAT scores, race/ethnicity, gender, first generation, home state attendance, international status, 5th year of study, and 6th or greater year of study. All models pool all NPSAS years (1992-93, 1995-96, 1999-00, 2003-04, 2007-08, 2011-12, 2015-16) and also include NPSAS year indicator variables. All values in FY2015-2016 dollars. EFC = expected family contribution; NPSAS = National Postsecondary Student Aid Study.
The first alternative specification uses year of study indicators that are calculated using the number of credits that each student has completed. Due to missing credit attainment data, we lose around 4,000 students when we use this alternative set of indicators. Column 2 contains results for the alternative year of study indicators. Although the coefficients for these alternative indicator variables are smaller, we continue to find that institutional aid offers decline by amounts in the vicinity of $550 for each year of study and that these declines are statistically significant.
The second alternative specification uses the original year of study indicators but tries to minimize the limitation associated with these indicators by only examining students that reported starting at their current institution. Before removing any transfer students, we lose around 9,000 observations that are missing data on whether they initially enrolled at their current institution. Column 3 of Table 6 contains results for this smaller sample, which match the earlier results with one exception. The second-year and fourth-year coefficients roughly contain magnitudes of the expected size, but the coefficient for third-year students is smaller than expected and does not even exceed the second-year coefficient.
The regression results in Table 5 also have a second limitation not previously mentioned: When institutional aid is the dependent variable, this specification does not account for the fact that institutional aid contains a corner solution of zero. The issue is likely not driving our results because the share of students in our sample receiving no institutional aid is relatively small (19%). To ensure that our results for institutional grant aid also hold for alternative models with different limitations, we also estimated several Tobit models. 18 The results for these models, which are in Table A2 of the Online Supplementary Files, find negative year of study coefficients that are slightly larger in magnitude but generally similar to the coefficients in Table 5.
Analysis of Attrition Patterns
In our data and methods section, we noted that our results could be partially driven by attrition if students with lower institutional grant awards disproportionately persist. To examine whether institutional grant awards and retention do possess a negative relationship, Table 7 contains regressions results from three different BPS surveys. 19 For each survey, the regressions examine whether beginning students maintain full-time full-year enrollment in each of the subsequent three years after their first year of study. The results do not suggest that students with lower first-year institutional grant awards disproportionately persist. A negative relationship between grant aid and retention is only observed within one of the nine regressions, and the magnitude of that one negative coefficient is very small. In contrast, the eight positive coefficients are larger in magnitude and statistically significant in three cases. These results suggest that if attrition is impacting the NPSAS results for institutional grant aid in Tables 5 and 6, the effect is to restrain rather than contribute to the negative year of study coefficients.
The Relationship Between First-Year Institutional Aid and Retention at Non-Elite Four-Year Private Institutions
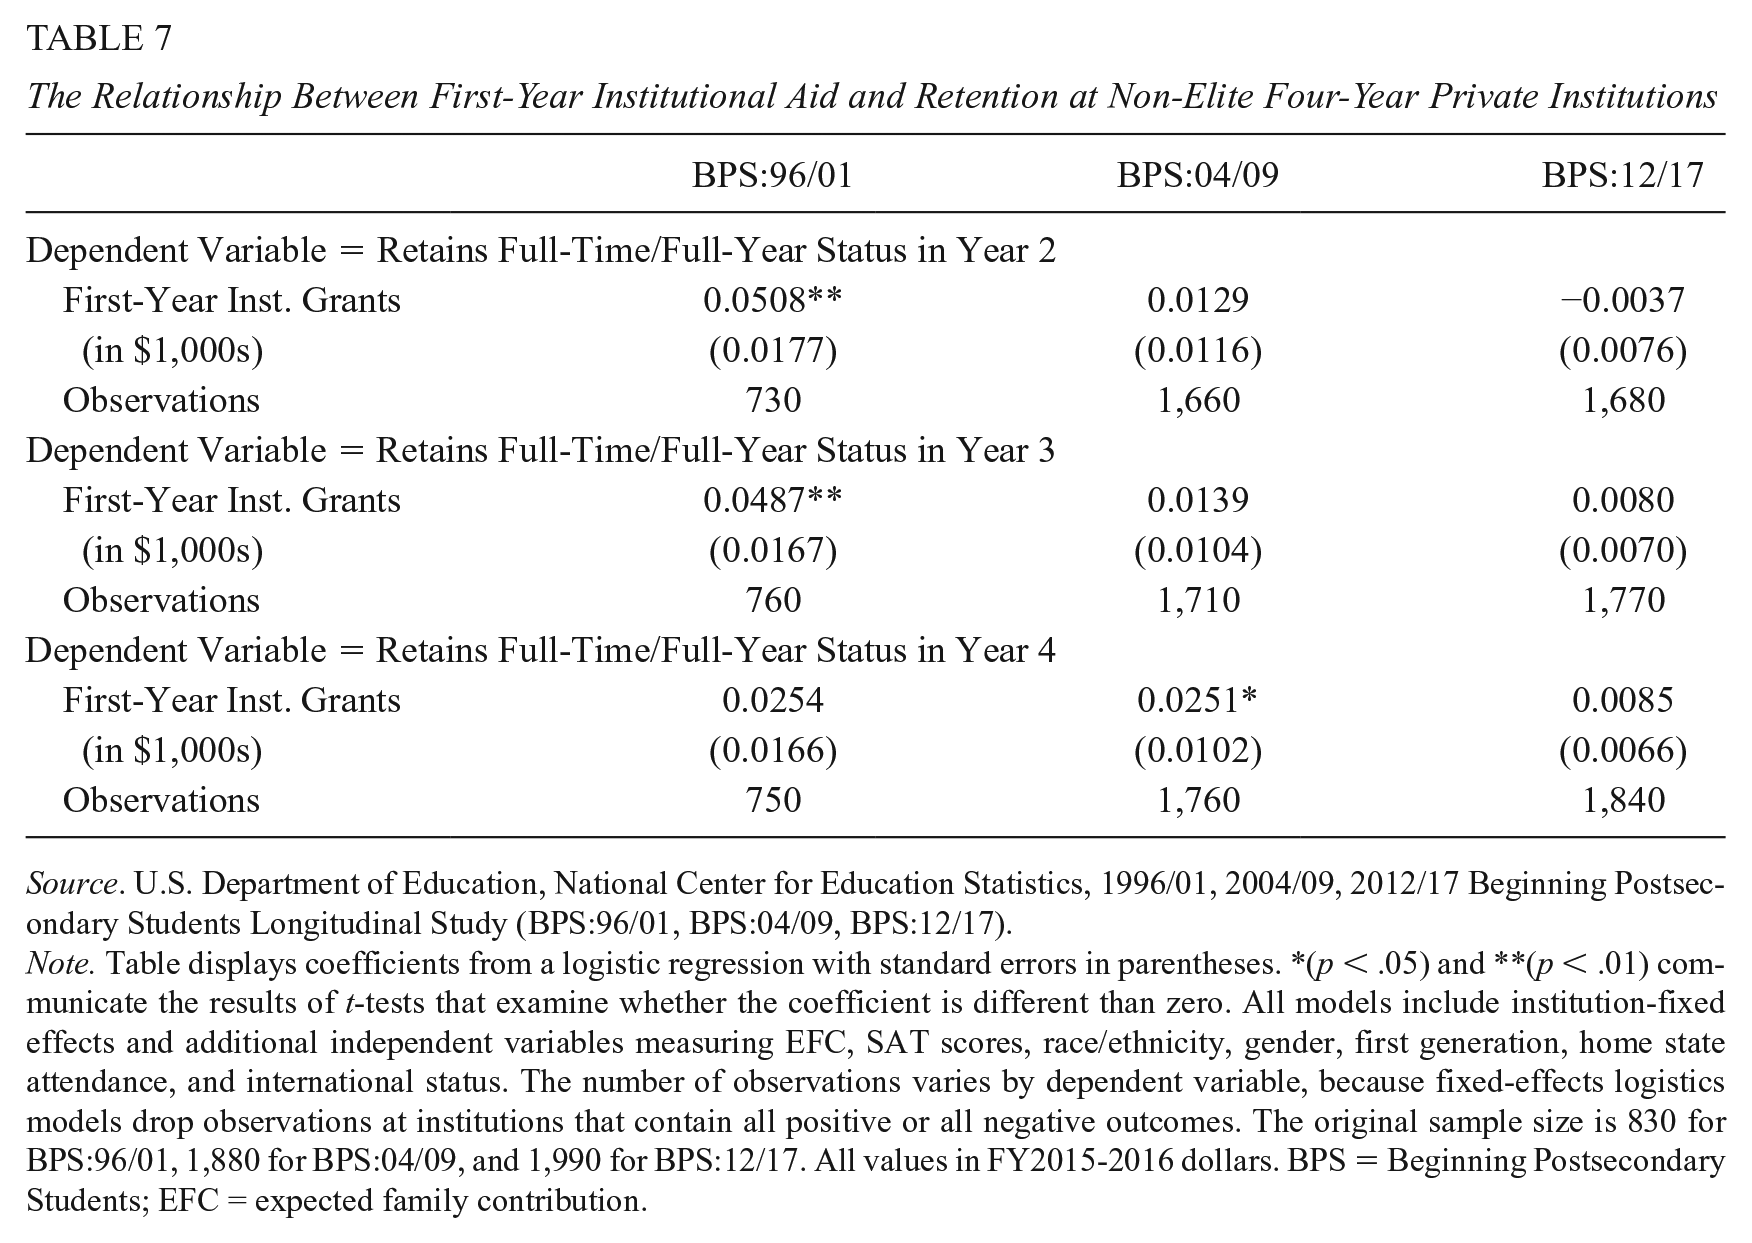
Source. U.S. Department of Education, National Center for Education Statistics, 1996/01, 2004/09, 2012/17 Beginning Postsecondary Students Longitudinal Study (BPS:96/01, BPS:04/09, BPS:12/17).
Note. Table displays coefficients from a logistic regression with standard errors in parentheses. *(p < .05) and **(p < .01) communicate the results of t-tests that examine whether the coefficient is different than zero. All models include institution-fixed effects and additional independent variables measuring EFC, SAT scores, race/ethnicity, gender, first generation, home state attendance, and international status. The number of observations varies by dependent variable, because fixed-effects logistics models drop observations at institutions that contain all positive or all negative outcomes. The original sample size is 830 for BPS:96/01, 1,880 for BPS:04/09, and 1,990 for BPS:12/17. All values in FY2015-2016 dollars. BPS = Beginning Postsecondary Students; EFC = expected family contribution.
Comparisons With Other Institutional Types
Table 8 reports separate regressions estimated for different institutional types, which allows for comparisons between the pricing structure used by non-elite privates and the pricing structure used by other types of institutions. 20 The first comparison is with elite (i.e., top 50) private institutions. The results indicate that neither listed tuition or institutional grant aid systematically vary by year of study. As noted earlier, elite privates may feel little pressure to implement net price differentials by year of study due to their financial wealth and strong student demand.
Comparisons by Institutional Types
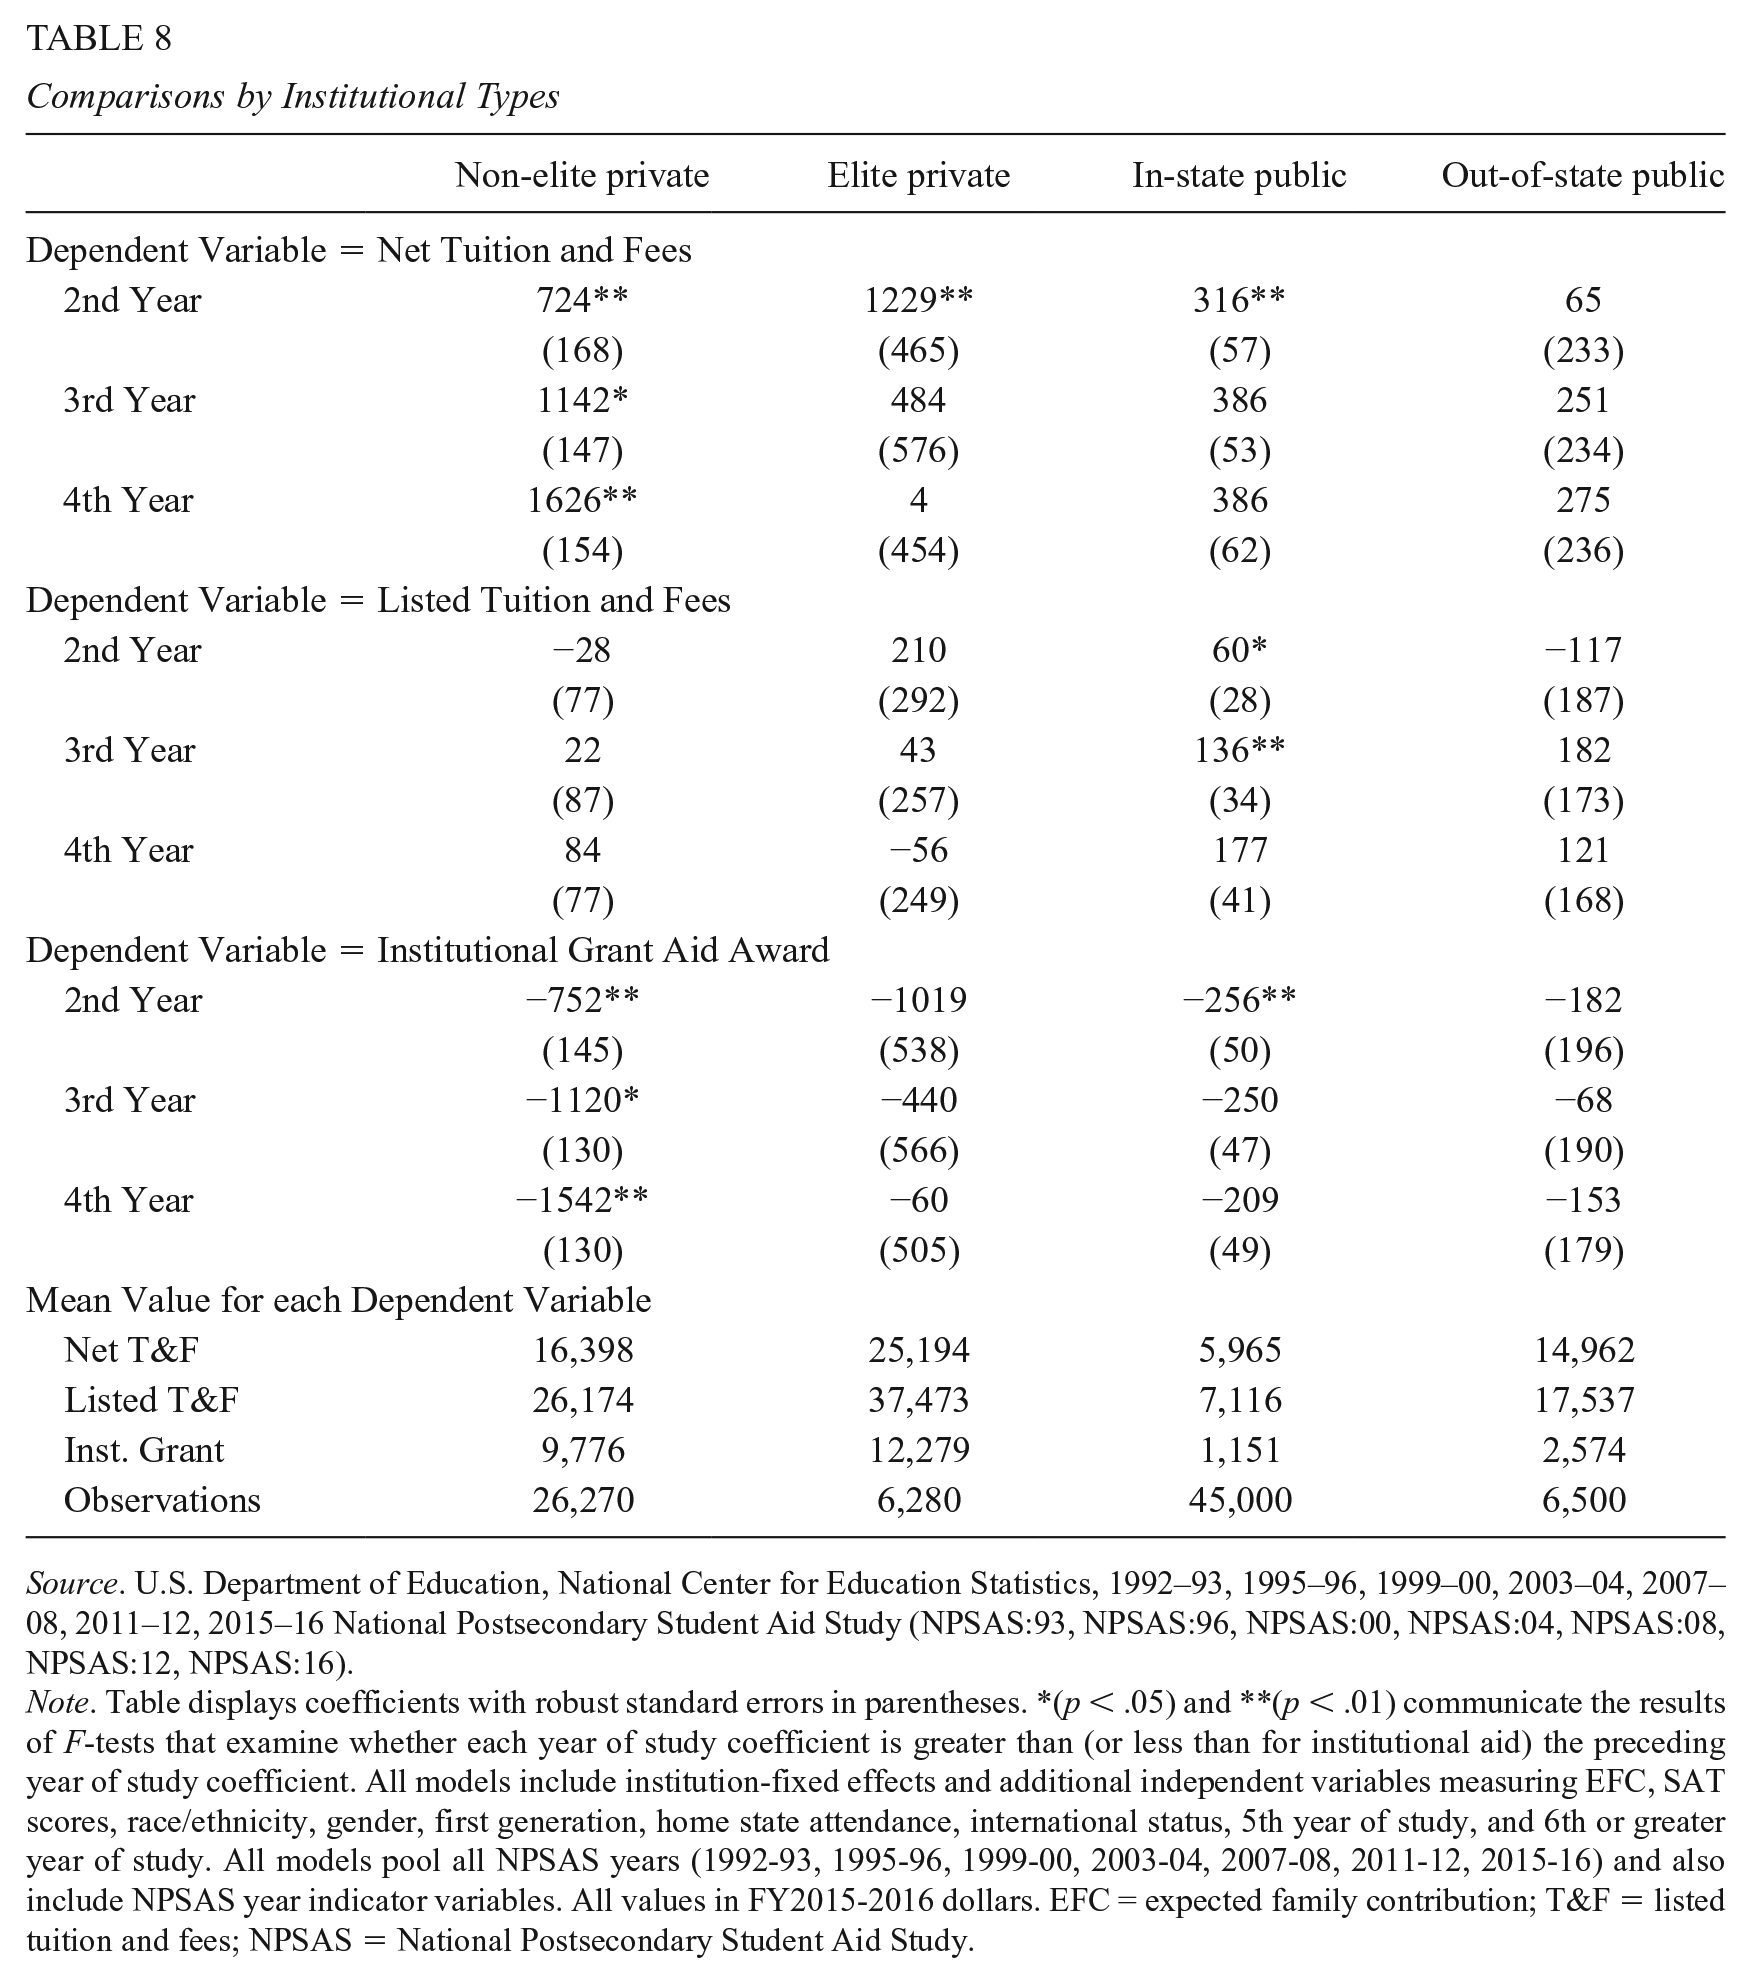
Source. U.S. Department of Education, National Center for Education Statistics, 1992–93, 1995–96, 1999–00, 2003–04, 2007–08, 2011–12, 2015–16 National Postsecondary Student Aid Study (NPSAS:93, NPSAS:96, NPSAS:00, NPSAS:04, NPSAS:08, NPSAS:12, NPSAS:16).
Note. Table displays coefficients with robust standard errors in parentheses. *(p < .05) and **(p < .01) communicate the results of F-tests that examine whether each year of study coefficient is greater than (or less than for institutional aid) the preceding year of study coefficient. All models include institution-fixed effects and additional independent variables measuring EFC, SAT scores, race/ethnicity, gender, first generation, home state attendance, international status, 5th year of study, and 6th or greater year of study. All models pool all NPSAS years (1992-93, 1995-96, 1999-00, 2003-04, 2007-08, 2011-12, 2015-16) and also include NPSAS year indicator variables. All values in FY2015-2016 dollars. EFC = expected family contribution; T&F = listed tuition and fees; NPSAS = National Postsecondary Student Aid Study.
The final two columns of Table 8 contain results for public institutions. Separate regressions are presented for in-state and out-of-state students, because listed tuition and fees vary across these two student groups and other aspects of the pricing structure may vary as well. For-in-state students, we find some evidence of net price differentials by year of study. Listed tuition prices rise by around $60 for each year of study, which is consistent with findings by Ehrenberg (2012) and Simone (2010) that a small share of public institutions charge differential tuition by year of study. For institutional grant aid, we find that students in their second, third, and fourth year of study receive around $250 less grant aid, on average, than first-year students. This finding is consistent with the use of front-loaded aid awards that provide extra funding only for the first year of study. The size of the differentials ($250) becomes more noteworthy when compared to the size of the average institutional grant award ($1,151) provided to in-state students. We do not detect the use of differential listed tuition or differential institutional grant awards for out-of-state students at public institutions, but slight differentials would be difficult to detect for these students due to imprecision stemming from a smaller sample size.
Comparisons With Other Attendance Types
Our regression results focus solely on full-time dependent students who attend the same institution for the entire year, because the inclusion of part-time, part-year, or independent students would make the results more challenging to interpret. Part-time and part-year students face much lower levels of listed tuition than full-time full-year students. Expected family contribution is calculated very differently for dependent students than for independent students. Separate regressions cannot be performed for each attendance status, because sample sizes are too low for every category other than full-time full-year dependent students.
Consequently, our results only inform claims about the pricing structure for full-time dependent students who attend the same institution for the entire year. At non-elite private institutions, this set of students is highly relevant because they comprise around two-thirds of full-time equivalent (FTE) enrollments. 21 Although we cannot perform separate regression analyses for the categories constituting the other one-third of FTE enrollments, we can report the share of students receiving institutional grant aid for each category.
Figure 2 reports these shares for the 2015/16 academic year and reveals major differences by attendance status. Eight-seven percent of full-time full-year dependent students receive aid, which far outpaces the share of students receiving aid in the part-time full-year dependent category (68%), the full-time part-year dependent category (67%), and the full-time full-year independent category (44%). For the four remaining categories, the share of students receiving aid never exceeds one-third.
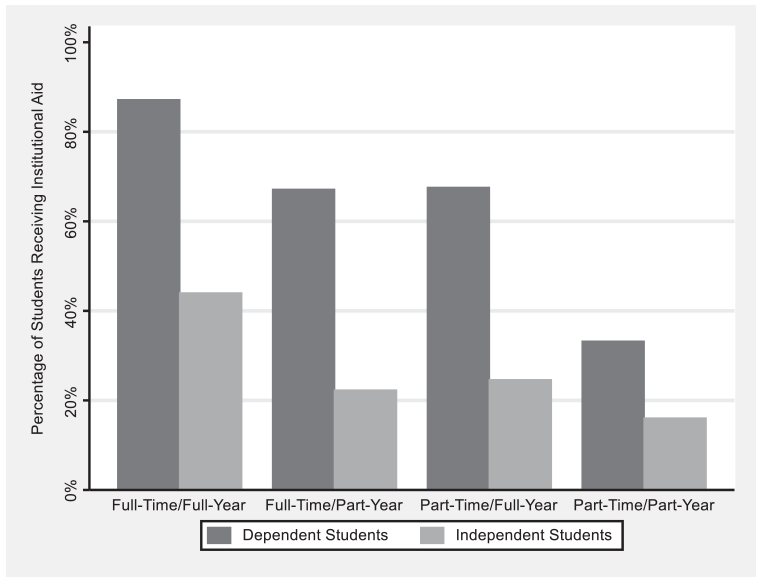
The provision of institutional grant aid at non-elite four-year private institutions by student type, 2015/16.
This finding may provide another explanation for why non-elite privates continue to raise listed tuition even after 100% of incoming first-time full-time students receive institutional aid. These listed tuition increases might lead to the collection of further net tuition revenue from part-time and part-year students. Data sets such as IPEDS, which collects data solely on aid offerings for more traditional attendance patterns, can lead researchers to overlook this possibility.
Discussion
This paper has highlighted a key reason why non-elite private institutions continue to increase listed tuition and institutional aid each year: Without such increases, these schools will see meaningful declines in the net tuition revenue they collect. As Tables 1 and 2 illustrated earlier, the net price differentials by year of study embedded in their pricing structures are predicated on continual increases in listed tuition. The financial incentives associated with these price differentials do not diminish over time but instead encourage institutions to increase listed tuition in perpetuity. These continual increases, however, can lead to rising sticker shock, public frustration with higher education, and other challenges. In this section, we discuss alternative pricing structures that non-elite privates might employ that would not include ever-increasing listed tuition and institutional aid.
One option for non-elite privates is to stop using price structures that include net price differentials by year of study. Institutions could simply stop increasing listed tuition each year and stop increasing the average institutional grant awards provided to incoming students. After several years, net prices would no longer vary by year of study. This shift will lead to a reduction in net tuition revenue unless the institution increases the net price for incoming students by reducing institutional aid while communicating that net prices will not increase as students advance in their studies. This net price increase for incoming students, however, may harm the institution’s ability to recruit new students, especially if prospective students do not trust the institution’s claim that net price will not further increase or do not realize that alternative institutions, with lower first-year net prices, will likely continue to increase net prices further. A tuition guarantee (e.g., a guarantee that tuition increases will not exceed some inflation indicator) could potentially address the issue of trust but would restrict the future pricing options of the institution. A skillful marketing campaign would be needed to address the comparisons that prospective students might make between schools. 22
A second option is to retain the institution’s existing price structure but use periodic resets to ensure that listed tuition and institutional grant awards do not become too extreme. For this option, listed tuition and institutional aid are ever-increasing with the exception of periodic years where listed tuition and institutional aid are meaningfully reduced (i.e., reset). The magnitude of the reduction in listed tuition will determine how often resets are needed and the impact of the reset on net tuition revenue. 23 Despite some higher-profile cases of schools resetting or decreasing tuition, 24 the practice has been relatively uncommon thus far. Riggs (2020) finds that only 13% of four-year privates ever decreased listed tuition between 2002/03 and 2016/17 and that the median tuition decrease was 4.5% (calculated in nominal dollars between two years).
A third general approach is to retain net price differentials by year of study but to enact them within a pricing structure that does not require yearly increases in listed tuition and institutional aid. Table 1 described two pricing structures of this type. The first, differential listed tuition, contains a tuition schedule where listed prices rise with a student’s year of study, but the prices in that schedule would not need to rise over time. Similar to Simone (2010) and Ehrenberg (2012), we find that this pricing structure is more common at public institutions than at private institutions. The second, front-loaded aid, possesses a schedule where award amounts fall with year of study, but as with differential listed tuition, the average prices in that schedule would not need to change over time. Unlike an ever-increasing pricing structure, each entering class could receive the same initial aid awards, on average, as the preceding class.
Past empirical research suggests that front-loaded grants could be an effective alternative. Avery and Hoxby (2004) find that prospective students may prefer front-loaded aid awards and DesJardins et al. (2002a) show that such an award structure could mitigate stop out. Prospect theory (Kahneman & Tversky, 1979) highlights potential risks of front-loaded awards. If students perceive later grant reductions as losses, it could elicit an especially negative response in persistence due to loss aversion. Consistent with this possibility, DesJardins et al. (2006) find that students are less likely to enroll when they receive less aid than expected.
All of the alternative pricing structures discussed in this section would address some of the concerns associated with an ever-increasing pricing structure, but each option also raises a new set of concerns. If prospective students find these pricing structures unattractive, then institutions that employ them may see their enrollment and net tuition revenue decline. Previous research suggests that some policies may contain promise or at least not cause harm, but the existing knowledge base regarding how students will respond to these alternative structures is small so clear conclusions cannot be drawn.
Conclusion
The steadily rising listed tuition and institutional grant awards of non-elite privates have received considerable attention and criticism over the last twenty years, yet these institutions continue to increase listed tuition and aid. This paper provides a new perspective on this behavior by highlighting how the pricing structure employed by non-elite private institutions incentivizes continual increases in listed tuition. If listed tuition is not increased in a given year, then existing net price differentials by year of study will not be sustained and net tuition revenue will fall. The previous section described a key decision facing non-elite private institutions: whether to continue on their current pricing path or to adopt an alternative pricing strategy. In this concluding section, we discuss how future research can further inform this decision.
Non-elite private institutions face two risks if they continue on their current pricing path. First, they might deter applications from prospective students, especially students with limited knowledge about the college-going process, due to sticker shock. We know relatively little about the presence and magnitude of sticker shock. With the exception of a recent study of sticker shock at state flagship institutions (Levine et al., 2020), most existing evidence comes from brief surveys of prospective students (e.g., Longmire and Company, Inc, 2013). The second risk of the current pricing path is declining retention rates of previously enrolled students. This risk may have grown in recent years due to the elimination of guidelines from the National Association for College Admission Counseling (NACAC) that called for colleges to not solicit transfer applications or knowingly recruit or offer enrollment incentives to students enrolled at other institutions (Jaschik, 2019). This policy shift, which future research could examine, could alter the market power of institutions over their current students.
Non-elite privates could move to a range of different pricing structures that do not require annual increases in listed tuition, but these alternative structures could create new concerns for an adopting institution. Research that examines how students respond to the specific pricing structures described in the previous section and how these responses affect an institution’s enrollment and revenues could inform the pricing decisions facing leaders of non-elite privates. Some evidence already exists regarding tuition guarantees (Delaney & Kearney, 2015, 2016), tuition resets (Lapovsky, 2015, 2019; Riggs, 2020), and front-loaded aid awards (Avery & Hoxby, 2004; DesJardins et al., 2002a), but more work is needed to produce a clear understanding of these alternative policies. Recent years have experienced an increase in tuition resets (Riggs, 2020; Whitford, 2020) and the challenges of the 2020s—which will include both the COVID-19 pandemic and a decline in the number of high school graduates in the latter half of the decade (Grawe, 2018)—could prompt even more experimentation. As a result, researchers will likely find opportunities to study the impacts of alternative pricing strategies.
Supplemental Material
sj-docx-1-epa-10.3102_01623737221094565 – Supplemental material for Ever-Increasing Listed Tuition and Institutional Aid: The Role of Net Price Differentials by Year of Study
Supplemental material, sj-docx-1-epa-10.3102_01623737221094565 for Ever-Increasing Listed Tuition and Institutional Aid: The Role of Net Price Differentials by Year of Study by John J. Cheslock and Sam O. Riggs in Educational Evaluation and Policy Analysis
Footnotes
Acknowledgements
The authors wish to thank Tom Ahn, Deborah Anderson, Rob Bielby, John Caskey, Steven Corey, Roger Geiger, Donald Heller, Michael Ransom, Mark Roberts, Scott Schulz, Robert Toutkoushian, and participants of the Center for the Study of Higher Education meetings at the Pennsylvania State University for helpful discussions.
Declaration of Conflicting Interests
The author(s) declared no potential conflicts of interest with respect to the research, authorship, and/or publication of this article.
Funding
The author(s) received no financial support for the research, authorship, and/or publication of this article.
Notes
Authors
JOHN J. CHESLOCK is a professor in the Department of Education Policy Studies at the Pennsylvania State University. His research examines the finances of colleges and universities through analysis of specific revenue sources, underlying cost structures, and the economics associated with specific activities.
SAM O. RIGGS is a researcher at Education Northwest. His research examines the influence of programs, policies, and structures on postsecondary access and success.
References
Supplementary Material
Please find the following supplemental material available below.
For Open Access articles published under a Creative Commons License, all supplemental material carries the same license as the article it is associated with.
For non-Open Access articles published, all supplemental material carries a non-exclusive license, and permission requests for re-use of supplemental material or any part of supplemental material shall be sent directly to the copyright owner as specified in the copyright notice associated with the article.