
Abstract
We use a difference-in-differences analytic approach to estimate postsecondary consequences from Maine’s mandate that all public school juniors take the SAT®. We find that, overall, the policy increased 4-year college-going rates by 2- to 3-percentage points and that 4-year college-going rates among induced students increased by 10-percentage points.
Introduction
T
Why might Maine’s mandatory SAT policy positively affect college enrollment? Perhaps the broadest explanation is that it helps students to overcome one of the critical barriers in the college-going process. For a policy like the mandatory SAT to have any impact, there must exist a group of students with college aspirations that do not come to fruition as a result of the barriers placed before them. Perhaps these students are unaware that the SAT is an admissions requirement at many 4-year institutions or perhaps they view the costs and time commitments as prohibitive.
Within the past decade, several studies confirmed the existence of “potential college-goers,” with college aspirations that are not translated into action, and that, targeted interventions reduce the barriers to college entry. For example, Avery and Kane (2004) demonstrate that students from low-income households have similar college aspirations to neighboring high-income students, but their unfamiliarity with the college application process prevents similar college-going patterns. However, Carrell and Sacerdote (2013) show that even late high school “college coaching” can improve college enrollment rates. With respect to financial aid hurdles, Bettinger, Long, Oreopoulos, and Sanbonmatsu (2012) show that students who have had their Free Application for Federal Student Aid (FAFSA) forms completed by tax professionals are more likely to attend college. Pallais (2013) shows that when the ACT increased the number of free score sends from three to four, students submitted more college applications and lower-income students matriculated at more selective postsecondary institutions. Finally, the opportunity to take the SAT at the student’s own high school, rather than commuting to a different testing center, results in an increase in test-taking and 4-year college-going (Bulman, 2012).
Why would a mandatory SAT policy be expected to increase 4-year college-going rates? Overcoming the hurdle of sitting for a college entrance exam represents an important step in the college-going process; however, the enhanced enrollment rates associated with forced test-taking may stem from more than just “sitting for the test.” Students may be pleasantly surprised by their scores, which, in turn, may convince them to apply to and enroll in college. This phenomenon is documented in Goodman (2012) among students who are mandated to take the ACT. Second, students who take the SAT have the option of receiving promotional materials from colleges. These promotional materials may persuade students to apply to and attend college. In fact, simply the act of applying to more colleges has the potential to increase the probability of enrollment (Smith, 2013). In addition, the provision of valuable information from colleges may not only induce students to enroll but may also induce students to enroll in a relatively selective college over a less-selective college (Hoxby & Turner, 2013). The lack of information and support among poor and rural students, often leading to undesirable college application and enrollment decisions, is well documented (Dillon & Smith, 2013; Hoxby & Avery, 2013; Hoxby & Turner, 2013; Smith, Pender, & Howell, 2013) and hence, the mandatory SAT policy is likely to have the largest impact on these students. Finally, mandating college entrance examinations may help to shape college-going cultures within the high schools or within the state. Both Hurwitz, Smith, Howell, and Pender (2012) and the Strategic Data Project (2012) show that observably similar high schools can have vastly different college-going rates, suggesting that some high schools tend toward this culture, while others do not.
To estimate the effect of Maine’s policy on 4-year college enrollment, we use student-level data on all U.S. public high school students who participate in a College Board (CB) product (SAT, PSAT/NMSQT®, AP®) and were expected to graduate from high school between 2004 and 2008. The 2004, 2005, and 2006 high school graduation cohorts in Maine were not required to take the SAT, while the SAT was mandatory in the spring of junior year for the 2007 and 2008 cohorts. 2 As a result of Maine’s mandatory SAT policy which affected all public high school students, the total number of SAT test-takers in Maine increased by 43%, from 10,895 to 15,557, between the 2006 and 2007 cohorts. By contrast, the number of SAT test-takers in all other states remained fairly constant between these 2 years. Using a difference-in-differences (DID) approach between public high school senior cohorts in Maine and a set of control states, we estimate that 4-year college enrollment rates among Maine public high school seniors increased by approximately 2- to 3-percentage points (about 4%-6%) as a result of the mandatory SAT. This increase appears to be driven mainly by students hailing from high schools in small towns and rural areas of Maine, rather than students living in suburban areas or in Maine’s small cities. Furthermore, using two-stage least squares (2SLS) regression, we estimate the treatment-on-the-treated (TOT) effect of the mandate and find that students induced to take the SAT experienced a 10-percentage point increase in attending a 4-year postsecondary institution. These increases in college enrollment imply that a larger fraction of the high school population is one step closer to earning a 4-year degree. However, we are unable to detect an increase in the fraction of Maine public high school seniors with a bachelor’s degree in hand within 4 or 5 years of having graduated from high school.
To date, few studies have explicitly addressed how removing procedural barriers to college entry have affected college-going. This article and its identification strategy are most similar to Klasik (2013), who evaluates the adoption of the ACT in Colorado and Illinois and the SAT in Maine. Overall, he finds a positive, statistically significant effect on the probability of 4-year college enrollment rates in Illinois and positive, though not statistically significant, effects in Colorado and Maine. 3 Similarly, Goodman (2012) also uses aggregate data to evaluate the adoption of the ACT in Colorado and Illinois and finds a corresponding increase in selective college enrollment. Our article’s comprehensive student-level data allow us to more precisely estimate the effects of the policy change on those whom the policy is supposed to impact: Maine public high school students. 4 In addition, we are able to estimate heterogeneous effects by students’ high schools characteristics. Finally, our student-level data correctly capture those students who delay 4-year enrollment, potentially through 2-year colleges, which may be an important avenue for the students induced to attend 4-year colleges by the SAT mandate.
The research questions posed in this study are important because institutional, state, and federal leaders consistently attempt to increase college access and completion, particularly among traditionally underserved student populations. This is an important goal in light of the many studies that show the positive economic returns to attending college (e.g., Ashenfelter & Krueger, 1994). States, in particular, must carefully consider how to achieve college access goals when faced with shrinking budgets. Because college entrance examinations represent an important hurdle to attending postsecondary institutions, making these examinations mandatory for all high school students may be a cost-effective way of inducing more students to participate in postsecondary education, while fulfilling the state’s testing/accountability requirements.
Background and Data
Maine’s Policy
In the fall of 2005, Maine revised its NCLB accountability plan with the intent of using the SAT as the formal high school assessment beginning in the spring of 2006 for the high school graduation cohort of 2007. The choice to replace Maine’s previous accountability exam (the Maine Educational Assessment) with the SAT was motivated in part by a desire to ensure that more students put forth a sincere effort into taking the accountability exam and to increase college-going among Maine’s high school graduates. The SAT, which remained unchanged in response to this policy, satisfied the English and Language Arts (ELA) requirements of NCLB, but required a short mathematics supplement to adhere to NCLB guidelines. This supplement consisted of 18 questions in the second year of the policy and 12 questions in subsequent years.
To remove any potential barriers associated with SAT test-taking, Maine undertook several steps to maximize test-taking percentages. First, the state transformed all public high schools into SAT testing centers. Second, school districts were provided with funding for school busses to transport students from their homes to school. 5 Students unable to take the exam on the official administration date were provided with an official makeup date the following month. An unofficial administration was also provided by the state of Maine in which students were granted accommodations not officially sanctioned by the CB, and therefore not reportable for college admissions purposes. Finally, students were registered for the exam in bulk.
Other schoolwide adjustments were also undertaken in Maine in response to the SAT mandate. Students were offered online courses for both the PSAT and the SAT to increase student preparation for the exam. Breakfast and lunch were offered to students on the exam day. As a reward for student participation, a “comp” day was provided during the following week for SAT test-takers.
Data
In this study, we assemble a data set from four major sources:
We used the CB’s data for the 2004 through 2008 high school graduation cohorts. The data include students who took any of the three major CB products: SAT, PSAT/NMSQT, and Advanced Placement (AP) exams. The student-level data include scores on these exams, high school attended, and state residency.
The National Student Clearinghouse (NSC) collects data from more than 3,500 participating colleges and universities, and covers about 94% of enrolled students across the country. The NSC tracks individual students through their postsecondary education careers. Participating institutions provide the NSC with student-level data on enrollment by semester, graduation date, degree earned, and duration of studies.
The National Center for Education Statistics (NCES) administered Common Core of Data (CCD) includes public high school level information, including student enrollment by grade, urbanicity (rural, town, suburban, or urban) of school, and percentage of students receiving free/reduced price lunch.
We used zip code data from the U.S. Census Bureau to ascertain the adult education levels in a student’s school’s zip code. 6
We merge the four data sources together to get a comprehensive look at students’ characteristics and achievements. We eliminate all private high school students because Maine’s policy applies only to public school students. We also eliminate the few students attending public schools where no CCD senior enrollment data were available, or schools where there were no seniors enrolled, in at least one of the five sampled years.
We also create four outcome variables. First, we create a binary variable indicating whether a student enrolls in a 4-year college in any state at any point within 4 years of having graduated from high school (any-time 4-year college-going). We specify this restriction because the NSC/CB data merger took place in 2012, at which point the final cohort (2008) would have only had 4 years to enroll in college. Second, we create a binary variable to indicate whether the first postsecondary institution at which the student enrolls was a 4-year institution (first-time 4-year college-going) to gain perspective on the extent to which induced students entered the 4-year college pipeline by first attending 2-year colleges. Finally, we create two binary variables indicating whether the student had received a bachelor’s degree within 4 years of high school graduation (2004–2008 cohorts) and within 5 years of high school graduation (2004–2007 cohorts). In this study, we do not examine the impact of the mandatory SAT on 2-year college-going rates because a nontrivial number of students who enrolled in 2-year colleges prior to the mandate may not have taken the CB examinations that would have allowed them to be captured in our data set.
Empirical Strategy
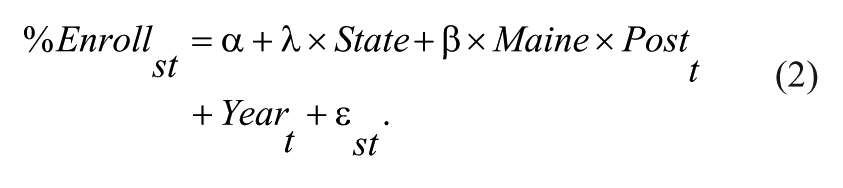
We rely on a DID approach to identify the causal impact of the mandatory SAT in Maine. The basic assumption underlying the DID approach is that selecting an appropriate control group unaffected by the policy change and estimating changes in the outcomes of interest in this group provide a counterfactual to what would have occurred in the treatment group had the policy change not been implemented. In the context of these analyses, Maine was the only state affected by the mandatory SAT policy, so the other 49 states and Washington DC are potential control group members, to which we test the sensitivity. Our first empirical specification is as follows:

where
We then aggregate data at the state level to estimate the following:
The analyses above estimate the intent-to-treat (ITT) impact of the mandatory SAT on 4-year college-going rates. Using a conventional 2SLS approach, we also estimate the TOT impact. This is accomplished by fitting our data with Equations 3 and 4 below:

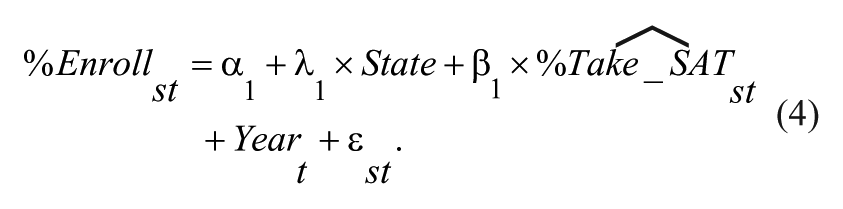
In the first stage, as represented by Equation 3, the outcome variable is the percentage of public high school seniors taking the SAT and the instrument is the interaction between Maine and Post. In the second stage, as represented by Equation 4, parameter β1 indicates the percentage point increase in 4-year college-going, resulting from a 1-percentage-point increase in SAT uptake rates.
As previously suggested, it is unlikely that the potential college-goers, whose decisions to matriculate at 4-year institutions may be influenced by the mandatory SAT, are dispersed equally across the state. Consequently, we examine not just overall impacts of the policy change but also the differential impacts across the range of student sociodemographic characteristics, measured at the high school level. Specifically, we examine the differential policy impacts by the percentage of students eligible for free and reduced price lunch in the student’s high school, urbanicity of the student’s high school, and adult educational attainment in the high school’s zip code. To accomplish this, we split the sample of high schools by these high school level characteristics before aggregating the data up to the state level and separately estimating Equations 3 and 4.
We conclude our empirical analysis section by performing a synthetic control group analysis to estimate the impact of the mandatory SAT on 4-year college-going. A noted advantage of the synthetic control group approach is that it helps to overcome one of the largest challenges associated with any DID analytic framework—selection of the control group. To confront the reality that some states are more similar to Maine than others, particularly with respect to premandate trends in college-going, we present results from a weighted combination of SAT-dominant control states using a synthetic control approach as discussed in Abadie, Diamond, and Hainmueller (2010). The synthetic Maine, created from this weighting of control states, provides a counterfactual to how 4-year college-going rates in Maine would have changed in the absence of a mandatory SAT.
Aggregation of Data
The basic outcome, whether or not a high school senior attends college, is measured at the student level. However, as Bertrand, Duflo, and Mullainathan (2004) note, using individual-level data when the policy shock occurs at the state level can lead to severely understated standard errors. Bertrand et al. (2004) respond to this challenge by aggregating data at a higher level to minimize the presence of common error terms. We follow this approach particularly because our research questions focus on aggregate changes in 4-year college-going rates, rather than pinpointing how Maine’s policy shock affected individual students. 7 Throughout the article, we use two levels of aggregation. First, we aggregate outcomes at the high school/year level to obtain college-going rates at each high school in each of the 5 years. The denominator, number of high school seniors, is obtained from CCD, and the numerator, 4-year college-goers, is obtained from the CB data set. We choose to present results after aggregating data at the high school level for two reasons. First, in the wake of the mandatory SAT policy, there was variation in compliance among Maine’s high schools and this variation can be exploited when estimating the TOT estimates. Second, high school level estimates shed light on the types of high schools where the potential college-goers are located.
We also aggregate outcomes at the state-by-year level to obtain statewide college enrollment rates in each of the 5 years. The denominator in this level of aggregation represents the sum of all sampled public high school seniors in the state in each of the years 2004 to 2008. This is the highest level of aggregation in which any worries about common error terms in the micro-data are completely eliminated. Consequently, we view these estimates and standard errors with the most attention.
Basic DID Assumptions
A fundamental requirement for a successful DID analysis is the selection of the proper control group. The control group serves as an example of what would have happened in Maine had Maine’s policy not been adopted. To address this assumption, we separately perform our analyses using all states, the 23 states (and Washington DC) identified by Clark, Rothstein, and Schanzenbach (2008) as SAT-dominant states and a subset of these SAT-dominant states located in the Northeast (Connecticut, Maine, Massachusetts, New Hampshire, New Jersey, New York, Pennsylvania, Rhode Island, and Vermont). We concentrate primarily on these latter two sets of control states, though as we show throughout this article, results are not particularly sensitive to the sets of chosen control states.
Another DID assumption is that there are no other shocks or policies in the control and treatment states that would also influence the outcome of interest. With respect to Maine, we purposefully do not consider the 2009 high school graduation cohorts and beyond not only because some delayed college entrants would not have been captured in these later cohorts but also because the 2009 cohort in Maine was subject to a mandatory PSAT/NMSQT in addition to a mandatory SAT. As for the control states, it is more than likely that some states did adopt policies to increase college enrollment during these 2 years, though no state, other than Michigan, changed an ACT/SAT testing mandate that would have affected the 2004 to 2008 high school graduation cohorts. If policy shocks in the control states did increase enrollment between the premandate years and postmandate years, our estimates would be biased downward and can be considered conservative.
Results
Descriptive Statistics on 4-Year College-Going
In Table 1, we present summary statistics on the percentage of public high school seniors in the sampled high schools that are any-time 4-year college-goers and first-time 4-year college-goers. We disaggregate these percentages by pre- (2004–2006) and post- (2007–2008) mandate cohorts and by this article’s two primary control groups: SAT-dominant states and northeastern states. We also explore the heterogeneity of these percentages, by estimating them for the high schools above and below the national median high school level thresholds on free/reduced price lunch eligibility, adult education levels in the high school’s zip code, and urbanicity. Finally, we test whether the simple difference in proportions of seniors who attend 4-year colleges between the pre- and postmandate cohorts are statistically significant.
Descriptive Statistics
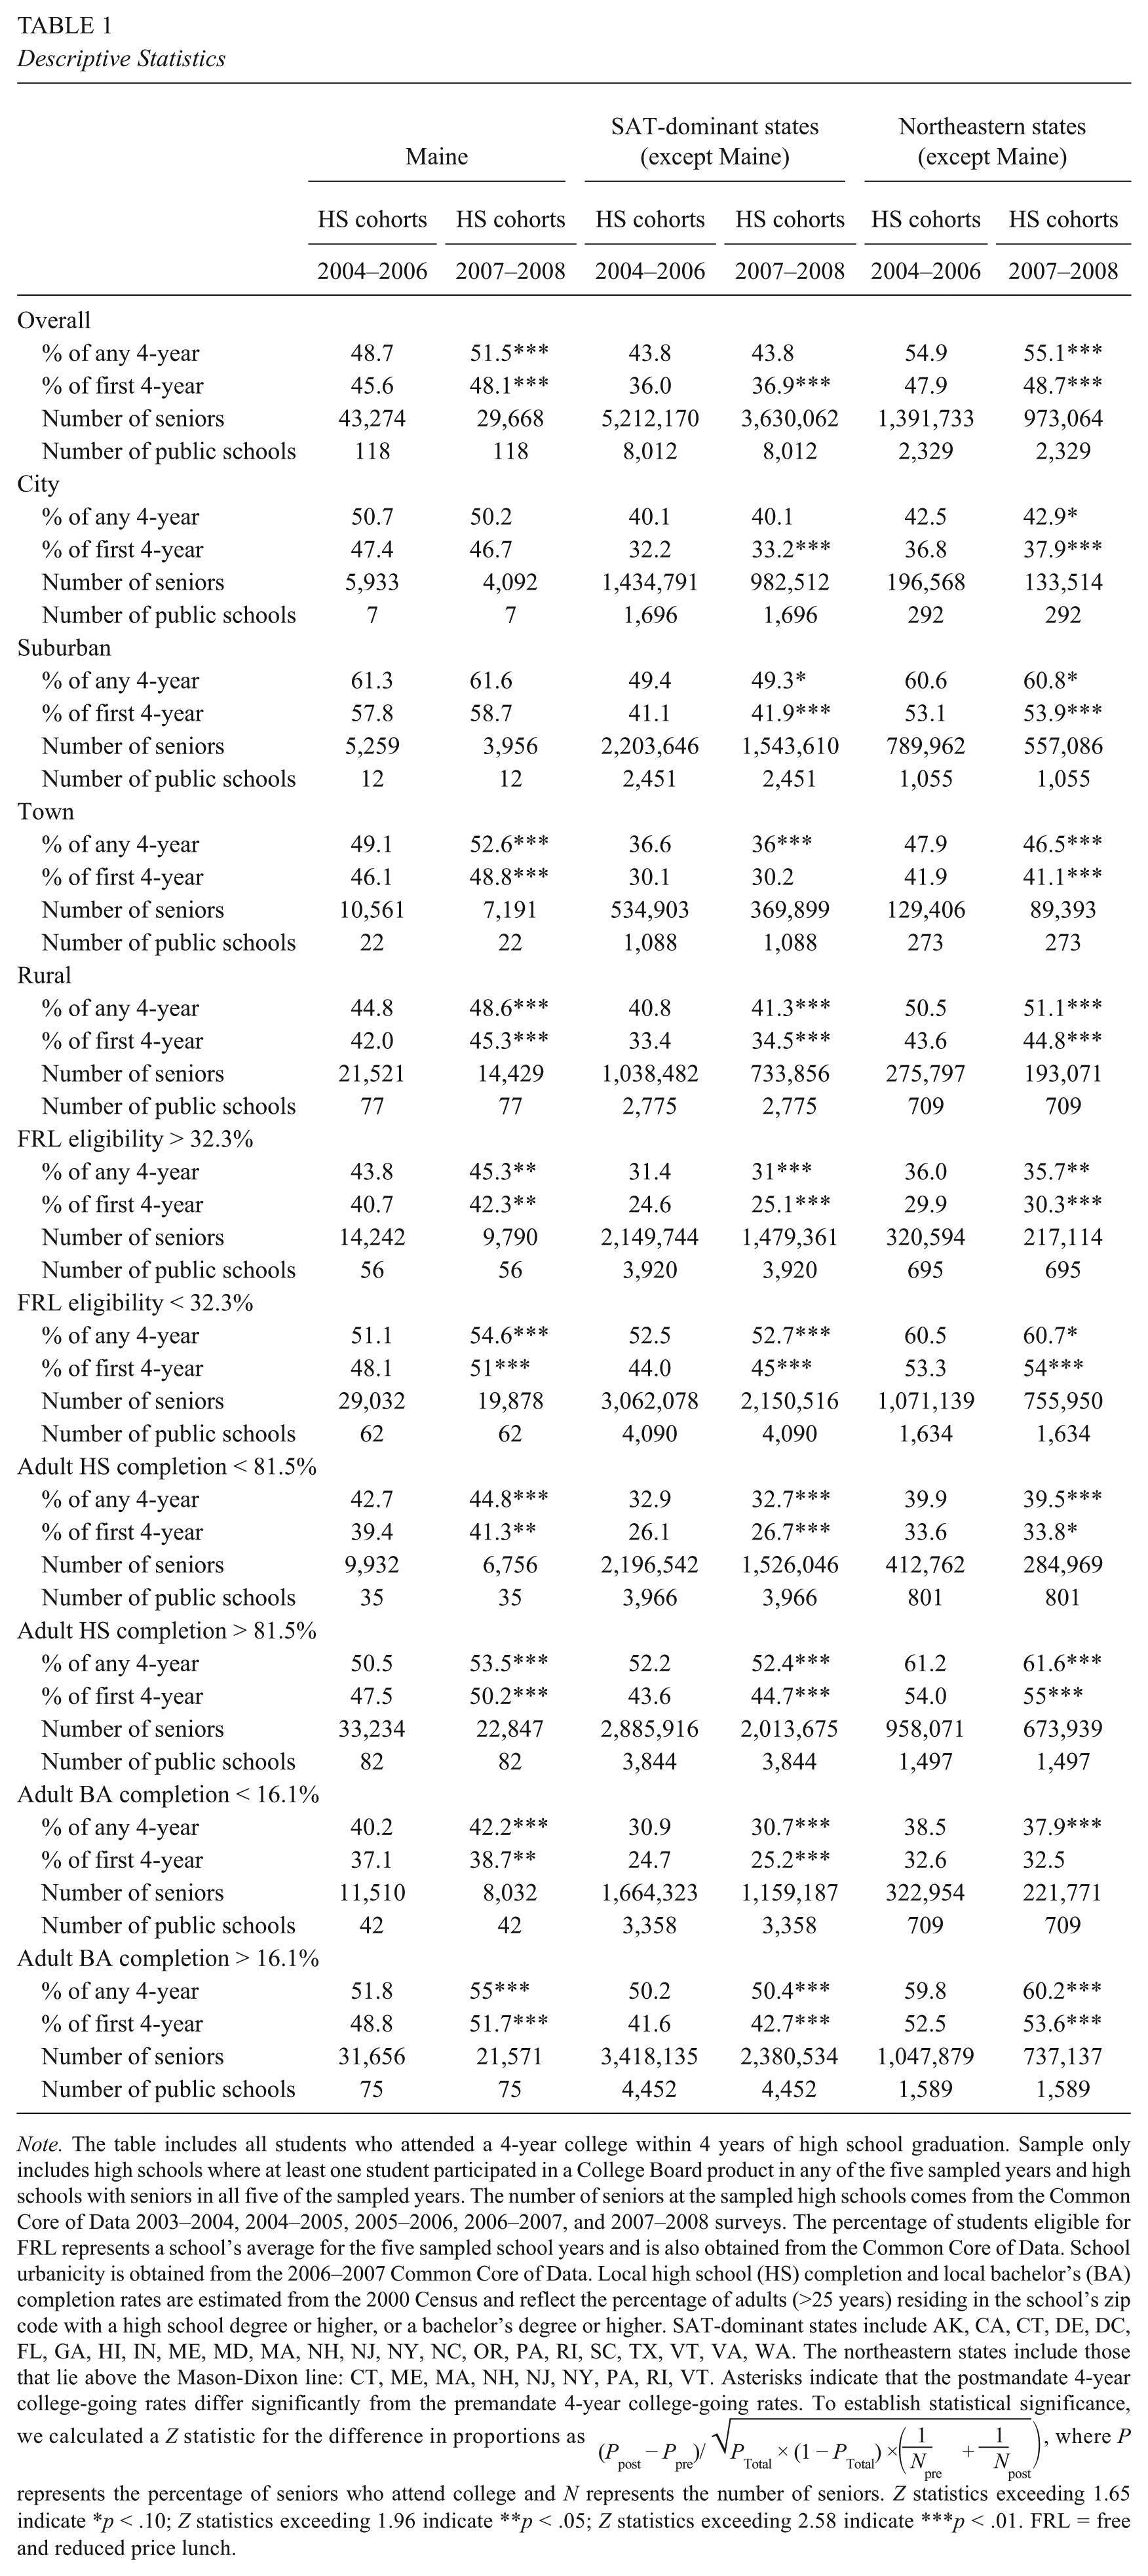
Note. The table includes all students who attended a 4-year college within 4 years of high school graduation. Sample only includes high schools where at least one student participated in a College Board product in any of the five sampled years and high schools with seniors in all five of the sampled years. The number of seniors at the sampled high schools comes from the Common Core of Data 2003–2004, 2004–2005, 2005–2006, 2006–2007, and 2007–2008 surveys. The percentage of students eligible for FRL represents a school’s average for the five sampled school years and is also obtained from the Common Core of Data. School urbanicity is obtained from the 2006–2007 Common Core of Data. Local high school (HS) completion and local bachelor’s (BA) completion rates are estimated from the 2000 Census and reflect the percentage of adults (>25 years) residing in the school’s zip code with a high school degree or higher, or a bachelor’s degree or higher. SAT-dominant states include AK, CA, CT, DE, DC, FL, GA, HI, IN, ME, MD, MA, NH, NJ, NY, NC, OR, PA, RI, SC, TX, VT, VA, WA. The northeastern states include those that lie above the Mason-Dixon line: CT, ME, MA, NH, NJ, NY, PA, RI, VT. Asterisks indicate that the postmandate 4-year college-going rates differ significantly from the premandate 4-year college-going rates. To establish statistical significance, we calculated a Z statistic for the difference in proportions as
Table 1 conveys that, in the SAT-dominant states, 43.8% of high school seniors from both the pre- and postmandate high school graduation cohorts enrolled in 4-year colleges within 4 years of high school graduation. Among northeastern states, this percentage was 54.9% for the premandate cohorts and 55.1% for the postmandate cohorts. In contrast to the stability of these percentages in the control states, the percentage of Maine’s public high school seniors attending 4-year colleges increased from 48.7% in the premandate cohorts to 51.5% in the postmandate cohorts. Table 1 also shows that this increase is slightly more exaggerated in high schools in towns and rural areas.
Among the two aggregated sets of control states in our analyses, there appears to be no discernible trend over time in the 4-year college-going rates. However, across the individual states that comprise these two control groups, there are notable across-state fluctuations in 4-year college-going behavior. Figure 1 graphically presents the information in Table 1 by comparing 4-year college-going rates, but further disaggregated by state and cohort. Each of the thin black lines represents a state and the vertical axis depicts the difference in 4-year college-going rates from the 2006 cohort. The solid red line shows the trend relative to 2006 in Maine and the dashed blue line represents the average of these fluctuations across the specified set of control states. In the 2 years after the SAT mandate, Maine experienced a jump of 2- to 3-percentage points in 4-year college-going relative to that measured for the 2006 cohort, and Maine stands out because this jump is markedly larger than that occurring in any other state.
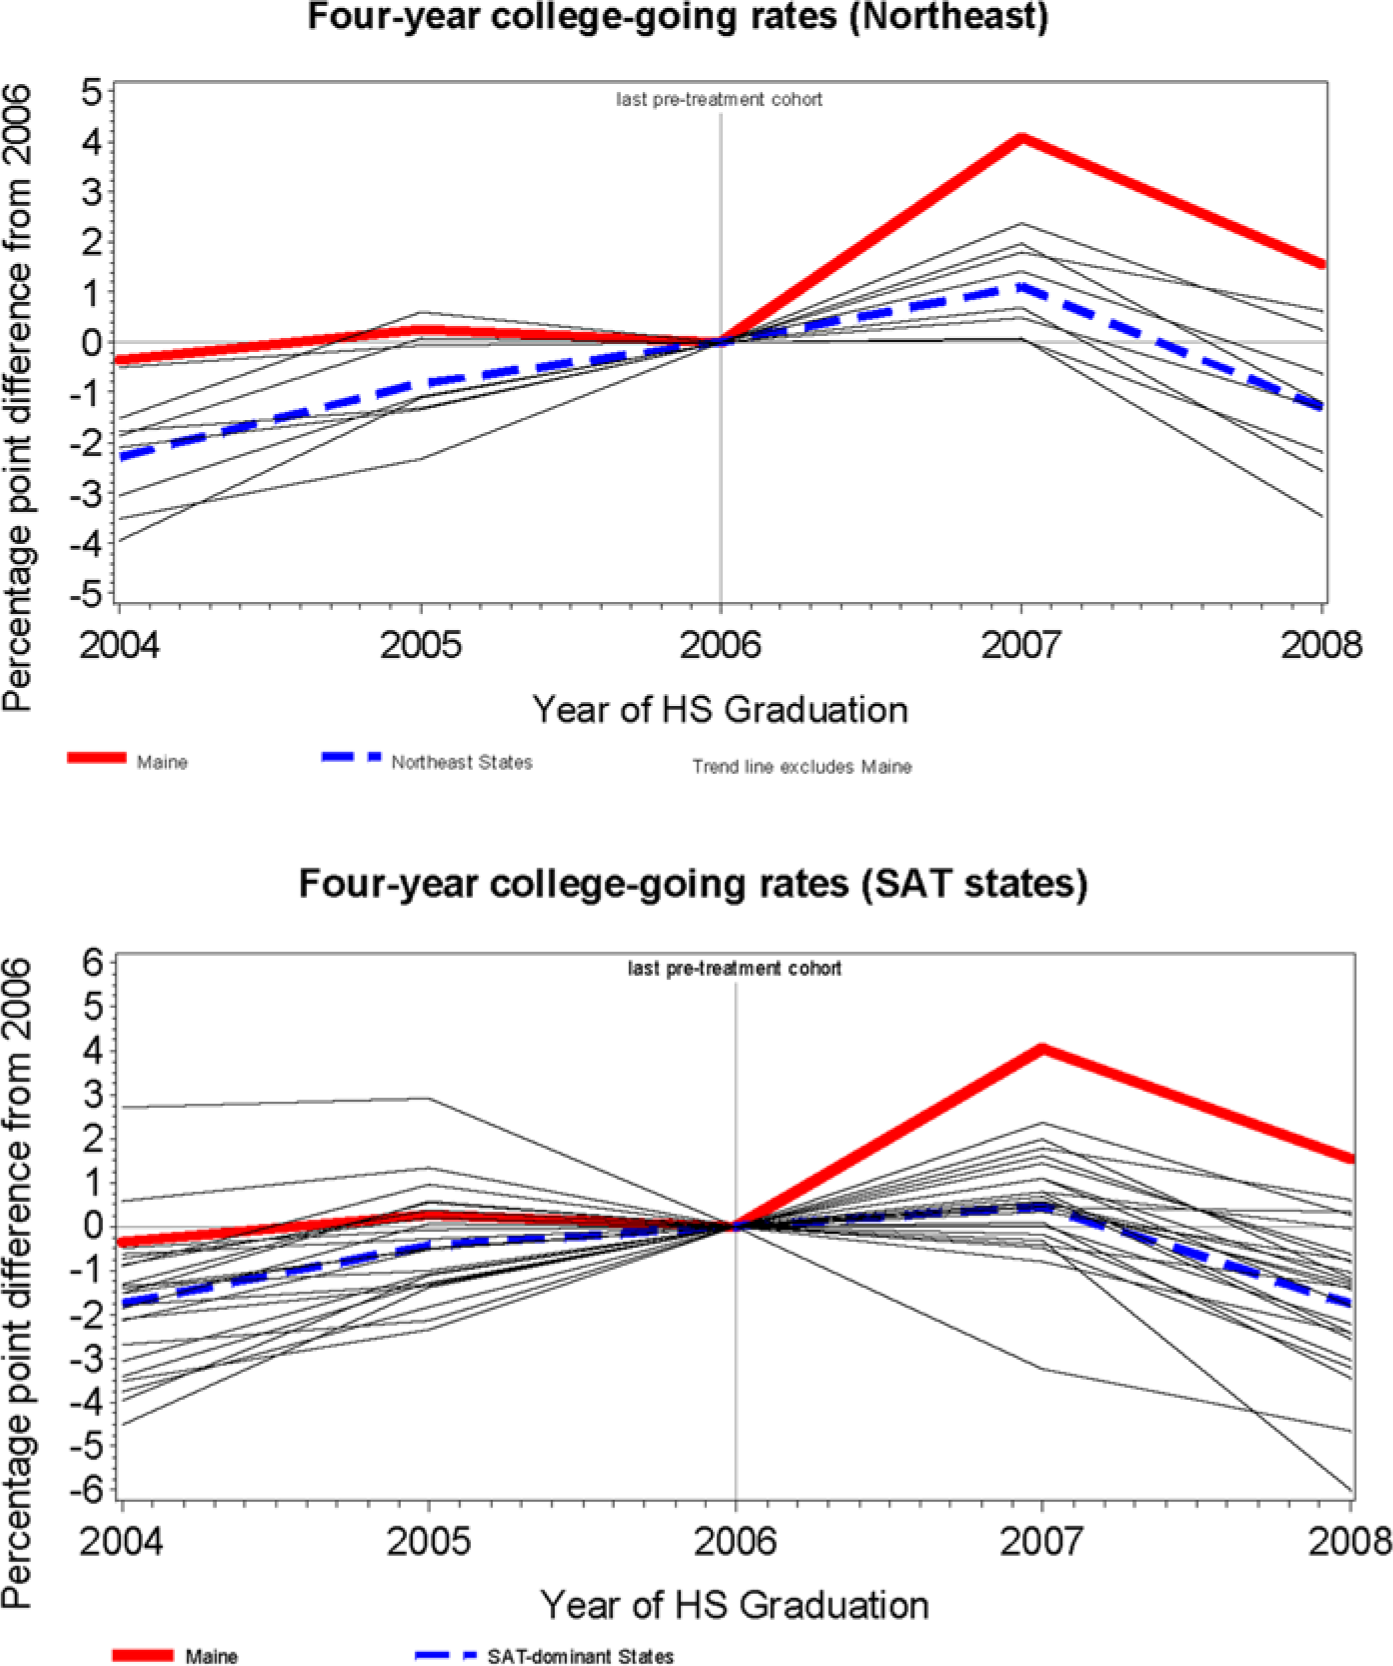
Trends in any-time 4-year college-going rates.
SAT Takers’ Scores and Enrollment Rates
In Figure 2, we show a histogram of SAT scores among Maine’s public high school seniors from the postpolicy 2007 (blue bars) cohort superimposed on a histogram of scores from Maine’s prepolicy 2006 (red bar) cohort (Panel A). The number of public high school seniors in Maine was virtually identical between the 2006 and 2007 cohorts, and there was no change in the distribution of scores nationally (Panel D) between these two cohorts. Therefore, the counts for the 2007 cohort provide a counterfactual for the 2006 cohort if students in this earlier cohort were subject to the SAT mandate. Many induced students obtained well-below-average scores, and the spike of students with combined math and critical reading scores less than 600 suggests that at least several hundred students sat for the SAT without exerting full effort—an unsurprising phenomenon considering this exam has no stakes for the individual student who does not plan to attend college. However, the number of SAT takers with 1,000 to 1,190 on the SAT in the 2007 cohort exceeded that of the 2006 cohort by nearly 400 students. In the 900 to 990 score band, this number was 630.
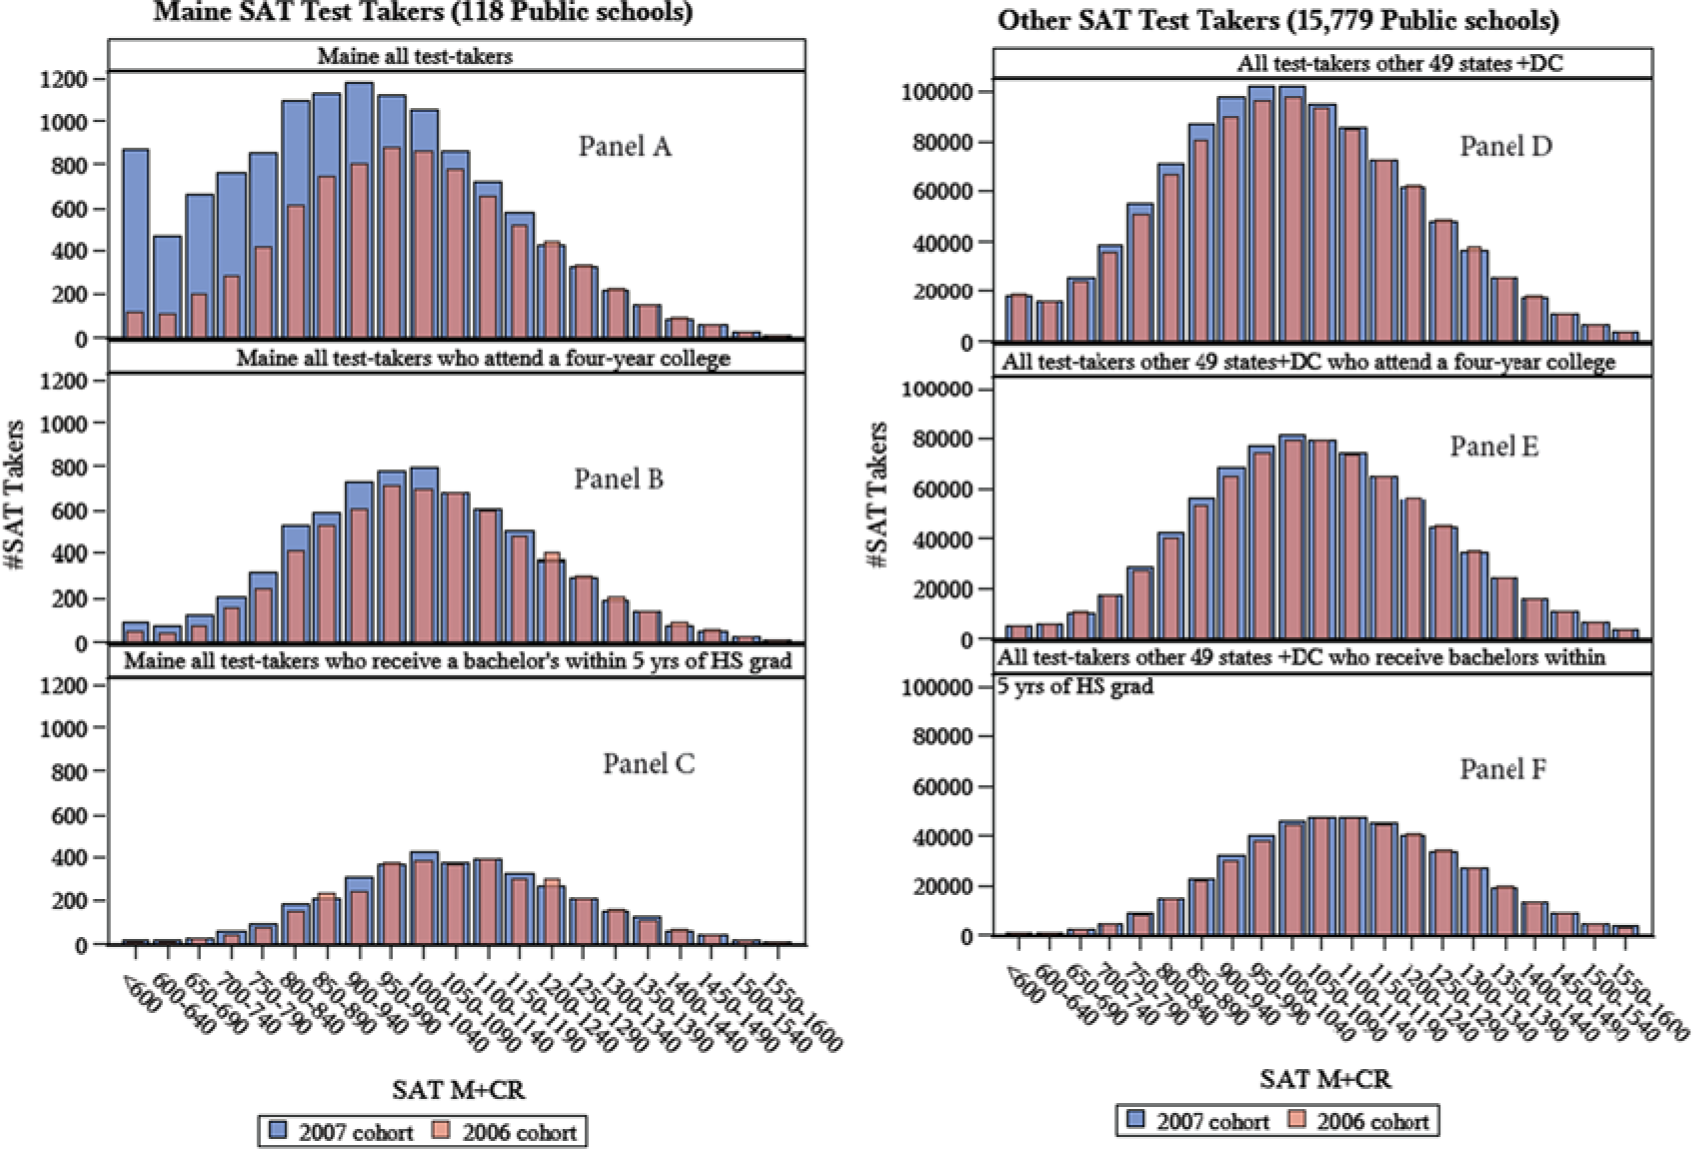
Histogram of SAT test-takers by composite (Math + Critical Reading) scores.
Panels B and C of Figure 2 show the distribution of SAT takers attending 4-year colleges and receiving bachelor’s degrees within 5 years of high school graduation for both the 2006 and 2007 public school cohorts in Maine. Despite the surge in test-takers scoring less than 800 on the SAT in the 2007 cohort, relatively few of these induced students attended 4-year postsecondary institutions. Most induced students scored between 800 and 1,040 on the SAT. Interestingly, the small increase in SAT test-takers with scores between 1,050 and 1,190 resulting from the mandate did not translate into an increase in the number of 4-year college-goers with these scores. This finding is surprising considering these induced test-takers who achieved comparatively high SAT scores show the most promise for postsecondary success. It also conflicts somewhat with the results of Bulman (2012), who finds that the highest achieving students induced into taking the SAT through the addition of new testing centers are more likely to enroll in colleges than more academically modest induced students. Concluding definitely why the fairly small number of high-achieving, induced students in our study is not attending 4-year colleges is not possible with the available data. However, one possibility is that students with the academic preparation and ability to achieve these above average SAT scores were also equipped with the capital to make thoughtful decisions about their own postsecondary educational careers. In other words, these relatively high-achieving, induced students firmly understood the steps required to enter 4-year colleges, but had decided that this educational trajectory—at least in the short term—was not aligned with their life goals. This group does not consist of potential 4-year college-goers and therefore mandatory SAT test-taking would not be expected to reroute them into the 4-year college pipeline.
DID Estimates
In Table 2, we present the estimates of Maine’s SAT policy on any-time 4-year college-going and first-time 4-year college-going. 8 Specifications 1 to 9 show impact estimates when the high school is treated as the unit of analysis. In the first six specifications, we include fixed effects for high schools. In the final three specifications, we include high school level dummy variables for urbanicity (city, suburban, town, and rural) and continuous covariates for free/reduced price lunch eligibility and local adult educational attainment percentages. In all specifications in which data are aggregated at the high school level, we cluster the standard errors by high school to adjust for serial correlation. Specifications 1 to 3 illustrate that the mandatory SAT generates an increase in 4-year college-going rates of roughly 4-percentage points, and these estimates remain unchanged when high school level covariates are used instead of fixed effects (Specifications 7–9).
Percentage-Point Increase in Maine Public School Students Attending 4-Year Colleges Resulting From Maine’s Mandatory SAT Policy
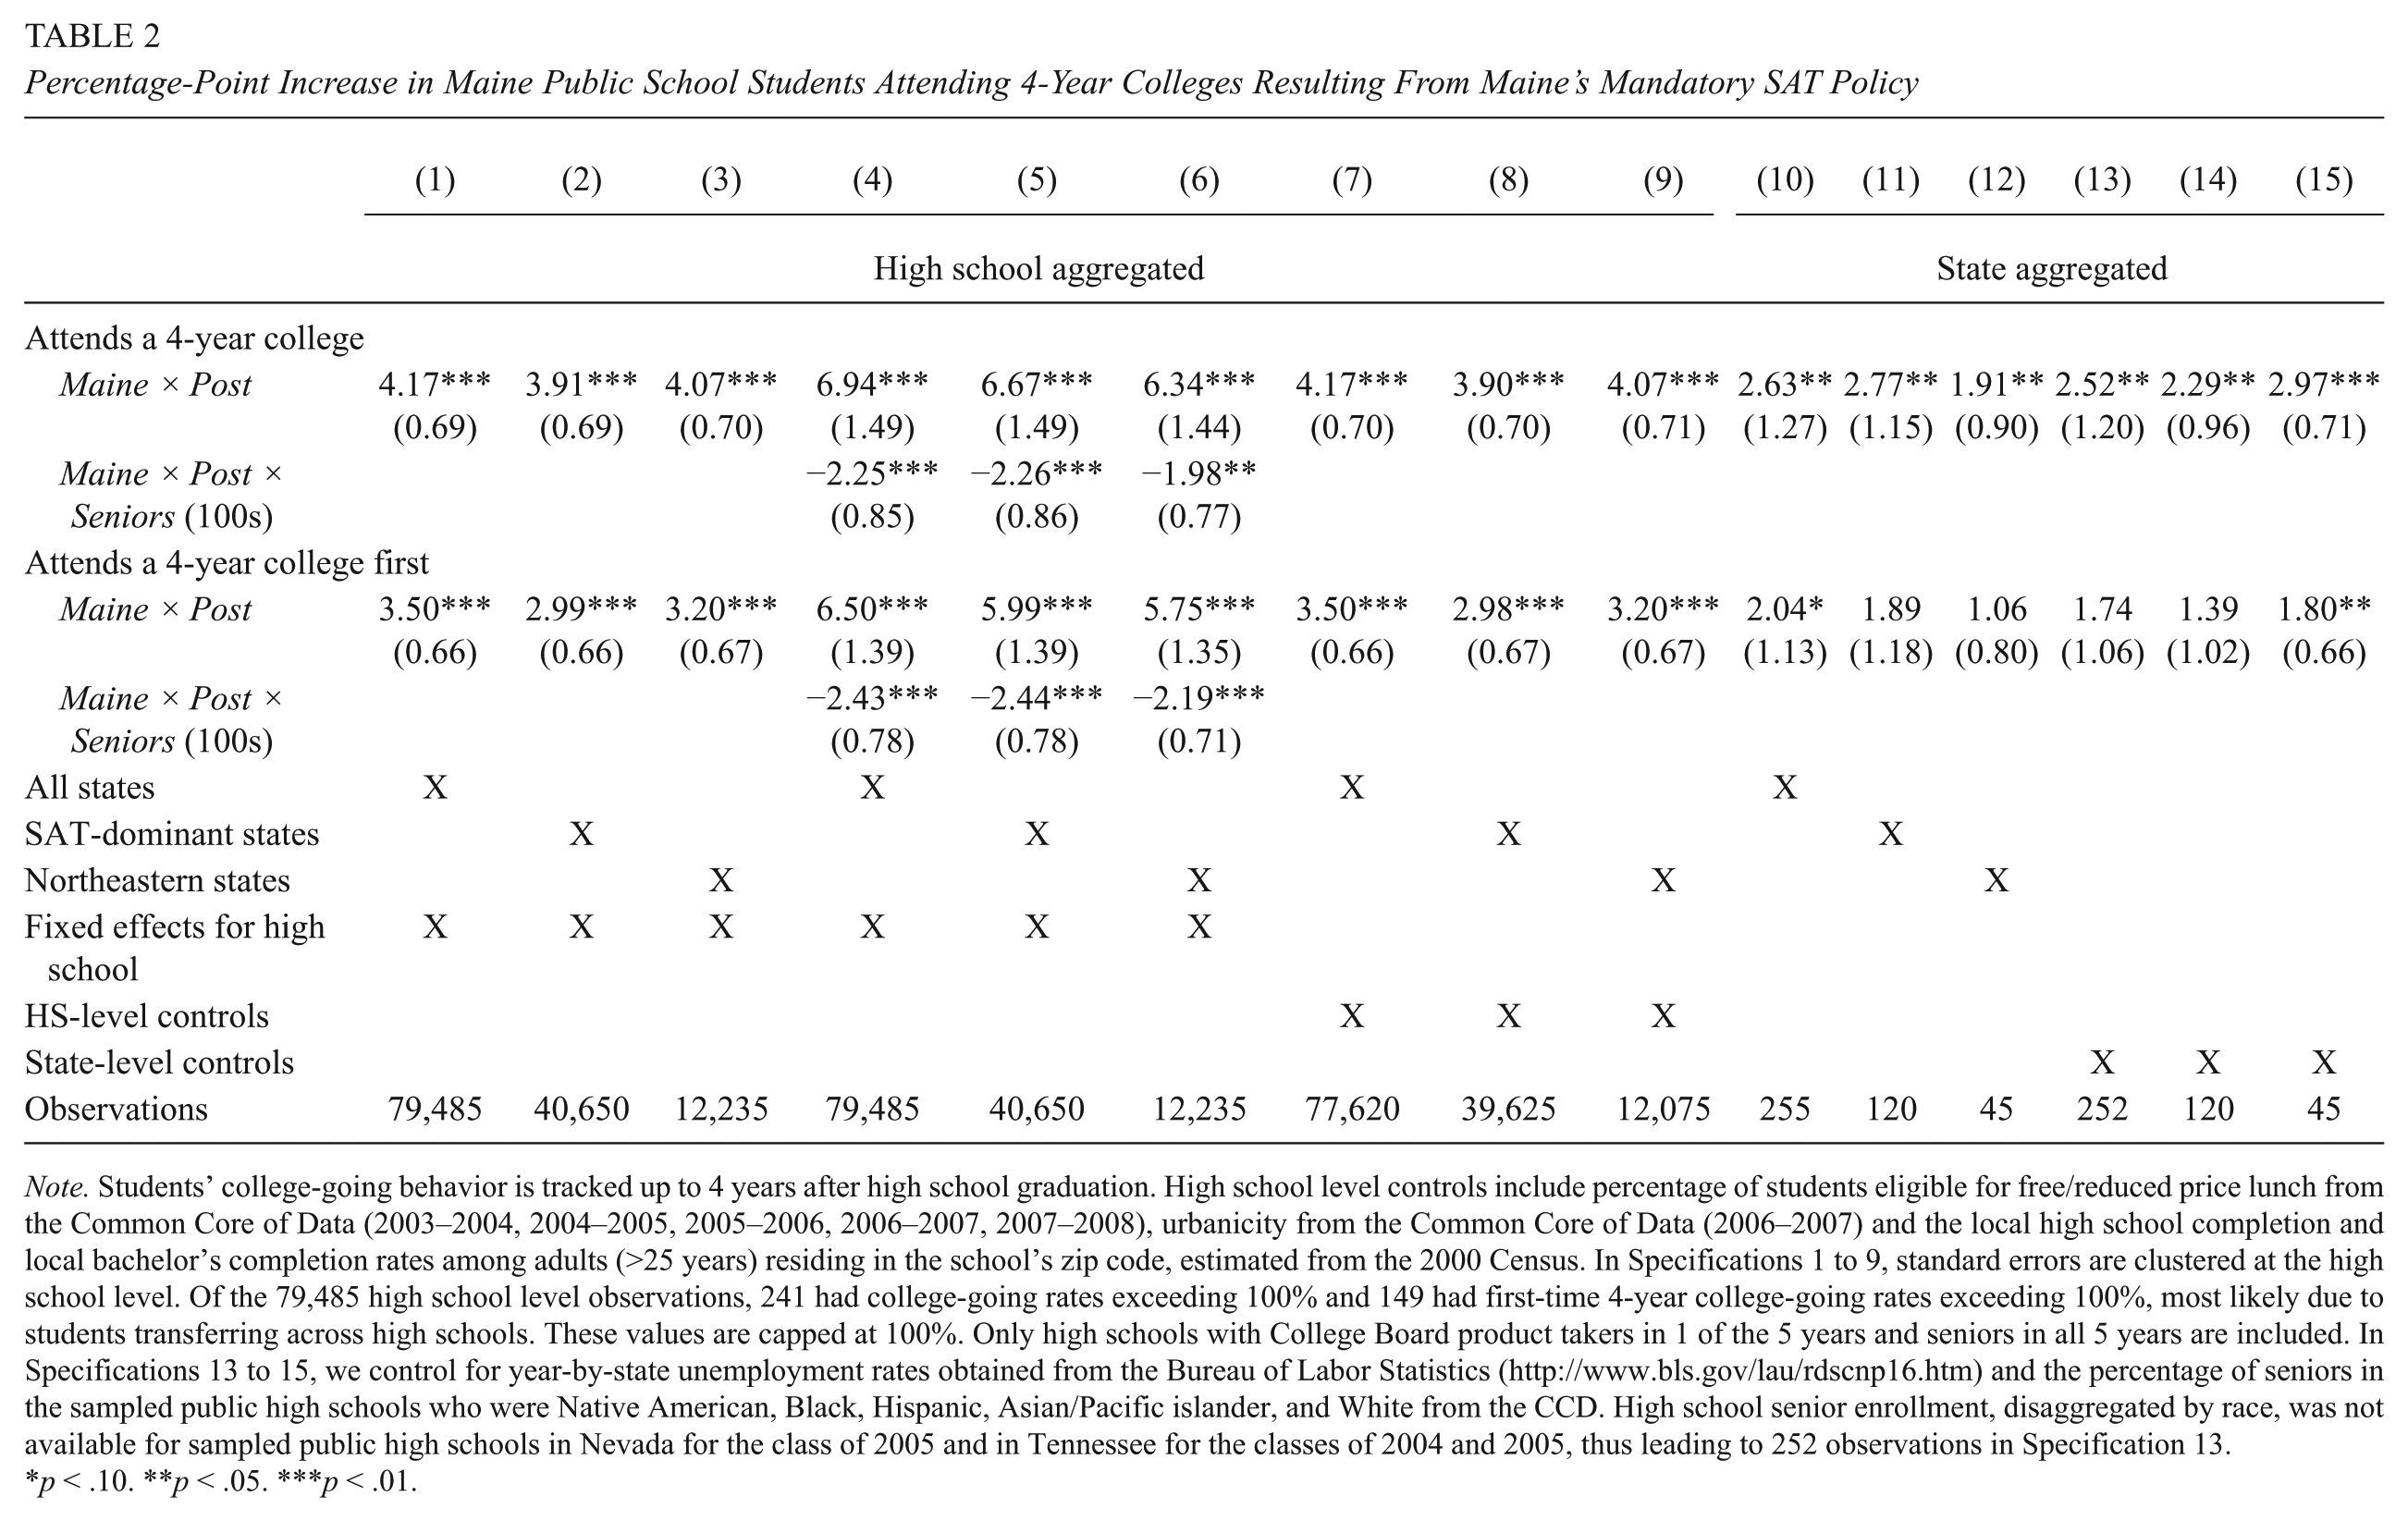
Note. Students’ college-going behavior is tracked up to 4 years after high school graduation. High school level controls include percentage of students eligible for free/reduced price lunch from the Common Core of Data (2003–2004, 2004–2005, 2005–2006, 2006–2007, 2007–2008), urbanicity from the Common Core of Data (2006–2007) and the local high school completion and local bachelor’s completion rates among adults (>25 years) residing in the school’s zip code, estimated from the 2000 Census. In Specifications 1 to 9, standard errors are clustered at the high school level. Of the 79,485 high school level observations, 241 had college-going rates exceeding 100% and 149 had first-time 4-year college-going rates exceeding 100%, most likely due to students transferring across high schools. These values are capped at 100%. Only high schools with College Board product takers in 1 of the 5 years and seniors in all 5 years are included. In Specifications 13 to 15, we control for year-by-state unemployment rates obtained from the Bureau of Labor Statistics (http://www.bls.gov/lau/rdscnp16.htm) and the percentage of seniors in the sampled public high schools who were Native American, Black, Hispanic, Asian/Pacific islander, and White from the CCD. High school senior enrollment, disaggregated by race, was not available for sampled public high schools in Nevada for the class of 2005 and in Tennessee for the classes of 2004 and 2005, thus leading to 252 observations in Specification 13.
p < .10. **p < .05. ***p < .01.
The models fit in Specifications 4 to 6 include variables representing senior enrollment at the high school as well as a three-way-interaction term between Maine, Post, and Seniors. These models clearly demonstrate that the impact of the policy differed by high school senior enrollment such that smaller high schools in Maine experienced larger impacts in both any-time 4-year college-going rates and first-time 4-year college-going rates. With each increase in senior enrollment of 100 students, the impact of the mandatory SAT on 4-year college-going declined by 2- to 2.25-percentage points, such that high schools in Maine with senior enrollments of approximately 300 students would have experienced no impact of the policy on 4-year college-going. Incidentally, this number coincides with the average senior enrollment in Maine’s city schools during the sampled years.
Aggregating observations at the state level, we show that point estimates decrease to the 2- to 3-percentage-point range and standard errors increase slightly. We include two sets of state-aggregated impact estimates in Table 2. The first set of state-aggregated estimates (Specifications 10–12) contains no additional controls beyond state and year fixed effects. In the second set of state-aggregated estimates (Specifications 13–15), we address the possibility of contemporaneous changes over time across states that may influence college-going rates. Changes in labor market conditions facing high school graduates and gradual changes in the student demographics of high school seniors both pose potential threats to the validity of our findings. To test the sensitivity of our results, we fit Equation 2 with the inclusion of state-by-year covariates representing unemployment rates and racial/ethnic composition of the high school seniors. 9 Point estimates are robust to the inclusion of these covariates. In these specifications, clustering observations at the state-level results in smaller standard errors than would be estimated using the traditional ordinary least squares (OLS) variance estimator, so we present these traditional standard errors with the intention of maintaining a conservative approach to our inferences (Nichols & Schaffer, 2007).
After aggregation at the state level, all estimates of the mandatory SAT on any-time 4-year college-going rates remain statistically significant at the 0.05 level. By contrast, the coefficients on first-time 4-year college-going, which were statistically significant when the high school was used as the unit of aggregation, are generally not significant at the 0.05 level. The loss of statistical significance when this second measure is, at least in part, due to the fact that induced students constitute an academically marginal group who might seek out 2-year colleges before making the leap into the 4-year college pipeline. However, the ratios of the parameter estimates on first-time 4-year college-going to any-time 4-year college-going suggest that between one half and three quarters of all induced students began at 4-year postsecondary institutions.
Although only the parameter estimates associated with first-time 4-year college-going lose their statistical significance when data are aggregated at the state level, aggregating data up to the state-level results in modest decrease in the magnitudes of the point estimates. As previously noted, the mandatory SAT appears to have jolted the 4-year college-going rates by the largest amount among Maine’s smaller high schools. When data are aggregated at the high school level, smaller schools are effectively given the same weight as larger schools, which leads to point estimates higher than those found after data are aggregated at the state level.
TOT Estimates
Thus far, estimates have been ITT estimates. Roughly 57% of Maine public high school seniors participated in the SAT prior to the mandate in the 2006 cohort. In the 2007 cohort, more than 86% of Maine’s public high school seniors took an “official” version of the SAT. 10
In Table 3, we present the TOT estimates of Maine’s mandatory SAT policy. Rather than providing an overall summary of the policy’s ramifications, these estimates detail changes in college-going rates among just the subset of students who would not have taken the SAT in the absence of a mandate. We present the TOT results from aggregating data at the high school level (Specifications 1 and 2) and from aggregating data at the state level (Specifications 3 and 4).
Percentage-Point Increase (TOT) in Maine Public School Students Attending 4-Year Colleges Resulting From Maine’s Mandatory SAT Policy
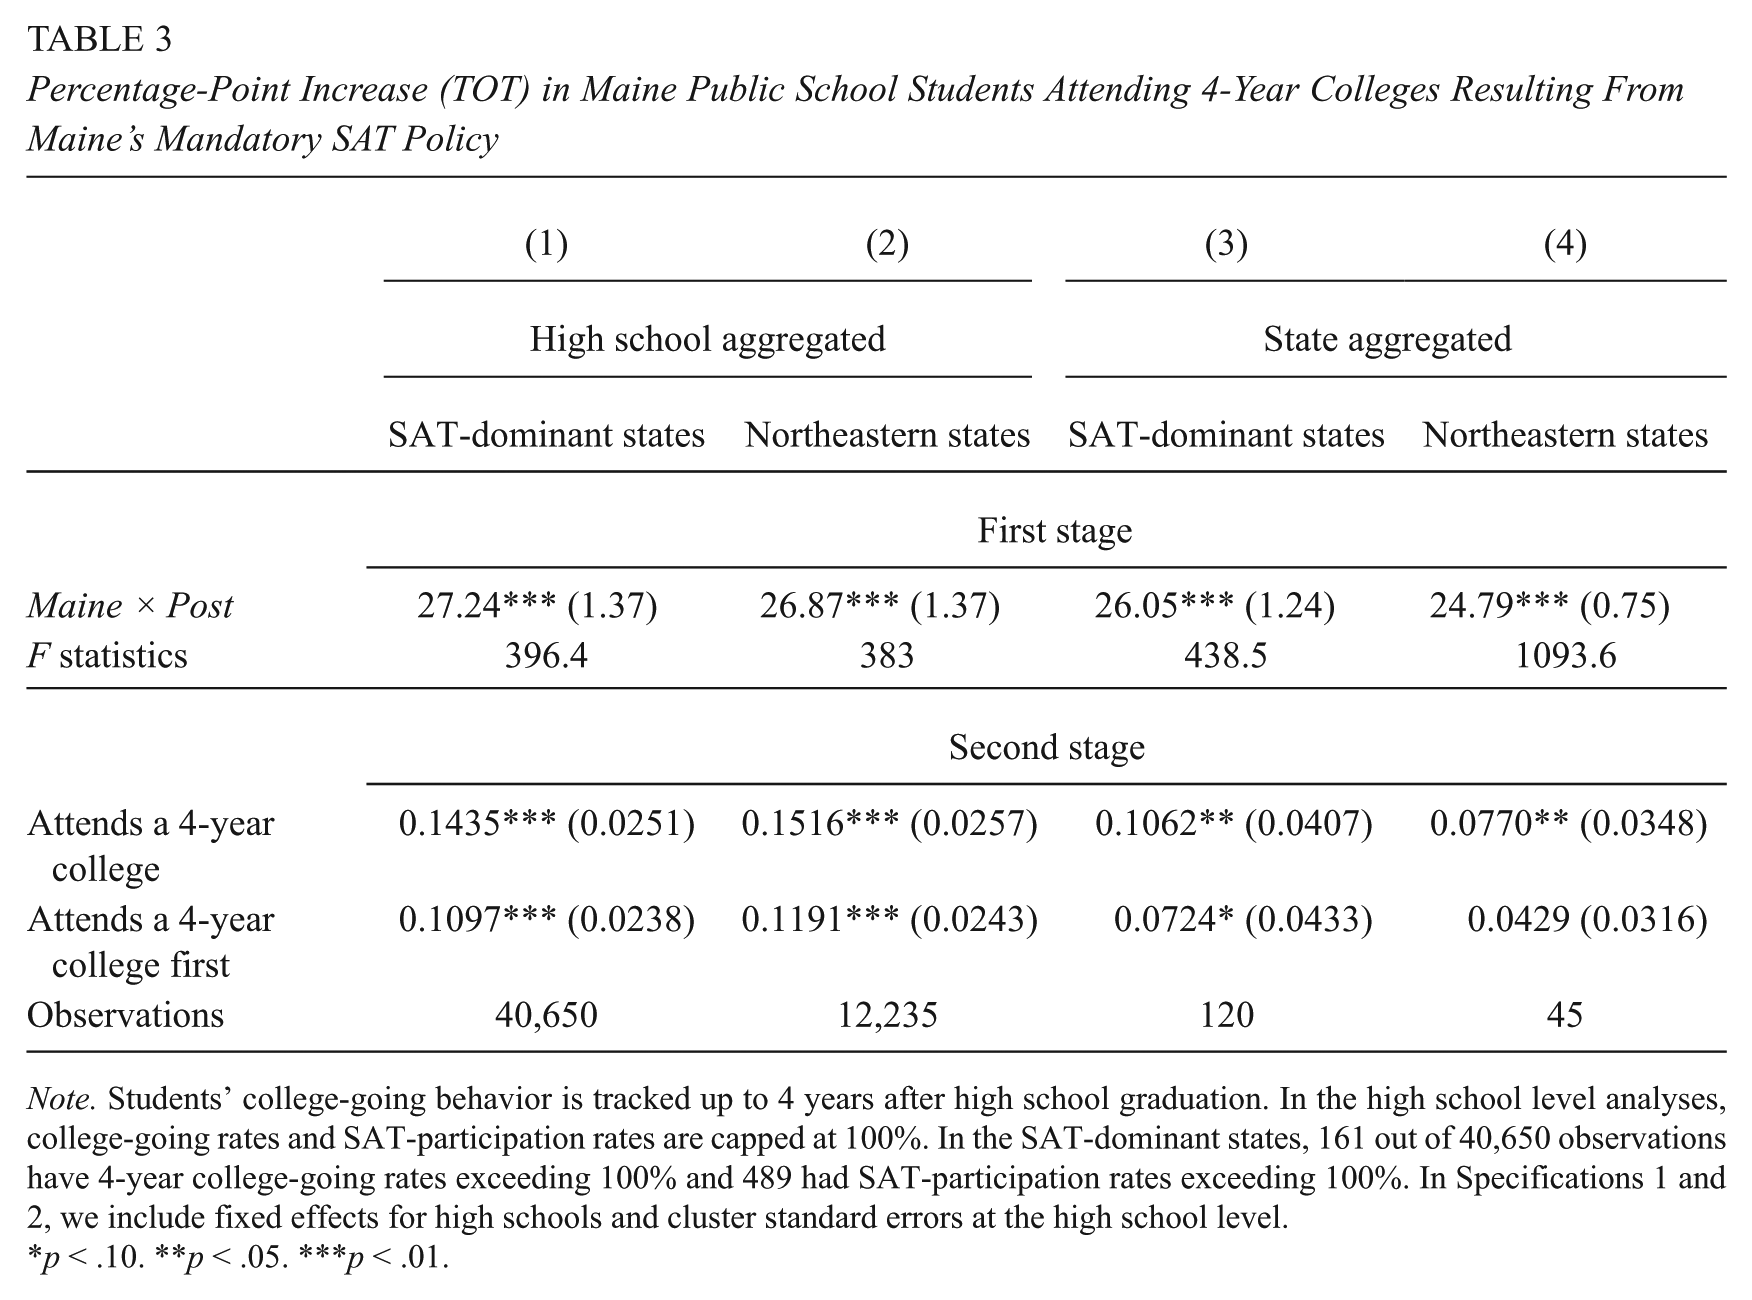
Note. Students’ college-going behavior is tracked up to 4 years after high school graduation. In the high school level analyses, college-going rates and SAT-participation rates are capped at 100%. In the SAT-dominant states, 161 out of 40,650 observations have 4-year college-going rates exceeding 100% and 489 had SAT-participation rates exceeding 100%. In Specifications 1 and 2, we include fixed effects for high schools and cluster standard errors at the high school level.
p < .10. **p < .05. ***p < .01.
Results from the first stage suggest that the changes in SAT uptake rates increased by about 25-percentage points postpolicy. The suitability of the first-stage instrument is confirmed by the large F statistics associated with the Maine × Post interaction term, which comfortably exceed the lower-bound threshold of 10 recommended for 2SLS estimation (Staiger & Stock, 1997). Second-stage estimates represent the causal impact of the mandatory SAT on induced students. The results in Table 3 indicate that a 1-percentage-point increase in SAT test-taking rates yields an approximately 0.1-percentage-point increase in 4-year college-going rates. Restated, among students induced into SAT test-taking through the Maine SAT policy, about 10% ultimately went on to attend a 4-year postsecondary institution. As in Table 2, aggregation at the state level generates more conservative estimates of policy impact. To maintain the most conservative approach to our inference drawing, we only show results from state-aggregated data moving forward.
Heterogeneous Impacts
Table 4 reveals the differential impacts of the mandatory SAT on students from high schools with different urbanicity. To obtain the estimates in Table 4, we fit Equation 2 after aggregating all data by high school urbanicity and then by state. In this table, we present the ITT estimates and the TOT estimates.
Percentage-Point Increase (ITT and TOT) in Maine Public School Students Attending 4-Year Colleges Resulting From Maine’s Mandatory SAT Policy, by School Urbanicity
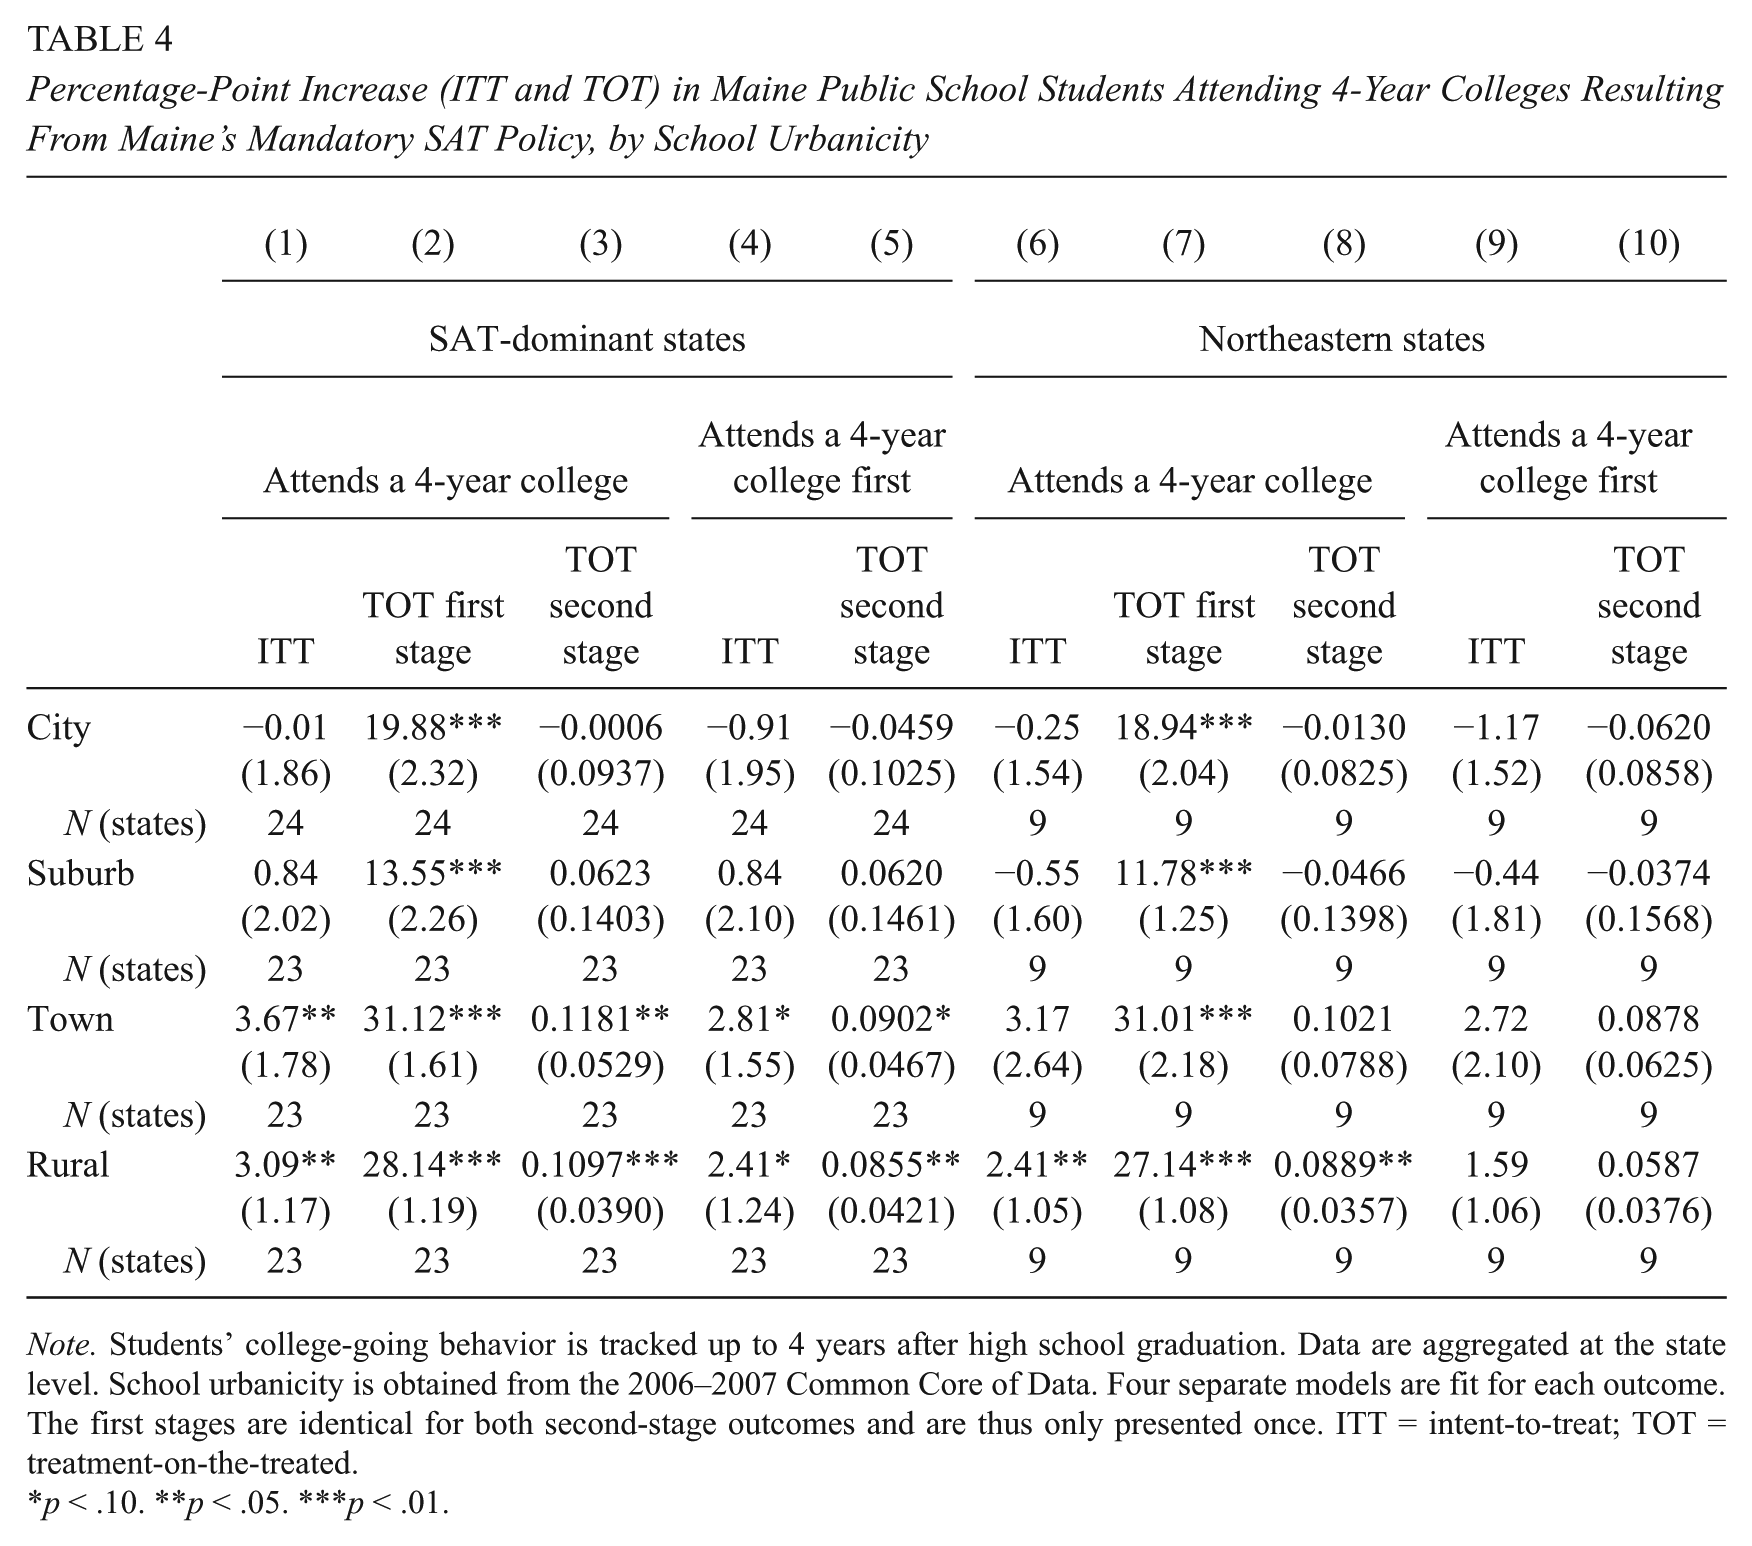
Note. Students’ college-going behavior is tracked up to 4 years after high school graduation. Data are aggregated at the state level. School urbanicity is obtained from the 2006–2007 Common Core of Data. Four separate models are fit for each outcome. The first stages are identical for both second-stage outcomes and are thus only presented once. ITT = intent-to-treat; TOT = treatment-on-the-treated.
p < .10. **p < .05. ***p < .01.
As in “TOT Estimates” section, the first-stage estimates indicate the percentage-point increase in SAT test-taking rates after the SAT mandate. Among students from schools in rural areas and in small towns, the SAT test-taking rates increased by nearly 30-percentage points as a result of the mandate. This increase was considerably larger than the increase found among students from suburban public high schools of 12- to 14-percentage points. For the 2007 cohort, the SAT test-taking percentages varied little by urbanicity, ranging from 84% in city and rural schools to 90% in small-town schools.
The ITT and TOT estimates in Table 4 clearly show that the increase in 4-year college-going rates in the wake of Maine’s mandatory SAT policy was driven primarily by students in Maine’s rural and small-town public schools and that about 1 in 10 of the induced students ultimately entered the 4-year postsecondary pipeline. No significant impact of the mandatory SAT on 4-year college-going was found among students from Maine’s city and suburban high schools. This story echoes other studies of college selection and match, which identify students from sparsely populated geographic regions as being at a disadvantage in the college application process (Hoxby & Avery, 2013; Hoxby & Turner, 2013).
In Table 5, we present the heterogeneous impacts of Maine’s mandatory SAT policy by free/reduced price lunch percentages of students’ high schools and local adult education attainment levels (all above or below national median). Although a few of the ITT and TOT estimates are statistically significant in this table, there is no clear link between local socioeconomic status and policy impact. Taken together with the findings in Table 4, Table 5 suggests that population density, as measured by urbanicity, moderates the effects of the mandatory SAT policy on 4-year college-going, whereas the local population’s socioeconomic status—at least in the Maine context—does not.
Percentage-Point Increase in Maine Public School Students Attending 4-Year Colleges Resulting From Maine’s Mandatory SAT Policy, by Selected School-Level or Local Demographics (SAT-Dominant States)
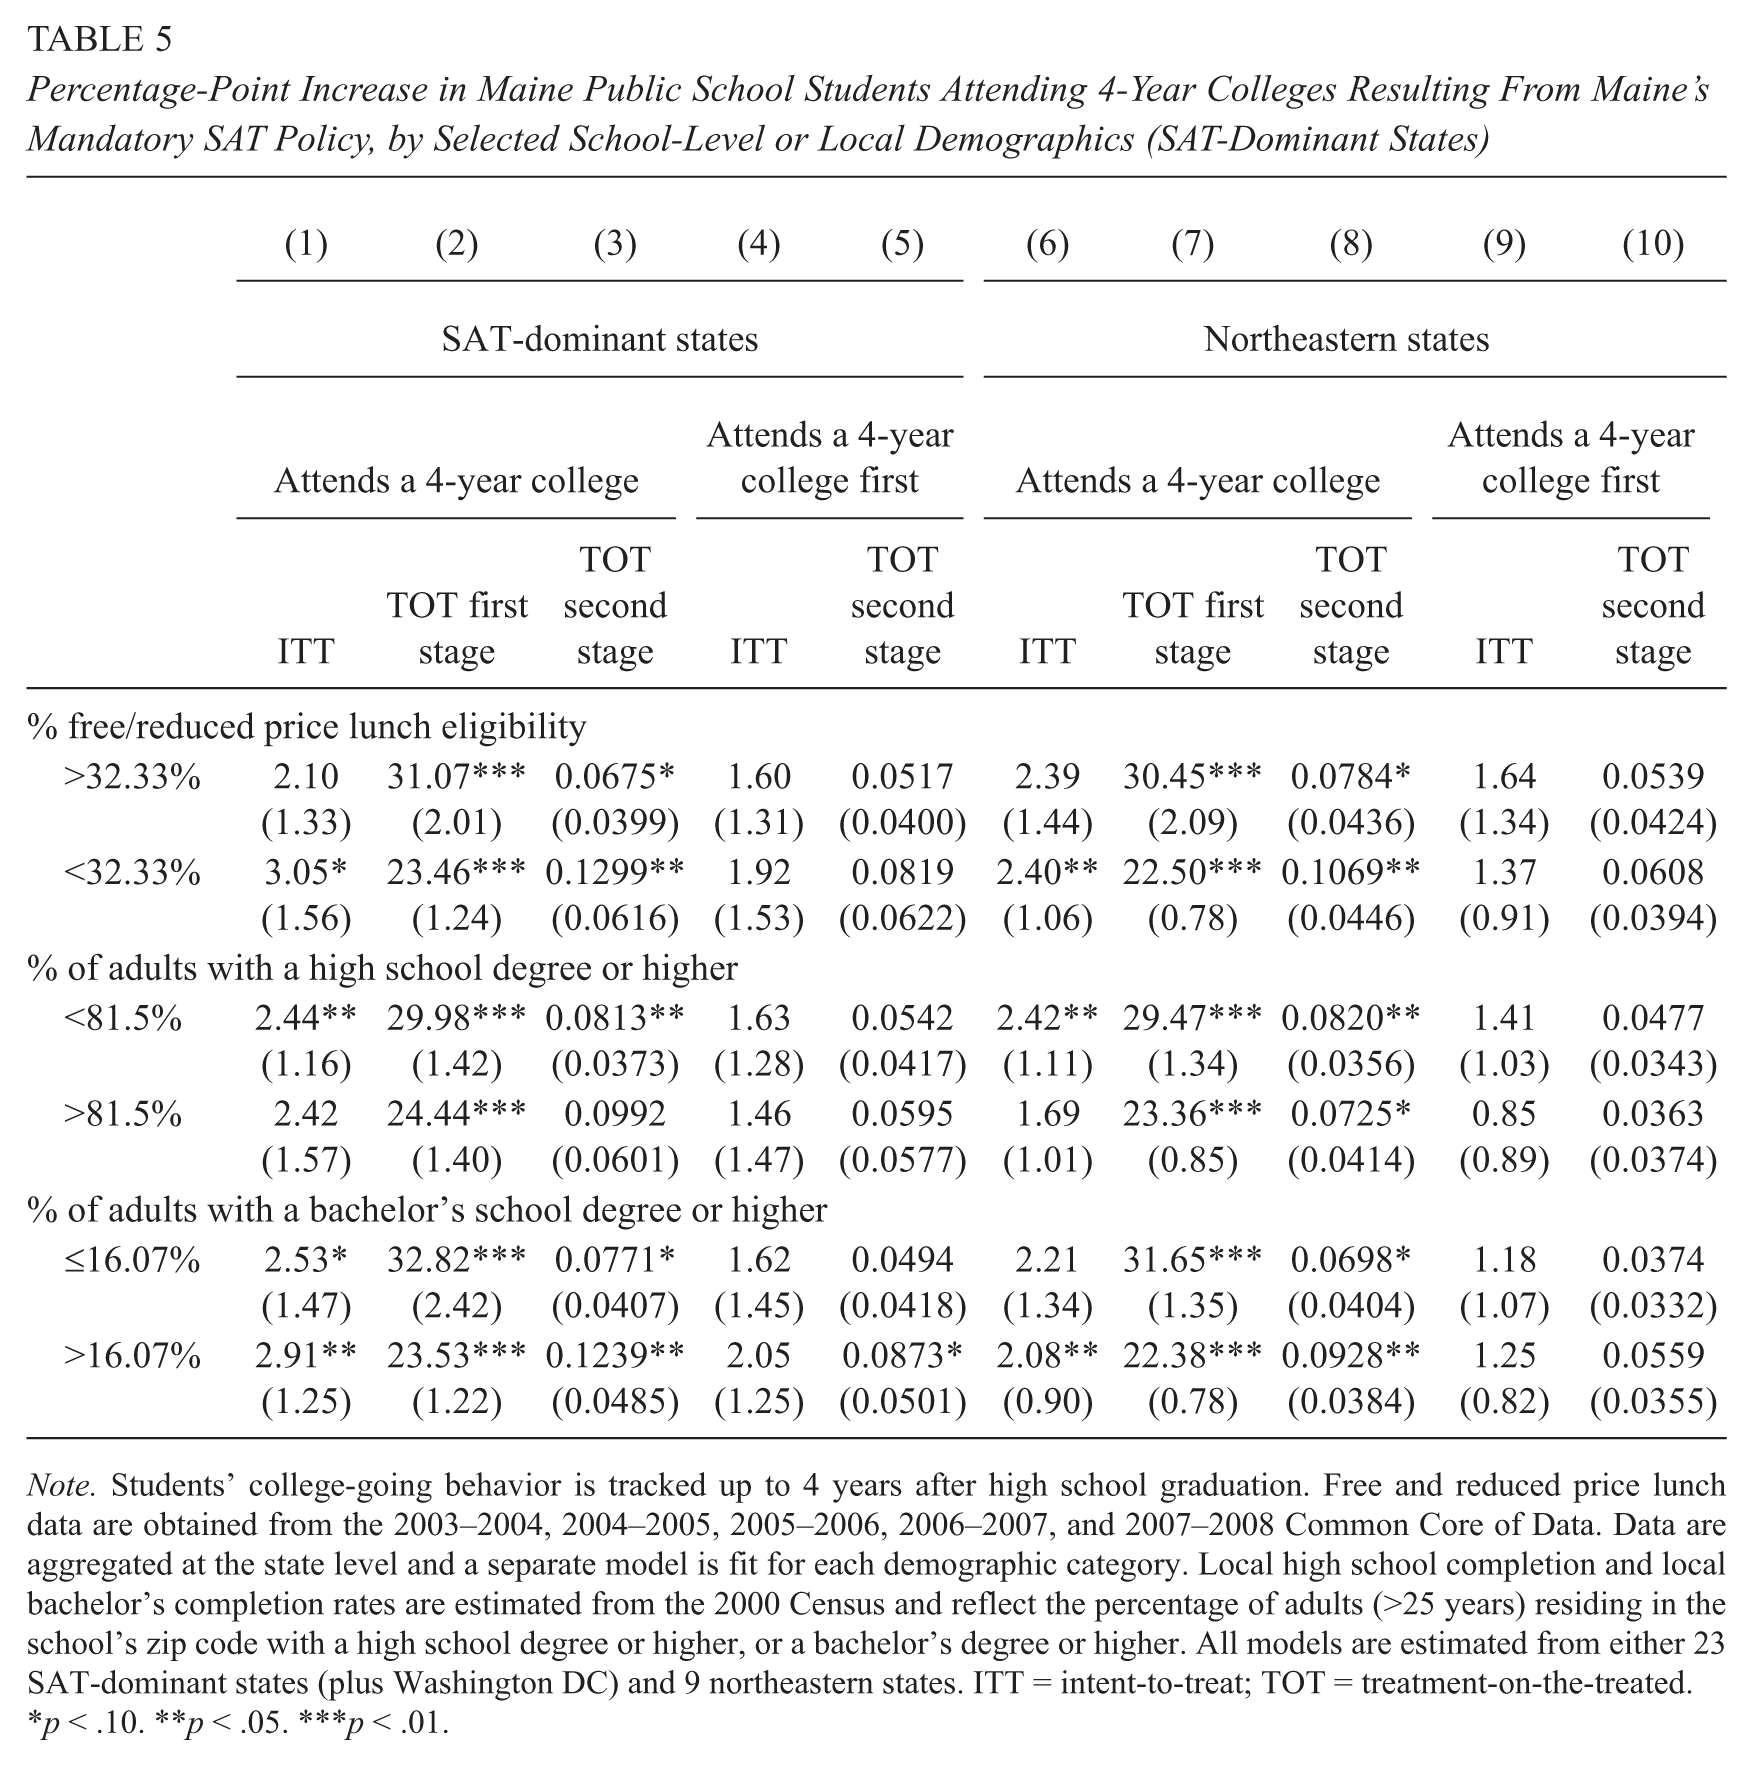
Note. Students’ college-going behavior is tracked up to 4 years after high school graduation. Free and reduced price lunch data are obtained from the 2003–2004, 2004–2005, 2005–2006, 2006–2007, and 2007–2008 Common Core of Data. Data are aggregated at the state level and a separate model is fit for each demographic category. Local high school completion and local bachelor’s completion rates are estimated from the 2000 Census and reflect the percentage of adults (>25 years) residing in the school’s zip code with a high school degree or higher, or a bachelor’s degree or higher. All models are estimated from either 23 SAT-dominant states (plus Washington DC) and 9 northeastern states. ITT = intent-to-treat; TOT = treatment-on-the-treated.
p < .10. **p < .05. ***p < .01.
Early Bachelor’s Attainment Rates
Next, we test whether the mandatory SAT has increased the number of bachelor’s degree recipients from Maine’s public high schools. While it is too early to capture the entirety of the impact on bachelor’s attainment rates, we can offer some preliminary evidence by estimating the policy impact on bachelor’s degree attainment within 4 and 5 years of graduating from high school. As Table 6 shows, the percentage of seniors holding a bachelor’s degree 4 years beyond high school graduation increased slightly in Maine from 17.1% for the 2004 through 2006 cohorts to 17.9% for the 2007 and 2008 cohorts. This increase in bachelor’s attainment rates was surpassed very slightly by the increases found in both sets of control states. Extending the time frame by 1 year, we find that the percentage of Maine’s public school seniors who obtained a bachelor’s degree within 5 years increased by 1.6-percentage points from that found among the three premandate cohorts (25%) to that found for the 2007 cohort (26.6%)—the final cohort for which we were actually able to measure 5-year degree attainment. The two sets of control states experienced similar changes in 5-year bachelor’s attainment rates. For all pre–post mandate comparisons, the simple differences in bachelor’s attainment rates are statistically significant.
Percentage-Point Increase (ITT) in Bachelor’s Degree Attainment Rates Within 4 to 5 Years of Having Graduated From High School Among Maine Public School Students Accompanied by Graduation Rate Descriptive Statistics
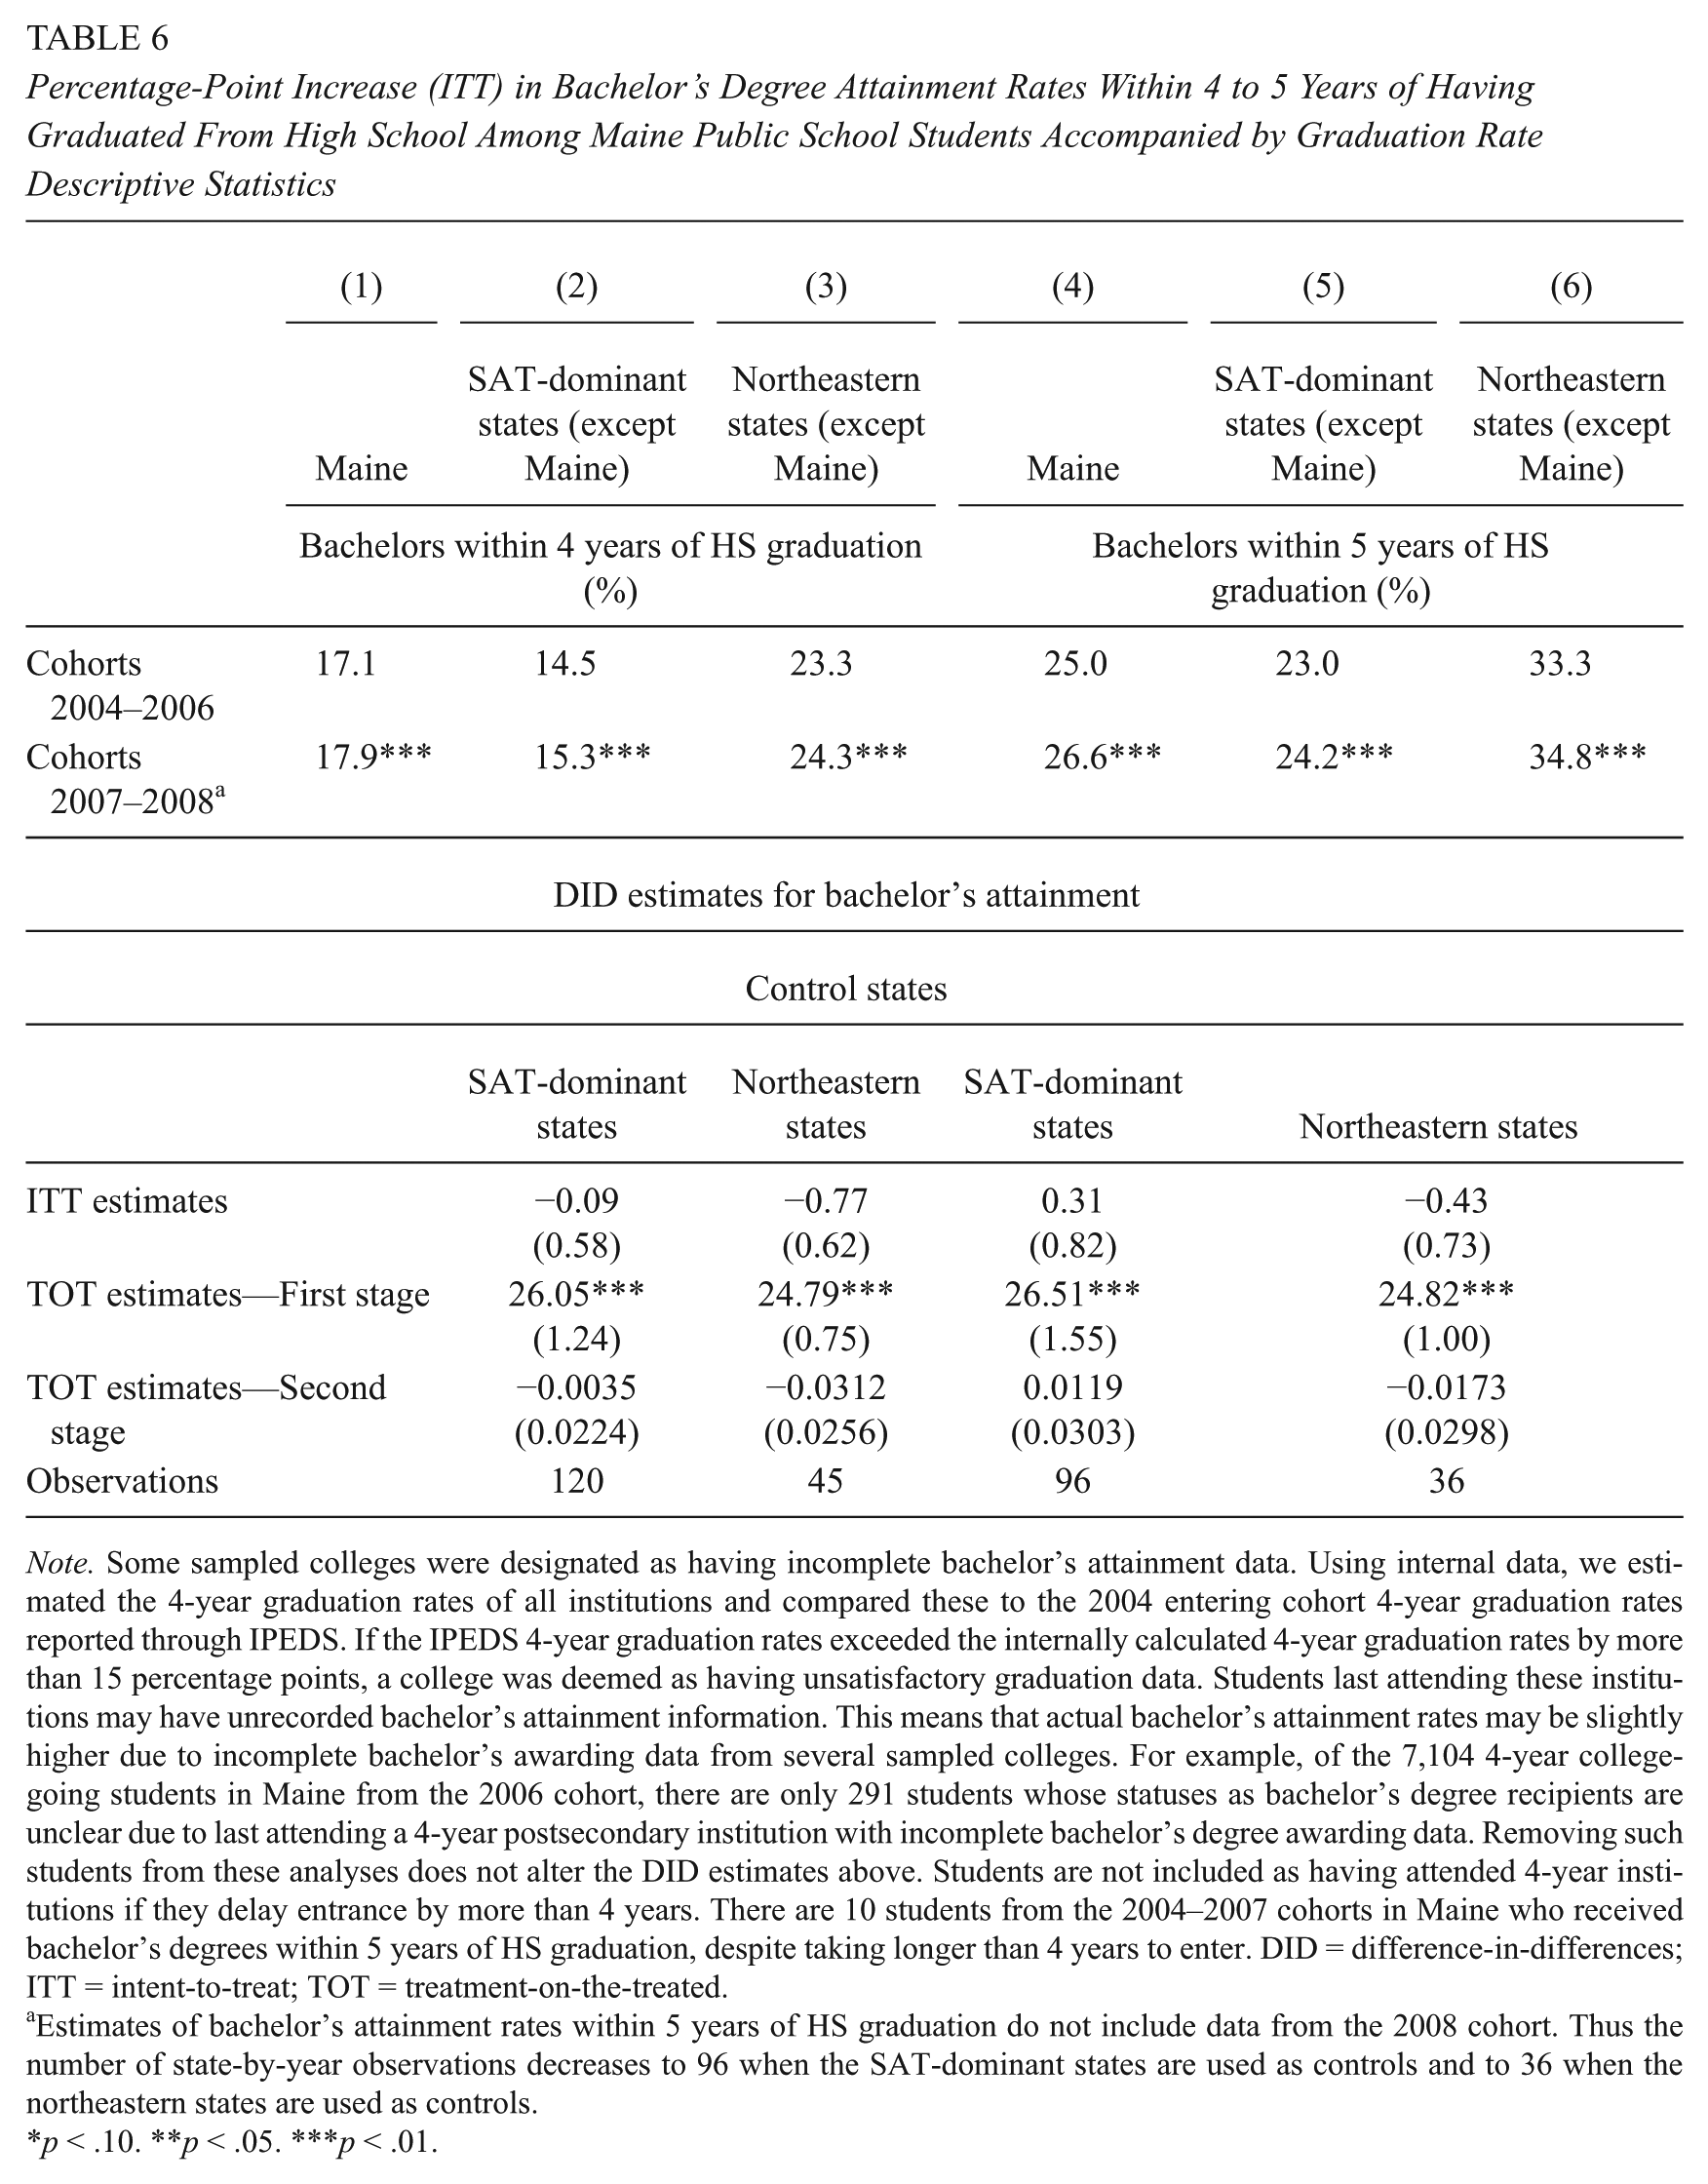
Note. Some sampled colleges were designated as having incomplete bachelor’s attainment data. Using internal data, we estimated the 4-year graduation rates of all institutions and compared these to the 2004 entering cohort 4-year graduation rates reported through IPEDS. If the IPEDS 4-year graduation rates exceeded the internally calculated 4-year graduation rates by more than 15 percentage points, a college was deemed as having unsatisfactory graduation data. Students last attending these institutions may have unrecorded bachelor’s attainment information. This means that actual bachelor’s attainment rates may be slightly higher due to incomplete bachelor’s awarding data from several sampled colleges. For example, of the 7,104 4-year college-going students in Maine from the 2006 cohort, there are only 291 students whose statuses as bachelor’s degree recipients are unclear due to last attending a 4-year postsecondary institution with incomplete bachelor’s degree awarding data. Removing such students from these analyses does not alter the DID estimates above. Students are not included as having attended 4-year institutions if they delay entrance by more than 4 years. There are 10 students from the 2004–2007 cohorts in Maine who received bachelor’s degrees within 5 years of HS graduation, despite taking longer than 4 years to enter. DID = difference-in-differences; ITT = intent-to-treat; TOT = treatment-on-the-treated.
Estimates of bachelor’s attainment rates within 5 years of HS graduation do not include data from the 2008 cohort. Thus the number of state-by-year observations decreases to 96 when the SAT-dominant states are used as controls and to 36 when the northeastern states are used as controls.
p < .10. **p < .05. ***p < .01.
These similarities in trends between Maine and the two sets of control states foreshadows the DID impact estimates found at the bottom of Table 6. None of the ITT or TOT estimates differ from zero, suggesting that at least over the period of time considered, Maine’s mandatory SAT policy did not result in a measureable increase in bachelor’s degree attainment. 11 In light of the magnitude of impact estimates on 4-year college-going, these null findings are not surprising. If all induced students were to graduate within 4 or 5 years of high school graduation, the mandatory SAT in Maine would have increased bachelor’s completion rates by about 2- to 3-percentage points. Slightly more than half of Maine’s 4-year college attendees hold a bachelor’s degree within 5 years. Of course, as Figure 2 shows, virtually all of the induced students scored less than a 1,050 on the math and critical reading sections of the SAT. Only about 44% of students with these SAT scores from the 2006 high school graduation cohort received bachelor’s degrees within 5 years of high school graduation. Applying this graduation rate to a 3-percentage point increase in 4-year college-going rates, we would expect the mandatory SAT policy in Maine to increase the bachelor’s completion rate by only 1.3-percentage points. It is unlikely that such a small increase would be statistically detectable through our analyses.
Although the ITT estimate of Maine’s policy impact on the percentage of high school seniors obtaining bachelor’s degrees 5 years beyond high school graduation does not differ significantly from the 1.3-percentage point estimate cited above when the SAT-dominant states shape the control group, it does differ significantly when northeastern states shape the control group. If Maine’s mandatory SAT policy did accomplish an improvement in bachelor’s degree attainment, there are two primary explanations for the zero impact estimates despite the noted increase in 4-year college-going rates. First, between one quarter and one half of the induced students began at 2-year institutions, and bachelors aspiring students may face completion penalties by first attending 2-year institutions (Long & Kurlaender, 2009). Second, the marginal students who were induced into attending 4-year postsecondary institutions may simply take longer to complete. Perhaps the 5-year period beyond a student’s high school graduation is an inadequate time frame over which the policy’s true impact on bachelor’s completion can be measured. The evolution of a bachelor’s degree impact may occur 6 or 7 years beyond high school graduation.
Synthetic Control Group Analyses
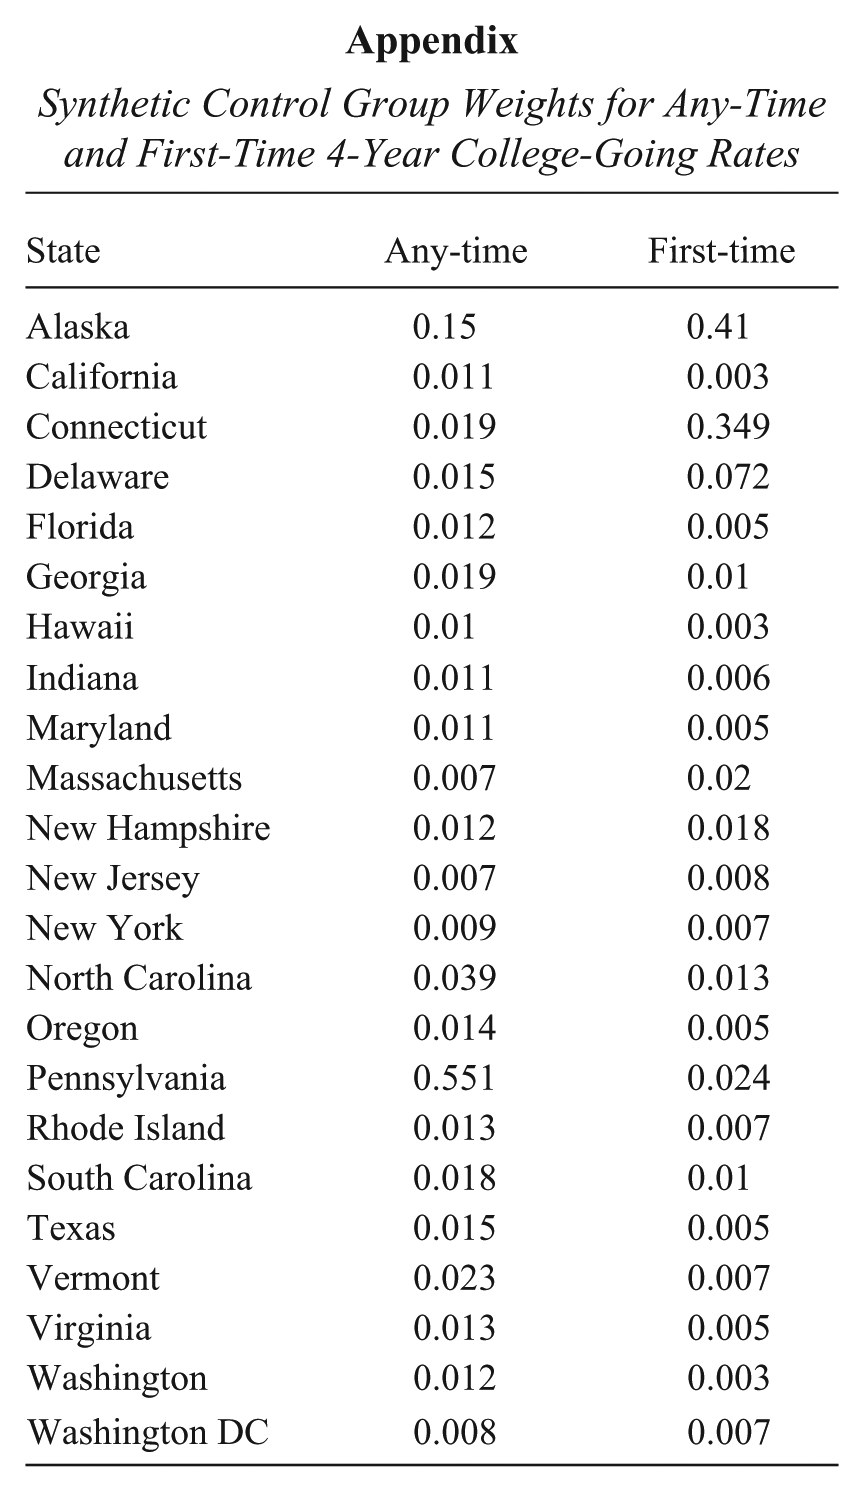
Next, we develop a synthetic control group, and in Figure 3, we plot the any-time 4-year college-going rates and the first-time 4-year college-going rates for the synthetic Maine (dashed line) and the actual Maine (solid line). The synthetic Maine represents a weighted combination of the SAT-dominant states, with the weights included in Appendix. When states that mimic Maine more closely are assigned more weight, we find a policy impact of 3- to 4-percentage points on any-time 4-year college-going rates and nearly 4-percentage points on first-time 4-year college-going rates.
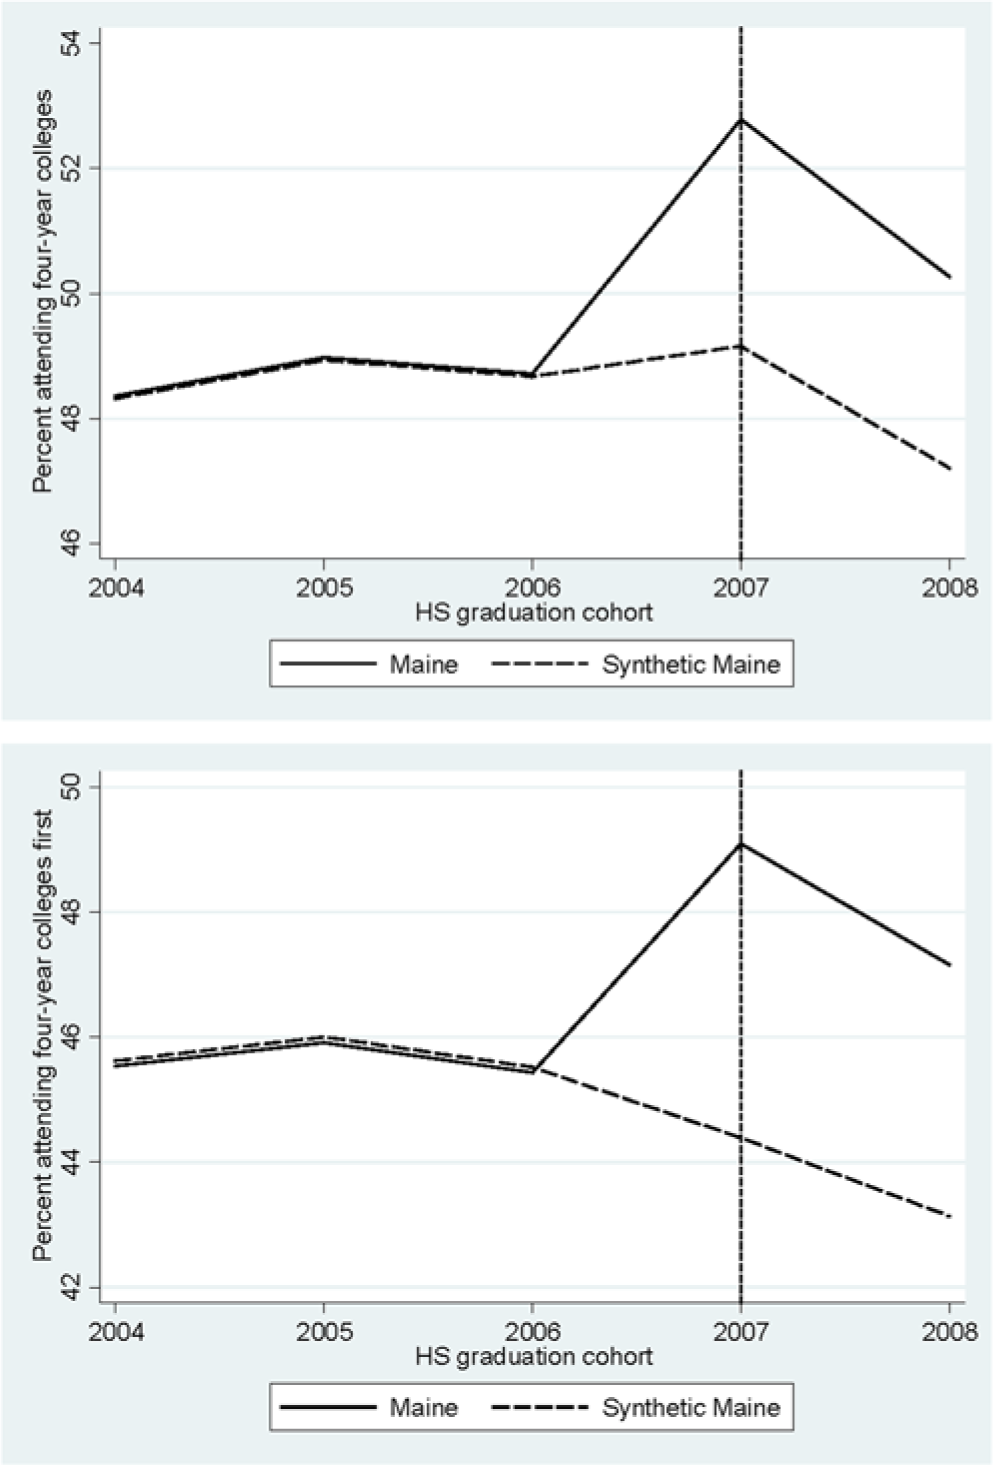
Synthetic control group analyses of any-time and first-time 4-year college-going rates.
The synthetic control group estimates on any-time 4-year college-going are somewhat larger than what we obtained through traditional DID type analyses; however, once the standard errors associated with the DID estimates are considered, differences in the any-time 4-year college-going estimates are not statistically significant. By contrast, the synthetic control group estimates for first-time 4-year college-going are considerably higher than the state-aggregated DID estimates of 1- to 2-percentage points and the simple difference of 2.5-percentage points. The large weight assigned to Alaska, which experienced a sharp downturn in first-time 4-year college-going from 39.5% for the 2006 high school cohort to 35.4% for the 2008 cohort, is at least partially responsible for the lofty synthetic control impact estimates of first-time 4-year college-going. Our reliance on the DID estimates, rather than the synthetic control group estimates, throughout this article reinforces our position of erring on the side of conservative.
Summary and Discussion
Benefits of a College Admissions Examination Mandate
Our analyses reveal evidence of a 2- to 3-percentage-point increase in any-time 4-year college-going rates attributable to the mandatory SAT. Using data from Integrated Postsecondary Education Data System (IPEDS) and the Current Population Survey, Klasik (2013) also examined the impacts of mandatory college admissions exams on 4-year college-going, finding varied results across the three states in his analyses. In Maine, Klasik estimates that the mandatory SAT increased 4-year college-going by 0- to 6.6-percentage points. Our point estimates fall midway between these two estimates identified by Klasik for Maine, but are accompanied by smaller standard errors. Depending on the model specifications used, Klasik finds mixed results regarding the mandatory ACT’s impact on 4-year college-going in Colorado, ranging from a decline in enrollment of 7% to an increase in enrollment likelihood of 9.9-percentage points, and generally larger, positive impacts of the mandatory ACT on 4-year college-going probabilities in Illinois. Also focusing on Illinois and Colorado, Goodman (2012) finds that between 39% and 45% of 11th graders were induced into taking the ACT, and this mandate was accompanied by a sizable increase in college enrollment where the average composite ACT scores exceeds 22—or the 62nd percentile.
At this point, it is still too early to conclude firmly whether the policy resulted in an increase in the fraction of Maine high school graduates who earn bachelor’s degrees, as the more marginal students induced into the 4-year postsecondary pipeline may take longer to complete their degrees. In the worst case scenario in which the policy has no impact on the number of Maine’s public high school seniors who obtain bachelor’s degrees, the mandatory SAT policy may still confer some real advantages. There is evidence that students with some college education reap the rewards of their postsecondary education in terms of enjoying higher earnings (Ashenfelter & Krueger, 1994; Baum, Ma, & Payea, 2010). The returns to higher education, even in the absence of degree attainment, are not only pecuniary in nature. Positive spillovers from additional years of education include improved infant health, reduced smoking rates, and decreases in crime incidence (Baum et al., 2010; Currie & Moretti, 2003; Lochner & Moretti, 2004).
Student Demand
Figure 4 shows that Maine’s public and private postsecondary institutions accommodated the increased student demand for postsecondary education following the SAT mandate. There was virtually no change in the number of Maine’s public high school graduates migrating out of state for college, and much of the increase in bachelor’s degree completion was also concentrated in Maine’s colleges. As Bound and Turner (2007) show, many postsecondary institutions, at least in the short term, tend to be capacity constrained and can only flexibly increase the supply of enrollment spots to a point. If the demand for higher education in Maine exceeded the supply of enrollment spots across Maine’s colleges following the SAT mandate, then such capacity constraints might place a cap on the potential impact of any policy increasing student demand for college. 12
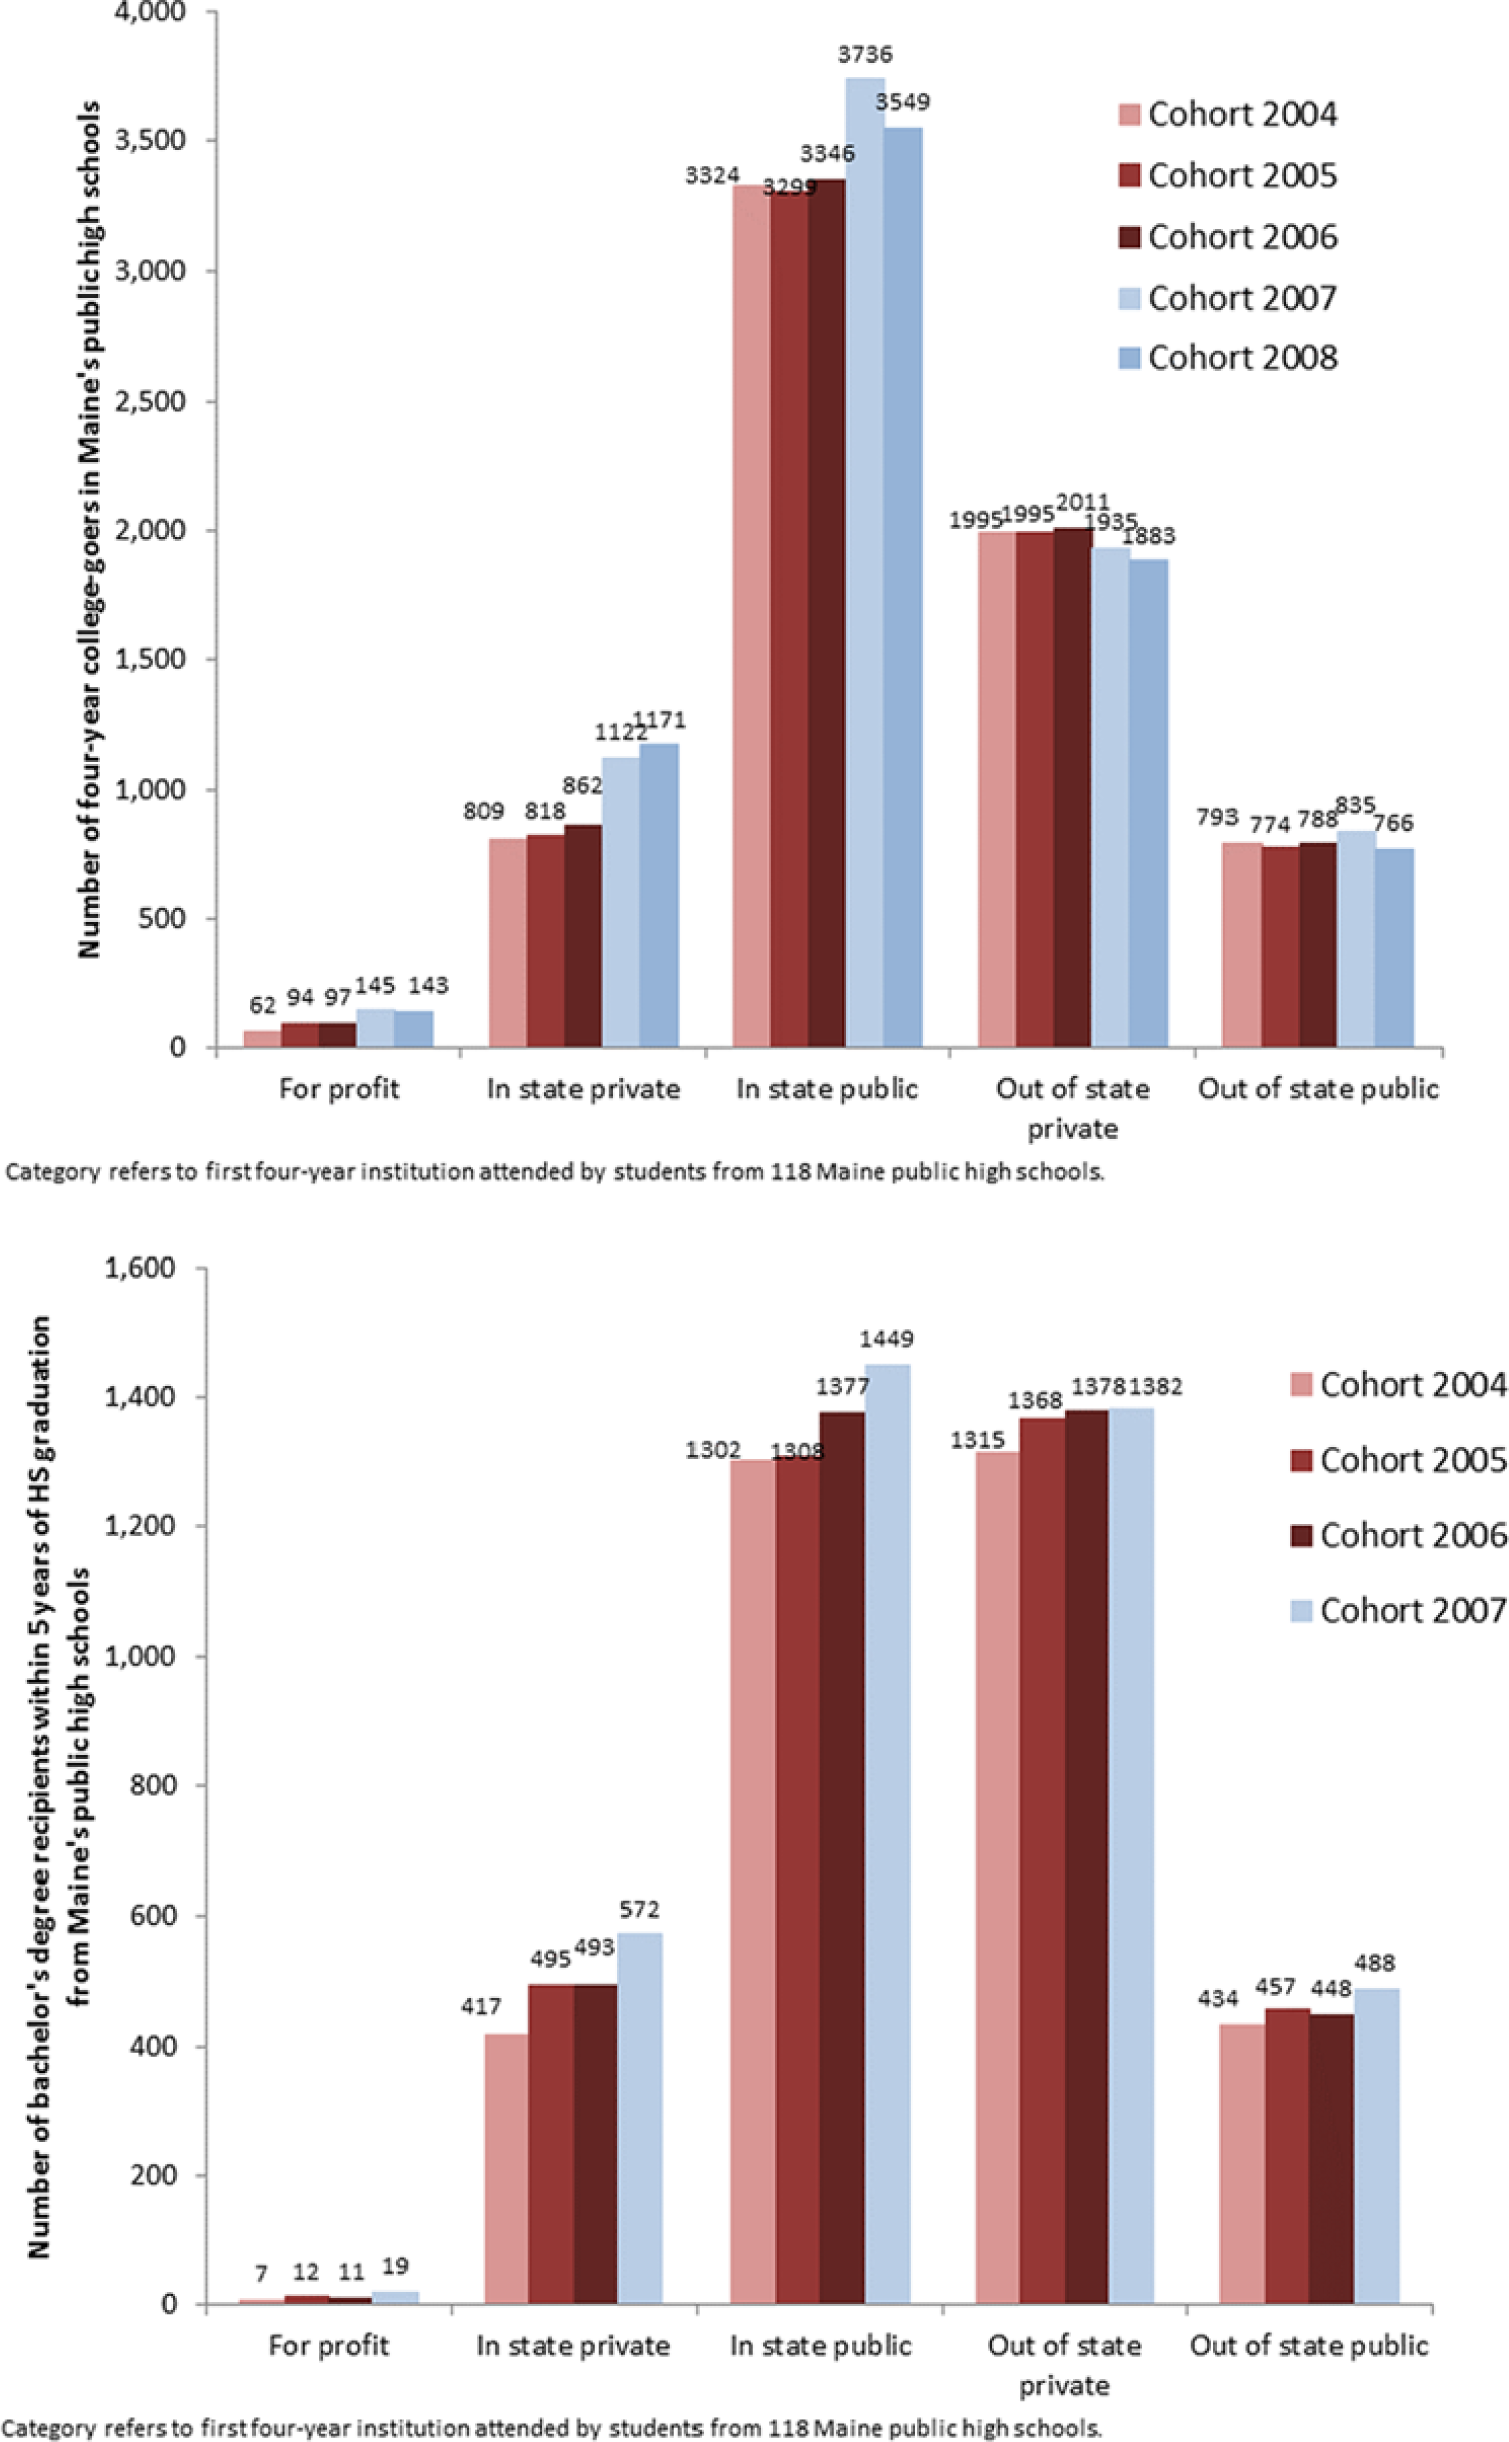
College-going and bachelor’s degree attainment within 5 years of high school graduation among Maine’s public high school graduates, by high school graduation cohort and sector of first 4-year college.
Is the Mandatory SAT a Cost-Effective Measure for Inducing College Enrollment?
To ascertain whether the Maine SAT mandate is a cost-effective policy to increase 4-year college-going rates, we compare our results with those found in other studies investigating state grant aid directives also implemented to increase college-going. There is a general consensus that an extra US$1,000 (US$2011) in grant aid increases college enrollment by roughly 3-percentage points. 13 Our most conservative estimates suggest that the mandatory SAT policy in Maine increased 4-year college-going by 2-percentage points. Using this elasticity measure, we estimate that the state of Maine would need to provide each 4-year college-going student with around US$666 in grant aid to achieve the same increases in enrollment as the SAT mandate. Assuming an inability to selectively target students whose decisions to attend college would be influenced by this grant aid, we estimate that such a grant aid program would cost Maine around US$4.7 million per year. 14 In the unlikely scenario that the state of Maine could isolate only those students who could be enticed into enrolling at a 4-year college through an institutional grant aid, the program would cost the state around US$186,000 per year.
The total costs of implementing Maine’s SAT program are about US$1 million per year. These costs include the actual cost of the SAT itself as well as administrative fees, such as payment to test proctors. The total cost ended up being slightly more expensive than the legacy Main Education Assessment (MEA) test. Had Maine not opted to use the SAT to satisfy its NCLB accountability requirements, it would have continued to face the costs of the MEA exam. Therefore, as a substitute for an existing accountability exam, the mandatory SAT represents a much more cost-effective measure of boosting college-going rates than providing state grant aid.
Footnotes
Appendix
Synthetic Control Group Weights for Any-Time and First-Time 4-Year College-Going Rates
| State | Any-time | First-time |
|---|---|---|
| Alaska | 0.15 | 0.41 |
| California | 0.011 | 0.003 |
| Connecticut | 0.019 | 0.349 |
| Delaware | 0.015 | 0.072 |
| Florida | 0.012 | 0.005 |
| Georgia | 0.019 | 0.01 |
| Hawaii | 0.01 | 0.003 |
| Indiana | 0.011 | 0.006 |
| Maryland | 0.011 | 0.005 |
| Massachusetts | 0.007 | 0.02 |
| New Hampshire | 0.012 | 0.018 |
| New Jersey | 0.007 | 0.008 |
| New York | 0.009 | 0.007 |
| North Carolina | 0.039 | 0.013 |
| Oregon | 0.014 | 0.005 |
| Pennsylvania | 0.551 | 0.024 |
| Rhode Island | 0.013 | 0.007 |
| South Carolina | 0.018 | 0.01 |
| Texas | 0.015 | 0.005 |
| Vermont | 0.023 | 0.007 |
| Virginia | 0.013 | 0.005 |
| Washington | 0.012 | 0.003 |
| Washington DC | 0.008 | 0.007 |
Declaration of Conflicting Interests
The author(s) declared no potential conflicts of interest with respect to the research, authorship, and/or publication of this article.
Funding
The author(s) received no financial support for the research, authorship, and/or publication of this article.
1.
The mandatory ACT policy in Colorado and Illinois affected the high school class of 2002 and beyond. These were later followed by Michigan’s class of 2008, Kentucky’s class of 2009, and Tennessee’s class of 2010. Since 2010, Delaware and Idaho have adopted the SAT.
2.
The 2009 high school graduation cohort and beyond in Maine were required to take the PSAT in addition to the SAT, and we do not include these cohorts to isolate the effects of the mandatory SAT and to allow students up to 4 years to enroll in college.
3.
Klasik does find a statistically significant increase in enrollment as a result of the mandatory SAT in Maine colleges that require the ACT or SAT for admission.
4.
In the first part of his analysis, Klasik (2012) uses IPEDS, which only disaggregates enrollment by state residency every other year. Therefore, his outcomes are college enrollment at Illinois, Colorado, and Maine postsecondary institutions, rather than the number of students from these states who enter postsecondary institutions. In the second part of the analysis, he uses the October supplement to the Consumer Population Survey to estimate college-going rates among 18 and 19 year olds. In each state/year, only a small number of surveyed respondents fall into this age category.
5.
This information was provided by Dan Hupp from the Maine Department of Education.
6.
We use the zip code of the school address despite the fact that student’s address may have different zip codes. Data can be found in the American FactFinder and are based on the 2000 Census.
7.
As an alternative to aggregation, Bertrand, Duflo, and Mullainathan (2004) suggest that individual-level data may be used if the common random effects are accounted for at the state-year level. When the main models in this article are fit using a two-way random intercept model with random effects for state and year, parameter estimates tend to be slightly larger and standard errors smaller, suggesting that, in our case, aggregation at higher levels actually leads to more conservative inferences. For example, when SAT-dominant states serve as the control group and individual-level data are fit with a two-way random effects model, the parameter estimate and standard error associated with the Maine × Post interaction term are 2.86 (SE = 0.37), compared with 2.77 (SE = 1.15) when data are aggregated at the state level (see ![]() ).
).
8.
Although the estimates presented are population estimates, standard errors provide insight into the likelihood that Maine experienced the documented estimates by random chance, and they also provide a range of plausible impact estimates should other states like Maine adopt mandatory SAT policies.
9.
State-by-year unemployment rates are obtained from the Bureau of Labor Statistics (![]() ). In Specifications 13 to 15, we include covariates for the percentages of seniors in each state in year t who are Native American, African American, Hispanic, White, and Asian. These student race covariates are collected from the 2003–2004 through 2007–2008 Common Core of Data files.
). In Specifications 13 to 15, we include covariates for the percentages of seniors in each state in year t who are Native American, African American, Hispanic, White, and Asian. These student race covariates are collected from the 2003–2004 through 2007–2008 Common Core of Data files.
10.
This number is less than 100% because some students had the option of taking the SAT under nonstandard conditions that are not “official” College Board tests.
11.
This is also true for students in rural high schools that saw the largest increases in enrollment.
12.
We do find some evidence that students from Maine may have displaced out-of-state students at Maine’s postsecondary institutions. For example, IPEDS data (and our data confirm this figure) indicate that the number of in-state first-time degree-seeking undergraduates who graduated from high school within the past year increased at the University of Maine–Orono from 1,371 for the fall of 2006 cohort to 1,573 for the fall of 2007. The total size of the incoming class increased by less than 70 students between these 2 years.
13.
For example, ![]() evaluates the impact of the Georgia HOPE program on college-going rates and concludes that an additional US$1,000 in grant aid (in 1998 terms) increases college attendance (both 4-year and 2-year) by 3.7% to 4.2%. In current dollars, this elasticity translates into a 2.7- to 3.0-percentage-point increase in college-going rates per US$1,000.
evaluates the impact of the Georgia HOPE program on college-going rates and concludes that an additional US$1,000 in grant aid (in 1998 terms) increases college attendance (both 4-year and 2-year) by 3.7% to 4.2%. In current dollars, this elasticity translates into a 2.7- to 3.0-percentage-point increase in college-going rates per US$1,000.
14.
In this calculation, we assume a population of 14,000 Maine public school seniors and an initial college-going rate of 48%. To increase this college-going rate by 2-percentage point, the state would need to spend about US$4.7 million, calculated as .50 × US$666 × 14,000.
Authors
MICHAEL HURWITZ is an associate research scientist at the College Board. His research interests include higher education policy and practice.
JONATHAN SMITH is an associate research scientist at the College Board. His research focuses on students’ college choices and outcomes.
SUNNY NIU’s research interests include racial/ethnicity differences in the transition to higher education.
JESSICA HOWELL is the executive director of policy research at the College Board. Her research focuses on students’ college choices and outcomes.