
Abstract
In scholarly research, racial categories are typically taken for granted. However, race categories vary over time and geography and reflect the social beliefs of the people who use them. Informed by quantitative critical race theory analysis, we interrogate how race categories align (or not) with 24,000 U.S. higher education students’ responses to ethnoracial identification questions. Students provide a wide range of ethnoracial categorizations when prompted with an open-ended instrument: ethnic/national identities, panethnic identities, resistance to categorization, unknown origins, and racially mixed identities. Quantitative methodologists recommend that survey researchers not use a write-in or open-ended format for racial identification because it introduces error and ambiguity. However, students’ responses show that the race categories provided were not exhaustive or mutually exclusive. This work has policy significance because in early 2024, the U.S. Office of Management and Budget recommended that federal agencies provide respondents with a write-in box and detailed categories when collecting race data.
Keywords
Scholars have long called for more theorization of race in the social sciences (Allen & Chung, 2000; Bonilla-Silva, 2003; Zuberi, 2001) and particularly, in education research (O’Connor et al., 2007). Largely, these calls argue that the concept of race needs to be thoroughly analyzed to understand the various components and how these different pieces impact the effect of race. For example, O’Connor and colleagues (2007) delineated the problems that occur specifically for Black youth when we conceptualize race as culture, thereby ignoring how educational structures and institutions give meaning to race, and when we treat race as a proxy for other, more complex and difficult to measure variables. This leads to, among other problematic conclusions, results that may oversimplify or ignore the intersection of various identities and the heterogeneity of experiences within a racial group. These concerns are intricately connected to how education researchers conceptualize race, how it is operationalized, and how researchers collect race data by asking respondents to categorize themselves according to the researcher’s racial schema. Largely, researchers attempt to use their racial categories as a proxy for racial identities without fully acknowledging the challenges in doing so.
Whereas racial identities are a rich tapestry found within individuals, racial categories are finite groupings often generated by researchers within organizations (Rockquemore et al., 2009) that individuals are expected to slot themselves into. Racial categories reflect how researchers conceive of racial groupings and are often influenced by the prevailing social norms/understandings of the geographic location and historical moment. By using race categories without reflection, researchers fail to see how their own work reifies the notion of racial difference—that these categories reflect some real boundary between groups or that the differences between racial groups are greater than the variation within each group. Rather, the boundaries defining racial categories are political/social groupings that may be meaningful in this moment but are fluid, malleable, and historically and contextually specific, not nearly as neat, objective, and unchanging as some researchers treat such categories.
Race categories in education matter because they are ubiquitously used to measure and represent reality in education. Race categories are used in every school district website, report, or presentation that has a table or pie chart that describes the student body and their achievement. Superintendents and principals talk about student progress using race categories, and teachers and parents hear these messages and understand students within this racial schema. Student race data are collected across educational sectors through numerous instruments. To examine the fluidity, complexity, and contestation that exists when attempting to put students in racial categories, we analyzed responses to a college student survey that asked students to racially and ethnically identify in multiple ways. Higher education is an informative area of education to examine these processes because students fill in this information for themselves (rather than guardians or teachers), allowing us to gain a better sense of the congruence between how an individual racially identifies and researchers’ racial categories.
Our analysis indicates that students’ understandings of their ethnoracial 1 identity in our sample do not always match up with how researchers conceptualize ethnoracial categories: Although the majority of students fit their identity into predefined categories, a sizeable number contested those categories in ways that indicate different conceptualizations of identity than what researchers tend to consider. When these different understandings are not captured, we risk misrepresenting racial identities or, more often, removing those students who do not fit neatly into our ethnoracial categories from our analysis and effectively silencing their voices and discounting their experiences. We use the results of our analysis to inform recommendations to education researchers on how to capture the nuances of student ethnoracial identity. Our work comes with the backdrop of the Office of Management and Budget recommending that federal agencies provide respondents with more racial categories to choose from along with a write-in box.
Racial Identity Versus Racial Category
The research literature in the field of education, specifically, in higher education, has focused a great deal on understanding student racial identity. Traditionally, theories of student racial and/or ethnic identity development were articulated as models that included various stages or levels of experience that unfolded in a more or less linear fashion over the course of time (Torres et al., 2009). Contemporary models have taken issue with the notion of linear development and situated various experiences of racial and ethnic identity within the school and family environment (see, among others, Fish & Syed, 2018; Johnston-Guerrero, 2016; Parker & Neville, 2019). Critical perspectives on student ethnic and racial identity development have further nuanced the theoretical field by examining intersectional identities, such as queer and trans* students of color (Garvey et al., 2019), Black women (Porter & Dean, 2015), and Latinx men (Garcia et al., 2017), and student racial identity development in the context of multiple social identities (Jones & Abes, 2013; Stewart, 2009).
Even though identity researchers acknowledge the fluidity and malleability of racial and ethnic identity conceptually, both at any one point and over time, in practice, researchers take for granted that race categories equate to racial identity and that the relationship between race category and identity is static. For example, when states, institutions, or researchers ask individuals to identify their race, it is unclear exactly what answer they are getting. Morning (2018) argued that how one self-identifies into a racial group is complex and can reflect reasons ranging from genetics to emotions. Rockquemore et al. (2009, p. 27) argued that we must distinguish between racial identity, or how an individual self-identifies; racial category, or the specific racial identification options available in a context; and racial identification, or how others categorize an individual. More recently, Roth (2018) called for more work on the sociology of racial appraisals, like Rockquemore et al.’s racial identification concept. This is similar to López’s (2018) conceptualization of “street race,” or or “what race you look like, based on your skin color, facial features and more” (para.2). López argued that many times, people are treated differently and experience life based on how they appear racially, not how they self-identify. This work asks researchers to conceptualize race as “multidimensional” (Roth, 2018) or as “a bundle of sticks” (Sen & Wasow, 2016). The idea that race is more than one thing contrasts with how we tend to conceptualize racial categories for research and how those data are used when crafting policies at the state, institutional, and organizational levels.
As scholars have argued, racial identity is complex. How a student identifies may vary over time or in how the question is asked (Morning, 2018). How a student identifies themselves may differ from how others identify them, further complicating our understanding of the impact of race on everyday life (López et al., 2018; Rockquemore et al., 2009; Roth, 2018). Race is nuanced and variable, making it quite challenging for researchers to categorize students in ways that are both accurate and measurable. However, we know little about how measured categories compare with lived student racial identity, which is critical if we are to develop measures that better represent students’ racialized experiences. Our data source, a survey administered to more than 24,000 first-year college students that asks students to racially categorize themselves in two different questions while giving the opportunity for them to write in a response, is unique in both the design of the questions and the large number of respondents, enough that we were able to analyze more than 1,300 write-in responses. Using these data to better understand this interplay between categories and individuals, we ask the following research question: In what ways are students’ understandings of racial identity different from the discrete ethnoracial categories provided on surveys?
Data
In studying this question, we draw on quantitative critical race theory (QuantCrit). QuantCrit is a series of seven tenets that provide methodological and epistemological structure to using quantitative methods in a way that is consistent with critical race theory. Drawing on Black feminist thought, particularly Patricia Hill Collins (2002) and Kimberlé Crenshaw (1995), QuantCrit argues that interlocking systems of oppression (e.g., racism, sexism, classism, xenophobia, ableism, etc.) manifest in organizational practices and structures and are foundational to understanding unequal outcomes (Sablan, 2019). QuantCrit begins with recognizing the centrality of racism in all aspects of society and that numbers and data are not neutral but, rather, the product of social processes that reflect the social hierarchy. Although QuantCrit informs our approach to the research question, we pay closest attention to the third tenet. This tenet highlights the importance of categorization, including the need for a critical examination of categories and a recognition that “categories are neither ‘natural’ nor given and so the units and forms of analysis must be critically evaluated” (Gillborn et al., 2018, p. 171). From a QuantCrit perspective, we examine how students’ racial identities correlate (or not) with racial categories. These categories are used in education to shape resource allocation, determine policies, and reproduce status hierarchies.
This study is based on survey data from more than 24,000 first-year students at 21 4-year colleges and universities in the United States. The institutions included in the survey varied in size from the largest public university in the United States (Ohio State University) to small liberal arts colleges with fewer than a thousand students (Beloit College). There were highly selective private institutions (Stanford University) and an open-access community college (Foothills College). The survey instrument was the Online College Social Life Survey, a 15- to 20-minute online questionnaire that primarily focuses on romantic and sexual relationships among higher education students, but begins with questions about basic demographic categories, such as gender, race, and religion. Recruitment for this survey took place in introductory-level sociology courses. Participation was not mandatory, but students were offered extra credit in the course for taking the survey. Very few students opted not to participate, and as a result, the response rate was nearly 100%. In this study, we focus specifically on two questions early in the questionnaire that ask students to describe their race (see Figure 1). The first question asks, “Which of these racial or ethnic groups describes you? (CHECK ALL THAT APPLY)” and offers 14 options, one of which is “Other” with a field for writing in to specify. The second question asks, “If you had to pick one racial or ethnic group to describe yourself, which would it be?” and forces a selection of one of 14 options, with no write-in opportunity. These questions included Asian (e.g., Korean, Vietnamese) and some Latinx (e.g., Mexican American, Puerto Rican) disaggregated national/ethnic origins. 2 We focused on the responses to survey items and open-ended responses using content analysis. Content analysis is an empirical methodology that facilitates the interpretation of meaning from text, images, and context (Krippendorff, 2004). Following Krippendorff’s (2004) guidelines, we identified trends in the responses, developing categories from these observations. Condensing some categories of responses, we developed a set of rubrics with which to code these responses, working both inductively and deductively to allow emergent data to inform subsequent analysis. From this process, we developed themes that shed light on the variations in students’ ethnoracial self-categorization. These themes included national ethnic origin as race, religion as racial identity, and resistance to racial categorization. We discussed and identified cases where we did not converge, and through discussion, we refined our coding strategies and agreed-on coding. These places of disagreement helped us to articulate the nuances and borders of our coding, allowing us to become more precise in our definitions of our categories of analysis.
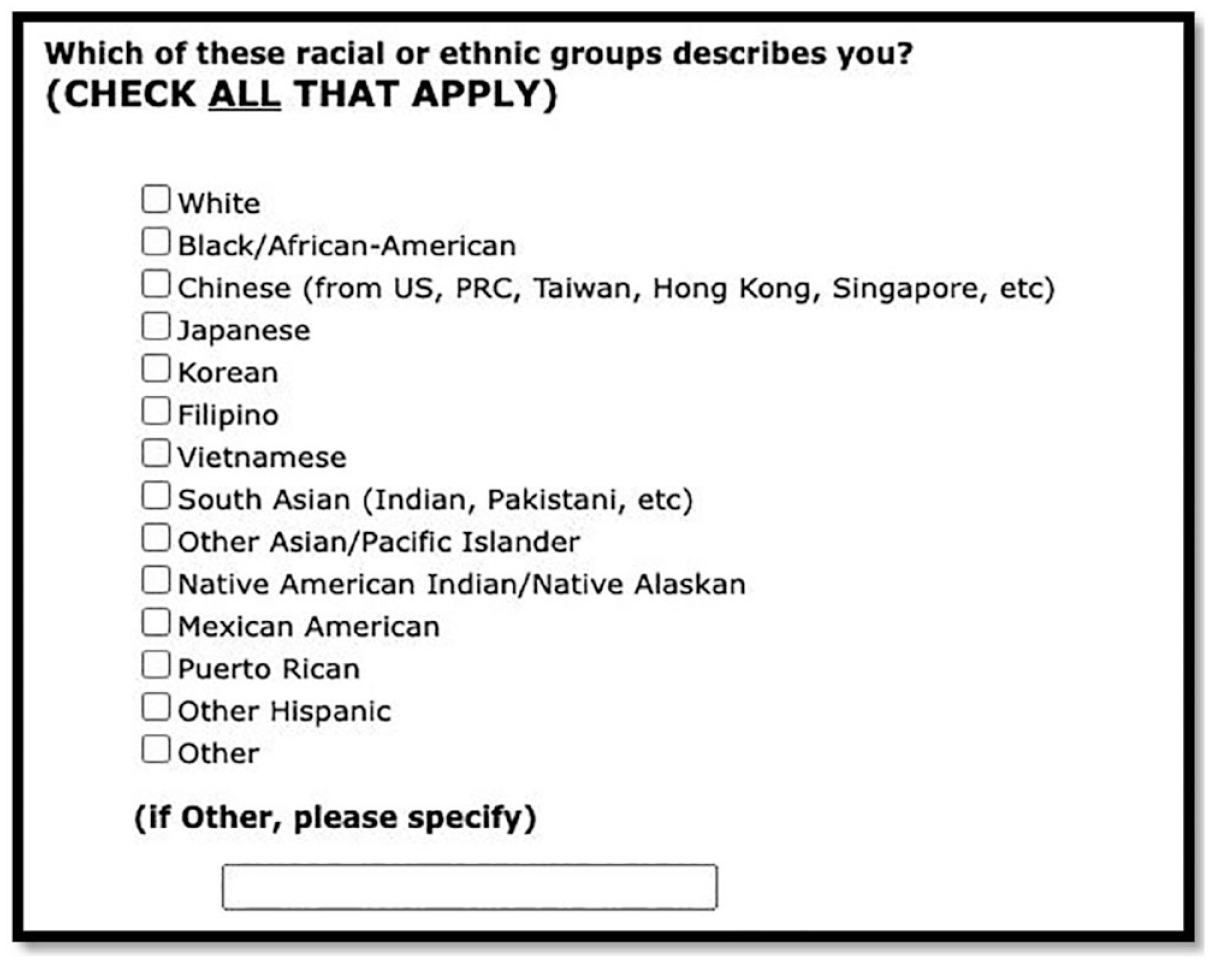
Online College Social Life Survey ethnoracial identification questions (https://pages.nyu.edu/ocsls/2010/questionnaire/).
Researcher Positionality and Trustworthiness
Because our analysis required us to analyze, interpret, and categorize students’ write-in ethnoracial identity responses, we felt it was important to explicitly acknowledge and continually reflect on our own ethnoracial identities throughout this process. QuantCrit recognizes that “data cannot speak for itself”—data are collected, and analyses are performed by people with unique perspectives and worldviews (Gillborn et al., 2018, p. 173). QuantCrit maintains that it is important to acknowledge these views and potential biases, which may influence methodological decisions in many ways that then affect how data are analyzed and interpreted. In this vein, we aimed to be cognizant of how our own ethnoracial identities, experiences, and assumptions influenced our analysis and interpretation of students’ responses.
The first author is mixed-race, Black, Indo-Guyanese, and White. She grew up in Guyana, the United Kingdom, and the United States, where she experienced a range of racial categories. For example, in Guyana, where people mixed with Black and Indian descent make up 20% of the population, there is a racial category for that group (Dougla). In the United States, the race category of “Black” is an umbrella that includes anyone with any discernible African heritage. These experiences of living within differing racial categories, both temporal and contextual, mean that boundaries of racial categories have never been naturalized for her but always fluid and socially constructed. The second and third authors are White Americans in terms of their racial identity and in how they are frequently categorized by others (racial appraisal). They identify with the racial category, “White,” on surveys. We used our different experiences with interacting with racial identity, categorization, and categories to inform our coding. We worked together to be aware of how these different experiences affected our understanding of the data and to check any assumptions we might have made about students’ experiences and the meanings behind their write-in responses.
The first two authors each coded a sample of the data and worked together to develop a coding schema. They then each coded the full data set and compared codes, discussing and assessing any inconsistencies. During this process, the researchers acknowledged assumptions and their own positionality and engaged in self-reflecting dialogues about the coding process. A research assistant was then brought in to code the data a third time based on the codebook that had been created from the initial coding and discussion. This coding was checked against prior coding for consistency and reliability.
Limitations
There is much to be learned from this large survey sample and the descriptive results we analyzed herein. For example, the sample of 24,000 students was needed to yield the array of write-in response types that students provided. Five percent of the sample (1,300 students) provided these write-in responses, so a smaller study would not have been able to capture the variation and patterns that we were able to see with this large sample. We recognize that an in-depth interview study would allow us to delve deeper into how students make meaning of these categorizations and the ways that they appear to be contesting the categorization schema with their write-in responses. In the discussion section of the article, we are careful not to overstate our findings because we can only describe how students reported their categorizations, but we use other literature to suggest how and why they are contesting the boundaries of the categorization schema that was provided for them. We hope to extend this work by doing an in-depth interview study of that nature.
Future research that includes interviews may also help us understand more about the changing nature of racial identity over time. Our study provides an understanding of how college students think about racial categorizations at one early point in their college careers. First-year students, like those in our sample, may be engaging in important ethnic identity exploration as they navigate the transition to college, although research suggests their commitment to an identity increases over the course of their first 2 years (Zhou et al., 2019). Our findings are meant to highlight the broad issue in education research of how survey attempts at racial categorization may not align with how students actually identify, using this particularly large data set as an interesting case to demonstrate this.
Findings
Selecting an Ethnoracial Category From the Options Provided
The vast majority of the sample, 95%, responded by selecting an ethnoracial category from those provided and not using the write-in box. From a “race is socially constructed” framework, it appears that race has been so well constructed that 95% of students have been racialized in a way that they can map their identities onto the ethnoracial schema provided. For these students, the category choices matched their self-identities sufficiently enough that they did not use the write-in box. Or at the very least, the student found that after years of being asked survey questions like this one, there is a category that works reasonably for them. Figure 1 provides a screenshot of the categorization choices that students were presented at the time of the survey.
The balance of the findings investigated the responses of 5% of the sample, 1,300 students who did in fact write in their racial self-identity, presumably because they did not find the categories on the survey sufficient to represent them.
We find that students provided a range of ethnoracial categorizations. Students employed five broad but distinctive response types in the open-ended response: ethnic/national origin, pan-ethnicity, multiple ethnoracial categories, unknown ancestry, and resistance to categorization (Table 1). These response types are not mutually exclusive. 3 We present each response type with examples.
Response Types

Ethnic/National Origins
Ethnic origins and nationalities were quite salient to students who chose to write in their response. For example, students wrote in nationalities (that also indicate ethnic origins) such as Italian, Nigerian, and Peruvian. Students are thinking in terms of the nation-states that they or their ancestors are/were associated with given the form of the ethnoracial categorization schema provided. Most students who used the write-in box, n = 974, did so to provide an ethnic/national category. There were 432 unique variations of ethnic/national categories—however, a nation could appear in multiple unique variations. For example, “Spanish,” “Spanish-Mexican,” and “Spanish, Basque” were each counted separately as unique ethnic/national categorizations. The most common national/ethnic categories were Mexican, Italian, and Iranian, each with about 40 students entering each response. A few students used the write-in box to rebuke the researchers on the categorization schema they were using. Some aimed to correct their false assumption that students from Taiwan would identify as “Chinese.” Students wrote, “Taiwan is NOT ‘Chinese’!” and “Taiwanese, Not Chinese.” These students expressed the sociopolitical tensions that exist over contested territories.
Finally, many students wrote in ethnic categories that did not relate to a national territory (nation-state), for example, “Gypsy”, “Hmong,” “Basque,” “Indigenous,” “Hawaiian,” “Assyrian,” and “Jewish.” That each of these responses represents a group that has experienced a history of violent oppression and dispossession from their lands is no coincidence.
Pan-Ethnic, Pan-Regional, or Pan-Continental Responses
Rather than listing a single nation/country, 295 students identified large regions or continents in their write-in responses. For example, “African,” “South American,” “West Indian,” and “Central American” were some of the pan-ethnic categories that students wrote into the open-ended box. Of this, “Middle Eastern” was the most common, with more than 90 students providing it as their write-in response.
Multiple Ethnoracial Responses
Allowing people to select more than one ethnoracial category in ethnoracial data collection has been common practice in the United States since 2000 for the census and 2010 for higher education data broadly. This survey was no different; students were able to select all that apply in the first ethnoracial categorization question. More than 500 students selected one or more ethnoracial categories from the schema of responses provided. The findings presented here analyze the students who took the time and energy to write in a multiple ethnoracial response. Often, n = 58 times, students provided two or more nationalities. For example, “Mongolian and Samoan,” “Armenian and Mexican,” and “Afghan/German.” Sometimes, the student chose a single-race category and then qualified it with multiple national/ethnic categorization. For example, a student selected “Black” as their ethnoracial category and then wrote in “Nigerian, Jamaican, Haitian.”
Another subset here included students who used the open-ended box to communicate their ethnoracial categorization with a term that indicates mixedness more broadly. Twenty-five students used terms that summarized a combination of races without listing any specific race. For example, students wrote “biracial,” “multiracial,” “multicultural,” “mixed-raced,” “mixed,” and “two or more races.”
Resistant
Thirty-four students used the write-in field to express resistance to ethnic and racial labels. There were a wide variety of responses that resisted, often in combative ways, the prompt to select an ethnoracial category. Some students were evasive without communicating why. For example, “Ask me if I like you and I’ll tell you.” Others communicated that they resisted ethnoracial categorization broadly, for example, “dont identify” and “I don’t describe myself by my color only my personality.” Along these same lines, 13 students wrote “Human” (or some variant, such as “human being” or “human race”) for their racial categorization, and another five wrote “American.”
Unknown
“Race Unknown” is an official reporting category used for U.S. federal higher education data processes. In the full sample of 24,000 responses, more than 700 students declined to select an ethnoracial category, including leaving the write-in box empty. However, some students, n = 27, used the write-in box to indicate that their racial categorization was unknown—that they were adopted or for some other reason did not know which ethnoracial category to select. For example, students used the box to write “Unknown”; “I’m adopted so I’m not sure what I am”; “unknown, but suspect native and irish [sic] heritage”; “who knows”; “possibly ‘other,’ my mother was adopted”; and “Half my ethnicity unknown.” These responses perhaps provide some insight into what may be behind the other 673 declined/unknown responses. However, without a qualitative follow-up, we do not know if these are representative or exceptions of the declined/unknown set.
Discussion
We find that most students assigned themselves to one of the categories listed on the survey; however, many students clarified, questioned, revised, or resisted the survey’s categories. Our analysis uncovered five different, broadly defined response types that students who wrote in responses used: ethnic/national origin, panethnic, multiple ethnoracial, resistant, and unknown. Each of the groupings we identify has an entire literature to make meaning of it. Although we are only able to scratch the surface in our discussion here, future research can and should analyze each category in more depth.
The most popular response type among the write-ins was to indicate a country of ancestry or national origin. Students may have written in an ethnic or national origin response whether or not they identified as an immigrant. Some students did clarify their responses here by including “American,” such as Mexican American or Arab American. Here, students also seemed to be wanting to indicate their cultural and ethnic backgrounds, more so than citizenship status. In doing this, students seemed to be homing in more on the “ethnicity” aspect of the question rather than the racial component. However, although “race” and “ethnic identity” may have different scholarly definitions, the lived experience of them may in fact be complicated and difficult to parse out (Hamer et al, 2020). Johnston-Guerrero (2016) noted that the relationship between racial and ethnic identity is a “messy” one and that there is no clear consensus on how to define racial and ethnic identity. Rather, he argued for an intersectional view of race and ethnicity.
It may be that students were reacting to this complicated and messy distinction by not making much of a distinction at all and equating the two terms. It may also be that students were prompted to answer in terms of their national or ethnic origin due to how the initial question was worded. As noted before, some ethnic categories, particularly Latinx and Asian, were further broken down by nationality on the survey (see Figure 1).
Most students who chose to write in national/ethnic origin responses were quite specific in their identities and wanted to be able to name and include these. In contrast, those who chose a panethnic or continental response may have been trying to identify more broadly with a group of people. These panethnic categorizations have been at times reductive, lumping together diverse groups, and at other times labels of solidarity in the face of marginalization and discrimination (Lopez & Espiritu, 1990; Okamoto & Mora, 2014). It is of note that the most common panethnic identity was Middle Eastern. Although many Middle Eastern and Northern African people may be labeled as White racially, most do not self-identify as White (Maghbouleh, 2017), nor are they appraised by others as White in everyday interactions. In fact, in 2024, the Office of Management and Budget revised Statistical Policy Directive 15 (the federal guidelines for how race is collected) to include a separate Middle Eastern category (Office of Management and Budget, 2024).
Those who identified with a mixed racial or ethnic term without always specifying what groups they were referencing may also have been trying to identify more broadly with a group rather than specify their unique heritage. Brunsma and Rockquemore (2002) described this as a “border identity” that attempts to recognize multiple racial origins in a single person. Understandings of multiracial people have run the gamut from being stigmatized as deviant to being idealized as transcending race and ushering in a post-racial future. Rather than either of these extremes, current scholarship on multiraciality responds to the idealized era that preceded it by grounding understandings of mixed-race individuals in the colonial histories that shape notions of racial purity and racial mixing to begin with (Mahtani, 2014).
Although smaller in number, the final two response types we identified, resistance and unknown, are important to understand when examining the intersection between racial identity and racial category because these students explicitly contest or feel they are outside of any racial or ethnic category. A number of these students seem to be specifically rejecting being categorized as White. This finding is consistent with previous scholarship on White student racial identity, which has found a variety of ways that White students resent or reject racial classification (Foste & Jones, 2020) and tend to embrace a “color-blind” philosophy that categorizes both themselves and people of color as raceless (Jayakumar, 2015). On the other hand, in refusing to identify at all, these students may be indicating a “transcendent identity” and asserting that racial categories are socially constructed and do not define them (Brunsma & Rockquemore, 2002). Some resisted the idea of racial category by invoking sociological understandings of categorization. It is important for both scholars and practitioners to be aware that both of these views (color-blind ideology and sociological framings) may exist in this category.
Considering that racial and ethnic identity may be very central for some people, not being able to fit into a category or align with any particular group may be isolating for those who indicated “unknown” in their response.
Implications
Ultimately, survey researchers rely on ethnoracial categorization to make inferences about group-level differences in the social world. How best to do this remains a moving target, but we offer the following suggestions based on this research.
Most surveys do not include a write-in option because quantitative researchers have concluded that this box yields messy or unusable data. We challenge this notion. We see the write-in box as an asset and a necessary reflection of the social world—reminding survey researchers that the race categories they are using are not simple, settled identifiers that fit all people perfectly. In line with a QuantCrit perspective, noting the varied ways in which people may respond to describing their ethnoracial identity can remind researchers that such categories are neither natural nor given but must be critically evaluated.
For researchers who take up this charge, we have some suggestions on how to collect ethnoracial data and how to handle these undoubtedly unwieldy data. We encourage survey researchers to familiarize themselves with the latest revision of Statistical Policy Directive 15 (Office of Management and Budget, 2024) of the Office of Management and Budget. This policy is the result of a years-long process where individuals, lobbyists, community organizations, university groups, corporations, and the government weigh in and agree on a set of standard minimum ethnoracial categories and additional disaggregated categories. We suggest using these categories along with including a write-in box.
A write-in box can reduce missing ethnoracial data (Holland & Ford, 2021) because one reason why respondents decline to provide a response is that they do not believe that the categories provided capture how they identify. Rather than having completely missing data, the write-in box gives the participant an outlet to respond to the categories, and (as we show here) researchers could collect valuable information about how the participant identifies ethnoracially and/or information on why they are declining to respond.
Survey researchers, naturally, would then ask, “How should we recode the data from the write-in box?” Our response is “with caution.” For example, some respondents will select a race category and also use the write-in box. During data coding, researchers could flag the observations that have an accompanying written-in box. During analysis, researchers could investigate if there are differences between the written-in group and others. The write-in box could provide researchers with subgroup differences (e.g., Caribbean/African/U.S.-born in Black) that would not be collected using standard categories.
In some cases, categorical ethnoracial data will be missing, but the write-in box will be used. Some quantitative researchers impute missing race data based on responses from other parts of the questionnaire. We would suggest that ethnoracial data in the write-in box could be invaluable to providing information for filling in missing responses and perhaps reducing the number of observations that are “unknown” or have imputed ethnoracial data.
Like the 2024 recommendations from the Office of Management and Budget, we recommend that researchers offer a write-in ethnoracial box on surveys as an optional and additive item. We do not envision this as a stand-alone or required question in a digital survey.
Most of all, we ask that survey researchers be reflective and critical when using social categories in general and ethnoracial categories in particular. How ethnoracial categories are understood to matter in relation to the research question is as important as the categories that are operationalized. After all, race is “a bundle of sticks”—a combination of identity, phenotype, category, heritage, raciolinguistic markers, geography, and more (Sen and Wasow, 2016). Finally, we encourage innovative ways of thinking about the data gathered by a write-in ethnoracial box that could be seen as qualitative data that a complementary team could examine. There are some projects where the size of the sample would be a barrier to using the write-in data for missing race data. The size and scope of a study will certainly dictate research design decisions.
We understand that the common view is that the write-in box will collect a wide variety of responses and that many will not fit neatly. The write-in ethnoracial box provides a persistent reminder that the five ethnoracial categories are not representative of the lived realities of the social world. The write-in box is not a blanket solution or a new gold standard but a simple suggestion to collect data in a way that allows for the real-life messiness of race and ethnicity to be acknowledged in survey research.
Conclusion
The schema of race and ethnicity categorization that many U.S. quantitative researchers take for granted as exhaustive is contested by the findings of this article. Students understand race categories quite differently from the categories presented to them. Perhaps after repetition and over time, students will come to take for granted these categories and their own place in them. But that must be understood as something that researchers are doing. Racial categories are the result of social, historical, and political contexts and are not immutable or natural, nor do they encompass the full range of ways people racially identify.
In line with QuantCrit scholars, who encourage a denaturalization of categories and an examination of the boundaries/definitions of racial categories, we argue that it is important to question racial categorization schemas on surveys with an eye toward the oppression and power dynamics of who constructed the race categories, for what purpose, and what benefits they gain from its construction. Race categories both reflect and create sociopolitical realities—they must be viewed as contextual and temporal. The use of race categories over time makes them real, makes people see the world as divided in that way when it could in fact be divided in another way or not at all. In scholarly research, racial categories are typically taken for granted, imagined as natural and that people have a shared understanding of their boundaries. The unique data collection instrument in this study allows for us to see that the students in the study contested the given race categories in various ways.
Methodologically, we contribute to these discussions through the examination of the write-in field. By applying a QuantCrit lens, we are denaturalizing the taken-for-granted categories and boundaries between groups. When surveys include a write-in option, the responses are usually dropped or not included in studies. These students whose answers we have engaged and taken seriously would usually not factor into studies of college students because their responses were too complicated to process, and yet their answers trace the complex relationships they have with ethnoracial categories and thus are a rich site to study how they express various strategies for understanding the functioning of race and ethnicity. Without the open-ended box, it would not have been possible to see that so many students identified with pan-ethnic identities, that border identities were being taken up, or that some students found “White” to be offensive. Our analysis provides a descriptive categorization of the various ways in which students are thinking about race outside of the typical seven categories commonly used in U.S. surveys. Such knowledge adds breadth to theoretical discussions about the complexity of racial identity and racial categorization by examining a large sample and identifying some of the most common ways that students are thinking about race and ethnicity that differ from the options presented on most surveys. This breadth would not be possible with a smaller, interview-based study, where it is statistically highly unlikely to unearth all of these response types and subtypes as we were able to do with more than 1,300 responses. However, future research would benefit greatly from in-depth qualitative work that would allow students to further expand on and explain their views.
Our analyses show that students are thinking about racial identity in a myriad of ways that are varied, complex, multiple, and resistant to traditional survey categories. This is critical for researchers to recognize because how students are grouped and classified can create divisions or create categories that may not have previously been recognized (Brubaker, 2009).
We understand that gathering enrollment data to report to federal agencies (in the United States, Integrated Postsecondary Data System) requires a standard set of data collection and reporting categories. However, we argue that researchers are lulled into using these categories and take for granted that they are exhaustive and complete. The findings of this study, that students contested the given race categories by using the open-ended box, reminds researchers that students do not in fact fit neatly into these categories. Our hope is that researchers will reflect on how they use race categories and limits of using them, especially as they are reminded that students’ lived race/ethnicity is complicated and fluid and often does not neatly fit into one of seven preset categories.