
Abstract
We tested 10 data-based strategies to better identify student homelessness in Camden City School District, which has a student body from minoritized backgrounds. We operationalized strategies through a research-practice partnership, following the federal homelessness definition. Data span 5 years (2014–15 through 2018–19), including integrated education, municipal, and health records. Nine strategies indicated significant unidentified student homelessness (min: 15; max: 5,008; p-values < .001). Consistent with homelessness, six strategies produced groups with lower attendance (p-values < .01) and seven with increased school mobility (p-values < .05). Homelessness was 34% greater in the most conservative interpretation, though counts could be as much as 454% greater. Student homelessness is more prevalent than recognized, data-based strategies can guide proactive outreach, and cross-system partnerships are warranted.
This study tests different ways a district can use data to discern how many of its students experience homelessness but go unrecognized. Through a research-practice partnership, we operationalized situations indicative of student homelessness using routine education data as well as data integrated with other sources, resulting in 10 data-based strategies. We then tested relations between each strategy and two education indicators to evaluate whether each strategy identifies students at risk in a way that suggests they may be experiencing homelessness. Finally, we quantify the degree of likely underidentification of student homelessness.
Student homelessness threatens good educational functioning (e.g., attendance, school mobility), educational outcomes, and student well-being (Cowen, 2017; Hatchimonji et al., 2021; Herbers & Cutuli, in press; Masten et al., 2015). Child and teen homelessness is also associated with higher risk for behavioral and emotional health problems, lower school readiness, having experienced other potentially traumatic events, and belonging to groups who experience longstanding and ongoing systemic discrimination on the basis of very low income, race, ethnicity, gender identity, and/or sexual orientation (Bassuk et al., 2015; Evangelist & Shaefer, 2020; Gubits et al., 2013; Hatchimonji et al., 2021; Herbers et al., 2017).
U.S. federal legislation mandates that school districts proactively identify student homelessness when it occurs and extend certain rights and services. The goal is to ensure that homelessness does not interfere with students’ ability to access a free and appropriate education (§11431 et seq.). However, many local, state, and federal education authorities confront a fundamental challenge when it comes to overseeing efforts to identify and support students experiencing homelessness: How can they know how many students failed to be identified by the school district?
Education records underrepresent subsets of students with particular needs besides homelessness, both in number as well as how much those needs interfere with education. For example, Michelmore and Dynarski (2017) report that the number of students with low income in education records (per qualifying for free and reduced-priced meals) in a given school year is usually lower than the number who ever qualify over multiple years. This is a fairly intuitive point as families’ situations change from year to year or school processes might change with implications for students being listed as eligible. Less intuitively, though, is that there is not a dosage effect of low-income status when using education records to understand achievement: the number of years a student is identified as low income from grades K through 8 is negatively correlated with achievement similarly in third grade and in eighth grade. Instead, the low-income indicator in education records is an important, though less intuitive, indicator of poverty gradations when summed longitudinally.
The current analysis develops and tests analogous alternative indicators of different homelessness situations, first within education records and then within integrated interagency data. Our ultimate goal is to overcome the limitation of relying on only cases of homelessness formally identified by districts. This limitation, coupled with chronic underfunding of federal, state, and local education programs charged with identifying and supporting students experiencing homelessness (Government Accountability Office, 2014), has led to little evidence-based innovation in practice, including in the use of data to support proactive identification of student homelessness. It also has constrained research findings since large-scale studies usually categorize students based on districts’ formal identification of homelessness, which is strongly believed to be a gross undercount. As a result, many school districts deprioritize efforts to respond to student homelessness (Herbers & Cutuli, 2014; Pavlakis, 2018).
Operationalization of Student Homelessness Within Education
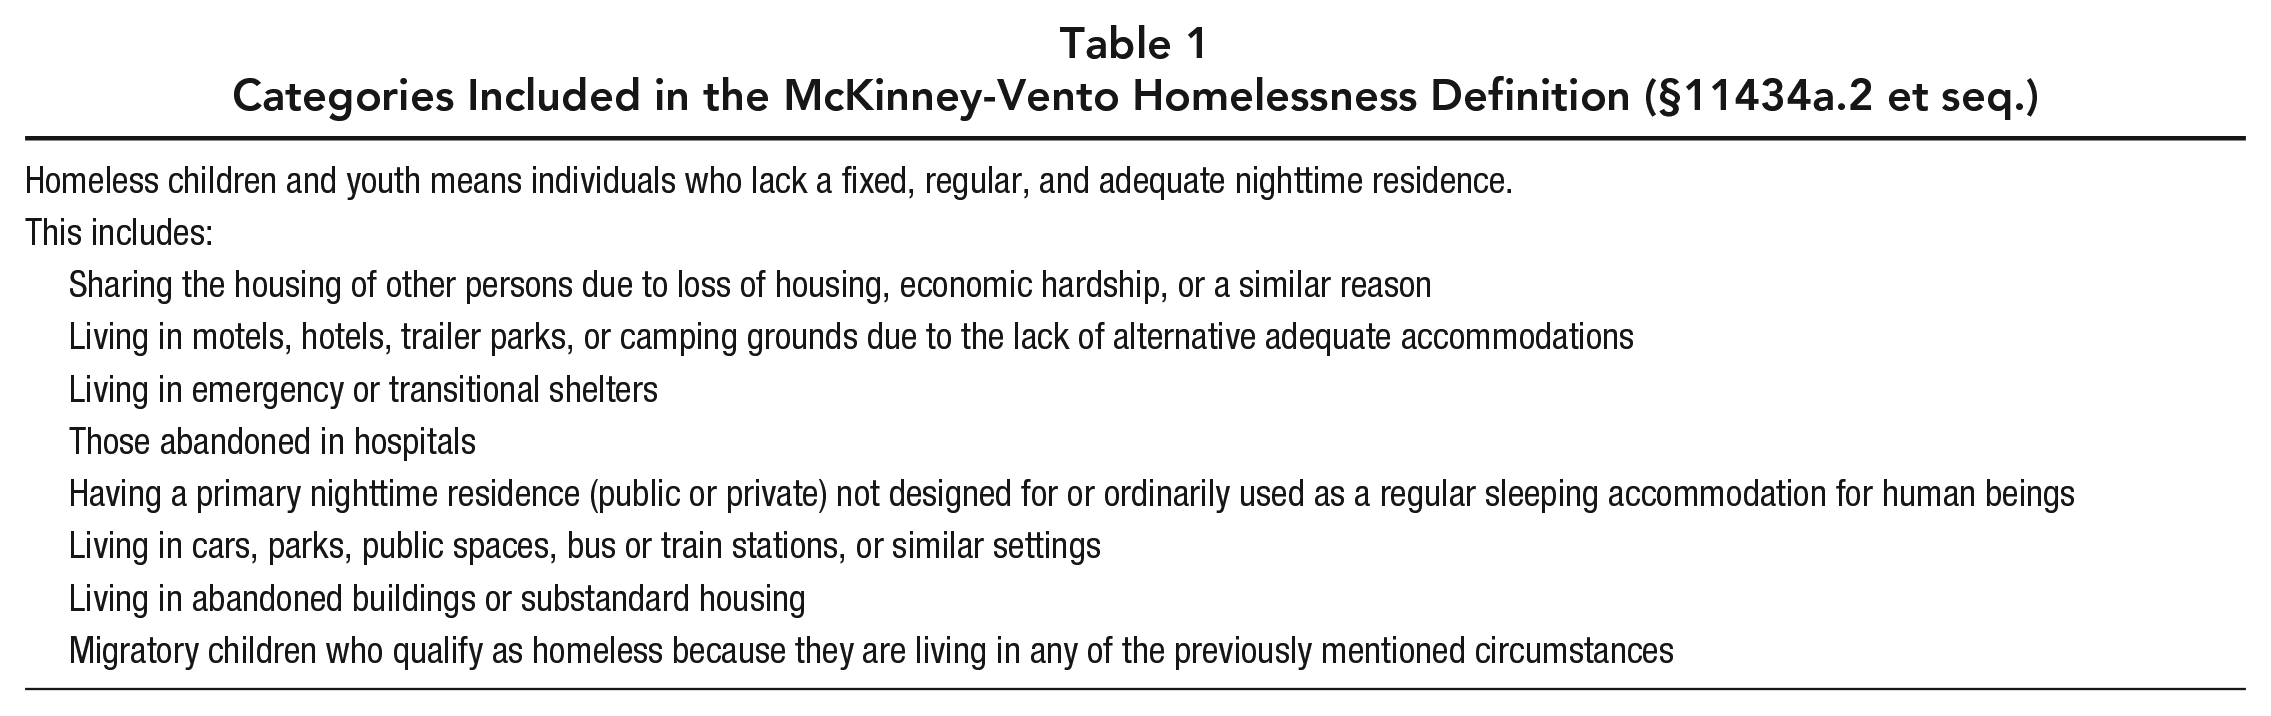
Federal legislation defines student homelessness as the lack of a fixed, regular, and adequate nighttime residence, which can manifest as any of a number of different situations (Table 1; §11434a.2 et seq.). Local education agencies identify about 1 to 1.5 million students annually—about 2.5% of all public school students—with the largest proportion (>70%) doubled-up with friends or family because of a lack of affordable housing (National Center for Homeless Education, 2022). While education systems already identify many students, educators and other experts widely recognize that official counts are gross underestimates of the true prevalence of student homelessness (Government Accountability Office, 2014; Hatchimonji et al., 2021).
Categories Included in the McKinney-Vento Homelessness Definition (§11434a.2 et seq.)
Challenges to identifying student homelessness include students and families who are disconnected from formal service systems, afraid of social stigma or becoming known to public systems (e.g., child welfare; immigration and naturalization), unaware that their situation meets formal definitions of homelessness, skeptical of or unfamiliar with supports available from the schools, or connected to education systems that do not prioritize responding to student homelessness (Herbers & Cutuli, in press; Pavlakis, 2018).
Common approaches to identifying student homelessness involve asking about housing status on routine forms (e.g., annual school registration). Districts also designate one or more staff members to serve as homeless education liaisons responsible for the local response to student homelessness. Liaisons reply to teacher referrals when teachers suspect student homelessness is occurring or partner with outside agencies that may be aware of homeless situations (e.g., shelters), among other activities. There has been little innovation in identifying student homelessness subjected to rigorous tests of impact (though, see Shephard et al., 2021).
Camden City School District (CCSD) in Camden, New Jersey, provides the education data and context for this investigation. Relevant to the interpretation of the current findings and considerations of generalizability, CCSD is an urban district serving a community with very high rates of poverty and deep poverty. To the immediate east of Philadelphia, CCSD served about 7,500 students each study year in district-operated schools. The student body is largely comprised of students from families with low income and from racial or ethnic minority groups (~99% of all students). During 2018–19, CCSD identified about 4.5% of students in district-operated schools as experiencing homelessness, which is higher than both national and New Jersey state rates (Cutuli et al., 2020; Green et al., 2023).
This study has three aims that interrogate routinely collected education, municipal, and health data integrated at the individual level to test the utility of different strategies for indicating student homelessness. First, we consider each of 10 data strategies to identify students who appear to be experiencing homelessness. We compare proportions of students who were identified and not identified by district personnel to gauge whether each strategy holds promise to contribute to a significant increase in district identification rates. Second, we test for differences between students identified by each method and all other students on two indicators of school functioning closely tied to student homelessness: attendance rate and school mobility. Because we cannot confirm the specifics of each student’s situation, this second aim allows us to gauge whether each strategy appears to index students at high levels of risk for reduced educational access, similar to students who experience homelessness. Finally, we quantify the degree of likely student homelessness that occurred in the district over 5 years.
Method
This study is the product of a research-practice partnership and followed the principles of Community-Based Participatory Research (CBPR) (Israel et al., 2013). The genesis was based on shared goals of understanding how to improve identification of student homelessness so that students could be better served. The partners mutually valued the varied expertise of school district staff, researchers, and data scientists. Partners were equals, and the partnership co-created all aspects of the study, from conceptualizing the research questions, operationalizing constructs, analyzing data, interpreting findings and their implications, and dissemination.
Data came from the ARISE integrated data system (IDS), containing population-wide records linked at the individual level. Education records were from all students who attended a district-operated school for at least 10 days within a school year (SY) from 2014–15 through 2018–19. Data sources are detailed in the online supplemental materials.
Data Linkage
We integrated data across sources at the individual student level using standardized addresses and first and last names of students and first and second guardians. See online supplemental materials. We matched 80% of guardians to the ARISE IDS (67% exact-match rate; an additional 13% non-exact match rate). Data sources that focus on properties were linked to individuals based on enrollment address.
Variables
We briefly describe constructed variables here and elaborate in the online supplemental materials.
Family Clusters
We defined family clusters based on CCSD enrollment records for each school year. Family clusters are one or more students at the same address who shared a guardian at that address in a given school year. Clusters could change across different school years, and more than one cluster could occupy the same address each year.
Homelessness Indicators and Data Strategies
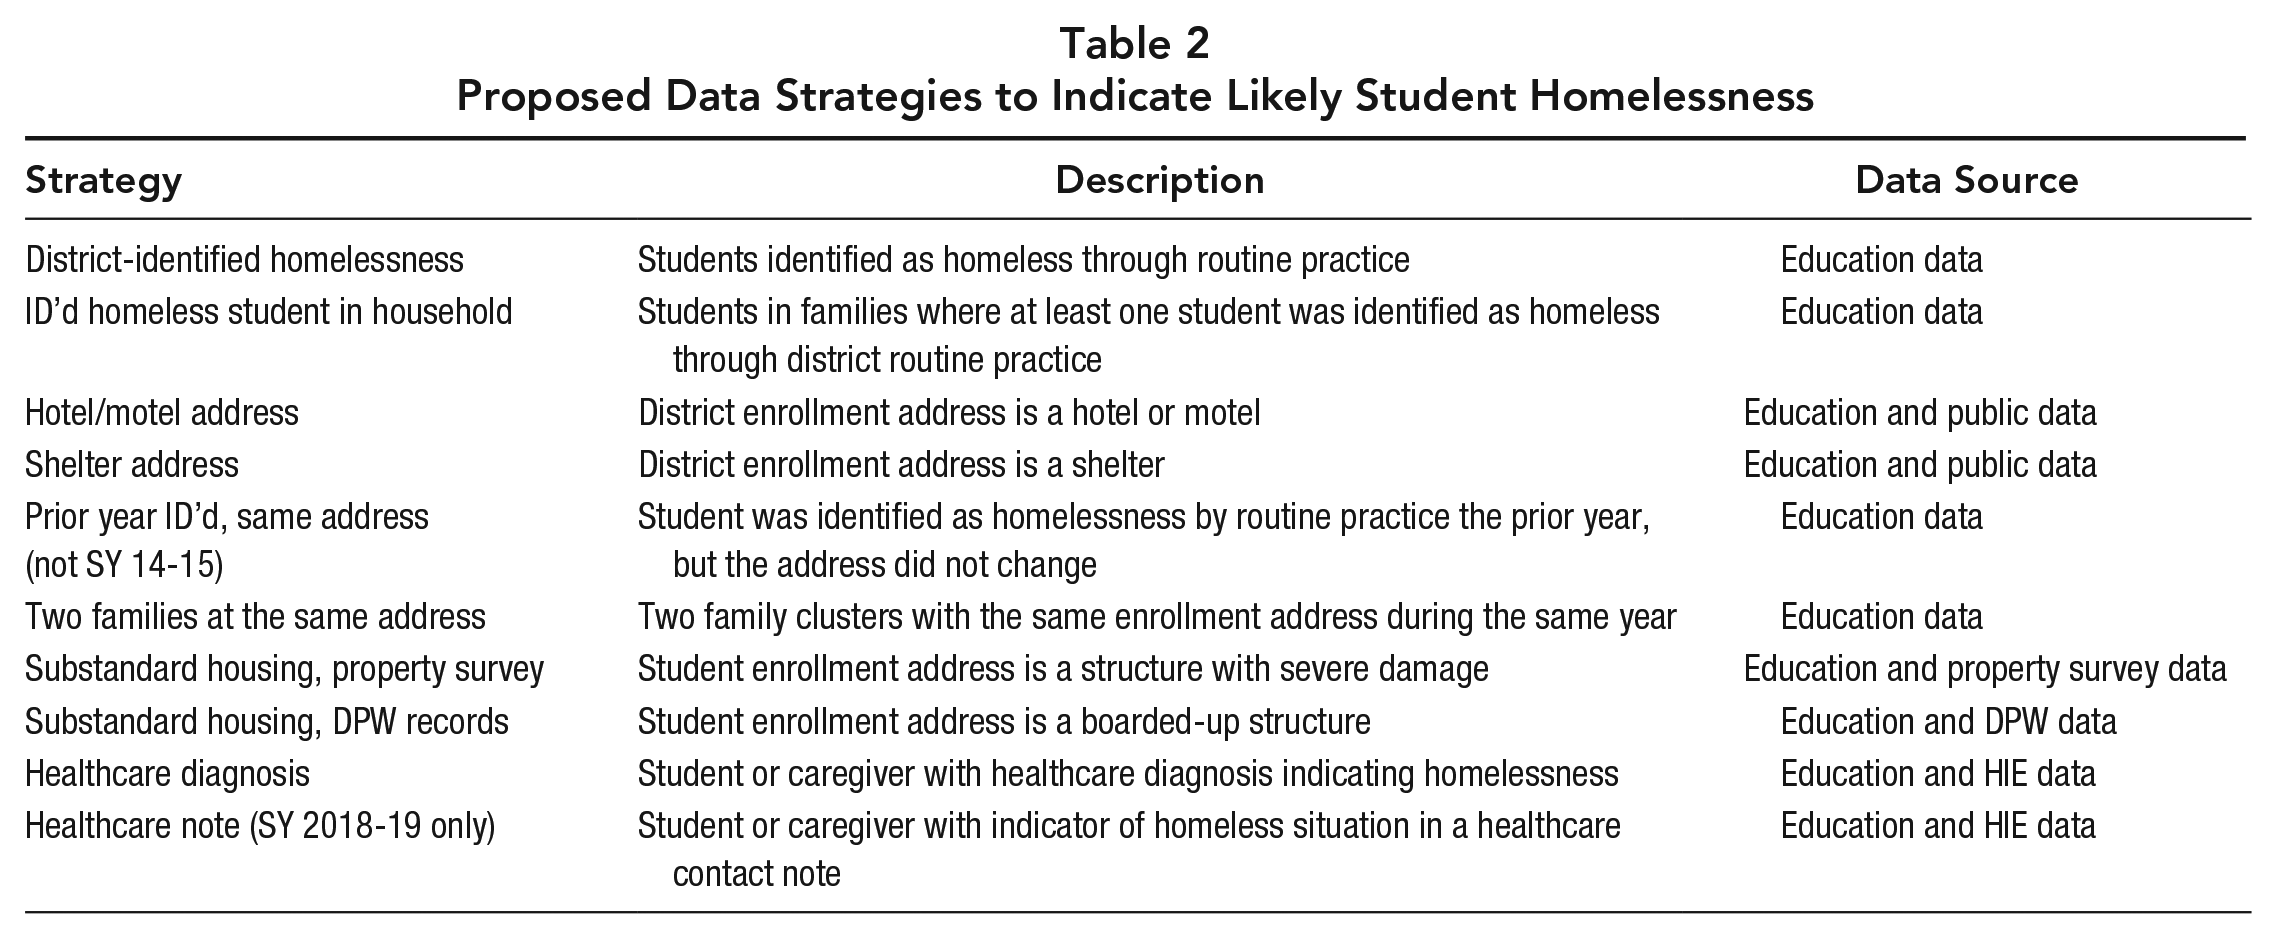
This section describes homelessness indicators and how we operationalized likely homelessness using data-based strategies using education records or integrated data (Table 2). Through the CBPR process, the partnership innovated the operationalization of each strategy through thoughtful deliberation that drew on mutually valued expertise of each member. We constructed these variables for each school year, except as noted. When a strategy indicated homelessness for a specific student, the likely homelessness status was applied to that student for the relevant school year. When indicated for a guardian suggesting family homelessness, we applied the likely homelessness status to all members of the family cluster for the relevant school year.
Proposed Data Strategies to Indicate Likely Student Homelessness
District-Identified Student Homelessness
As a routine practice, CCSD identified potential student homelessness in response to questions on enrollment or transportation forms, referrals from teachers, other school personnel, external organizations, or upon annual review of education records. Homelessness was confirmed through interviewing guardians or unaccompanied students.
Identified Homeless Student in Household
This indicator reflected students in family clusters where one or more children were identified by the district as experiencing homelessness.
Homeless Prior Year, Same Address
This strategy indicated cases where a student was identified as experiencing homelessness by the district in the preceding year and continued to stay at the same address in the subsequent school year based on education records. We could not construct this variable for SY 2014–15.
Two families at the Same Address (Doubled-up Homelessness)
This strategy indicated when two or more family clusters were at the same address during the same school year. Addresses included unit numbers and this strategy was sensitive to multi-unit housing.
Shelter Address
Student’s address from education records matched the address from any family shelter in Camden City or any adjacent municipalities, including Philadelphia.
Hotel/Motel Address
Student’s address from education records matched the address of any hotel or motel in any of the adjacent municipalities. (Camden City had no hotels or motels during the study years).
Mobile Home Park Address
Student’s address matched a campground or mobile home park in Camden City or any adjacent municipality.
Substandard Housing—Property Survey
Student’s address from education records matched one on the Real Estate Vacancy Survey deemed to be residentially unsuitable (e.g., has serious visible damage like fire damage, holes in the roof, or is boarded and sealed).
Substandard Housing—DPW Records
Student’s address from education records matched a property ordered to be boarded up by the Department of Public Works (DPW) during the same school year.
Healthcare Diagnosis
This variable is based on diagnoses in the Health Information Exchange (HIE) for hospital-based services reflecting homelessness (Z59.0, Z59.1, Z59.8, Z59.9).
Healthcare Contact Note
We performed a text search of contact notes for students and their guardians using key terms indicating likely homelessness (see online supplemental materials).
Educational Functioning
We considered two indicators of educational functioning for all students: attendance rate and school mobility.
Attendance Rate
Attendance was a ratio of days attended divided by days enrolled in the district. At district urging, we required that students attend a district-operated school for at least 10 days in a given school year to obtain an attendance ratio. We used attendance from the first year that each student was a member of the homelessness group/strategy being considered. Attendance for students without any indication of homelessness were based on data from a random selection of available years.
School Mobility
Enrollment records contain information on student transfers into the district or between schools within the district. These data are available for all within-year moves with the requirement that the student must attend at least three instructional days at a different school.
Analyses
First, we provide counts of the number of students identified or potentially experiencing homelessness based on each data strategy across the five school years (2014–15 through 2018–19, except for strategies with available data for fewer years). We provide additional tables in the online supplemental materials (Table S3) reflecting the overlap between indicators, including the total, unduplicated number that were unidentified by the district. This informs the scope of each homeless situation as represented by the strategy.
We then test whether identifying the students indicated by each data strategy would have significantly increased the total number of students identified as experiencing homelessness in CCSD across the five years using a chi-square goodness-of-fit test. This analysis informs whether the strategy would increase counts beyond CCSD’s routine procedures for identifying student homelessness.
We test for differences in attendance using t-tests and school mobility using a chi-square test and corresponding odds ratio. Results evaluate whether each strategy identified students at risk relative to others.
Finally, we provide counts of students identified by each promising strategy for each school year to describe the total number of instances of student homelessness that went unidentified by the district.
Results
Table 3 reports the count of students identified by each strategy and the degree of overlap between pairs of strategies. All but one strategy identified a considerable number of students likely to have experienced homelessness (min: 15; max: 5,008; see Table 3). The exception was students whose address was a hotel or motel (n = 15 across the five years), all of whom were otherwise identified by the district as experiencing homelessness. Chi-square goodness-of-fit tests confirmed that each strategy significantly exceeded the number identified relative to an expected increase of 0 (p-values <.001). In the online supplemental materials, we provide additional descriptions of the degree of overlap between students identified by each strategy (Tables S2–S3).
Overlap Between District-Identified Student Homelessness and Each Strategy Across Five Years
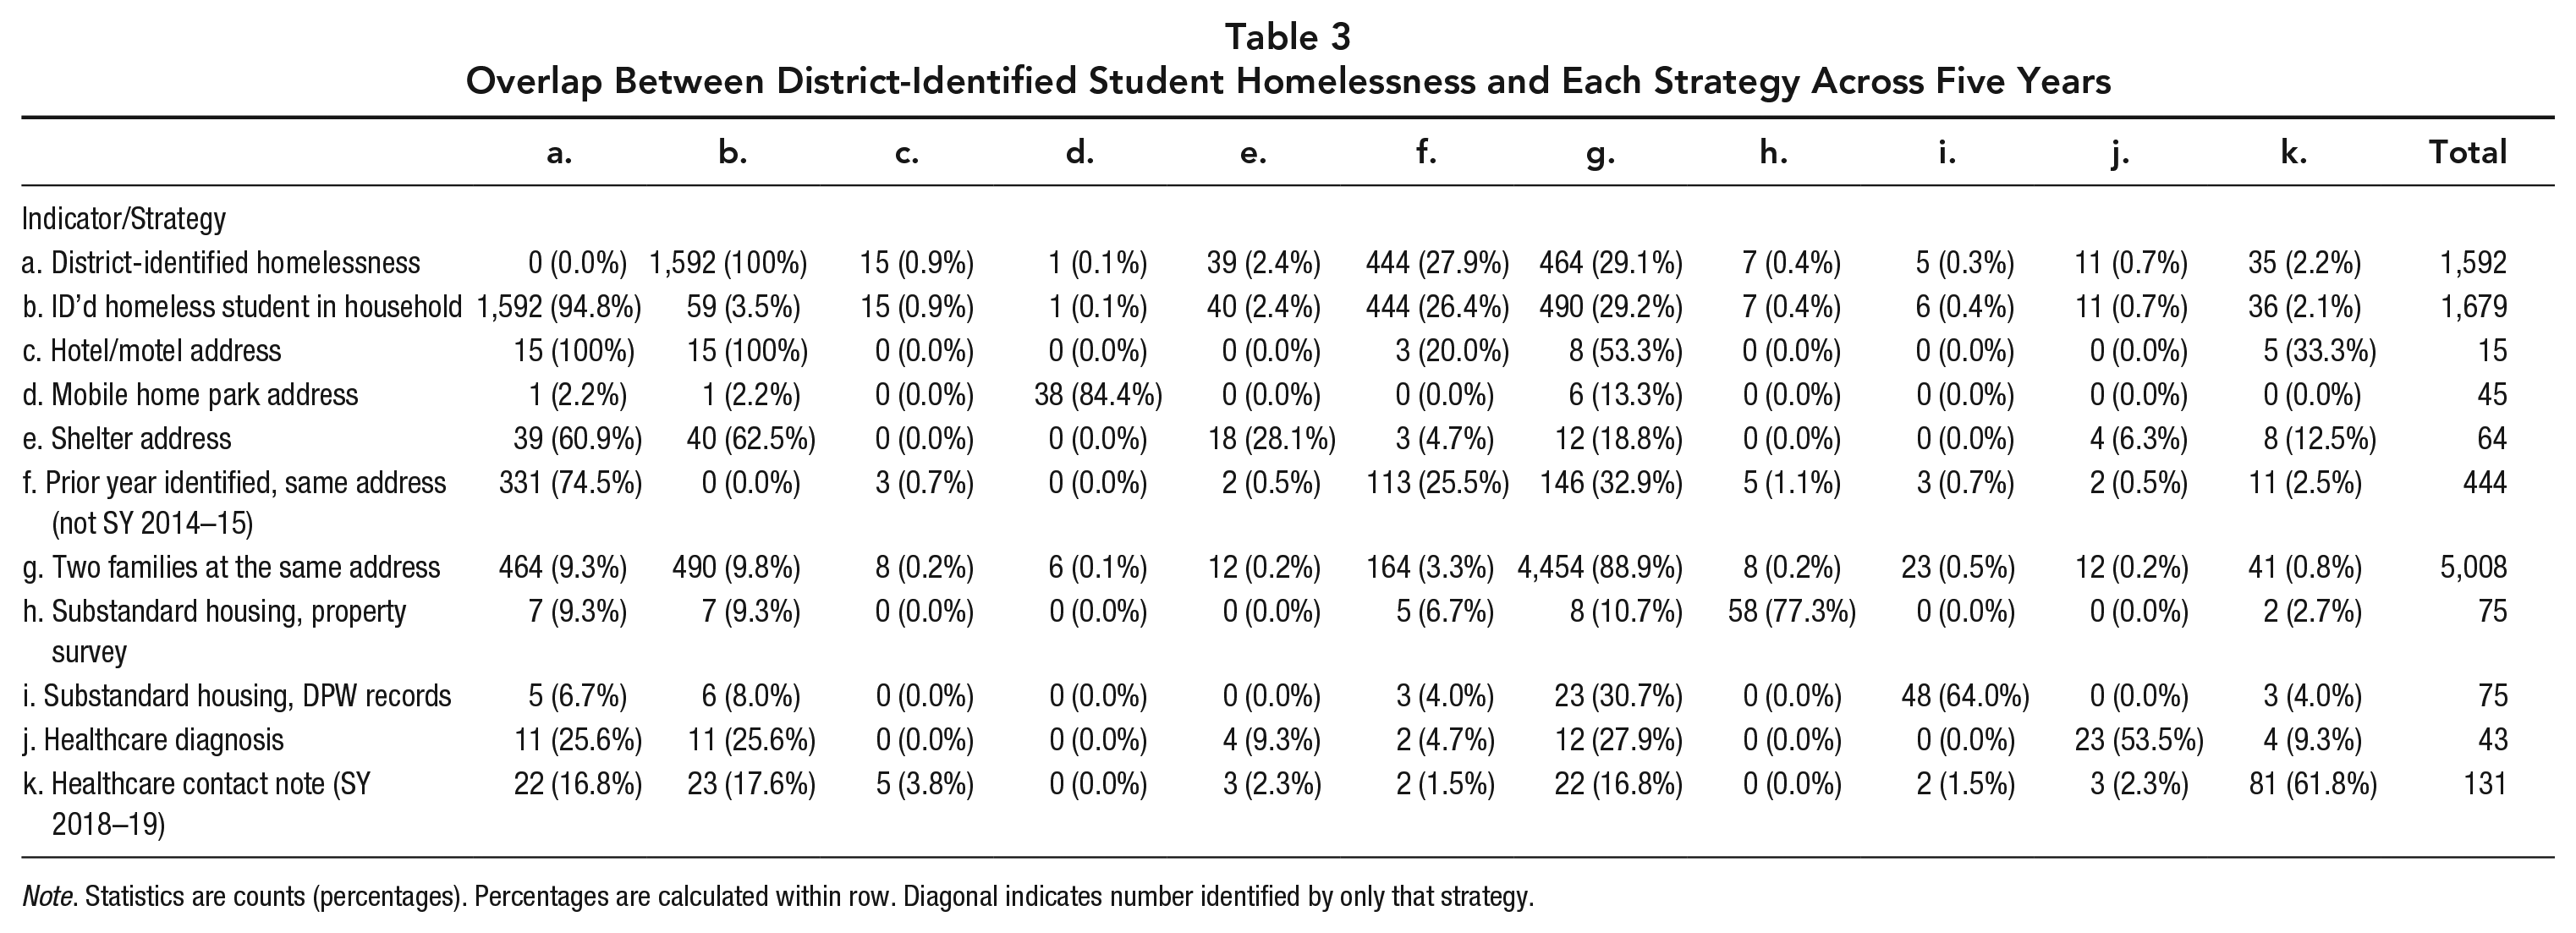
Note. Statistics are counts (percentages). Percentages are calculated within row. Diagonal indicates number identified by only that strategy.
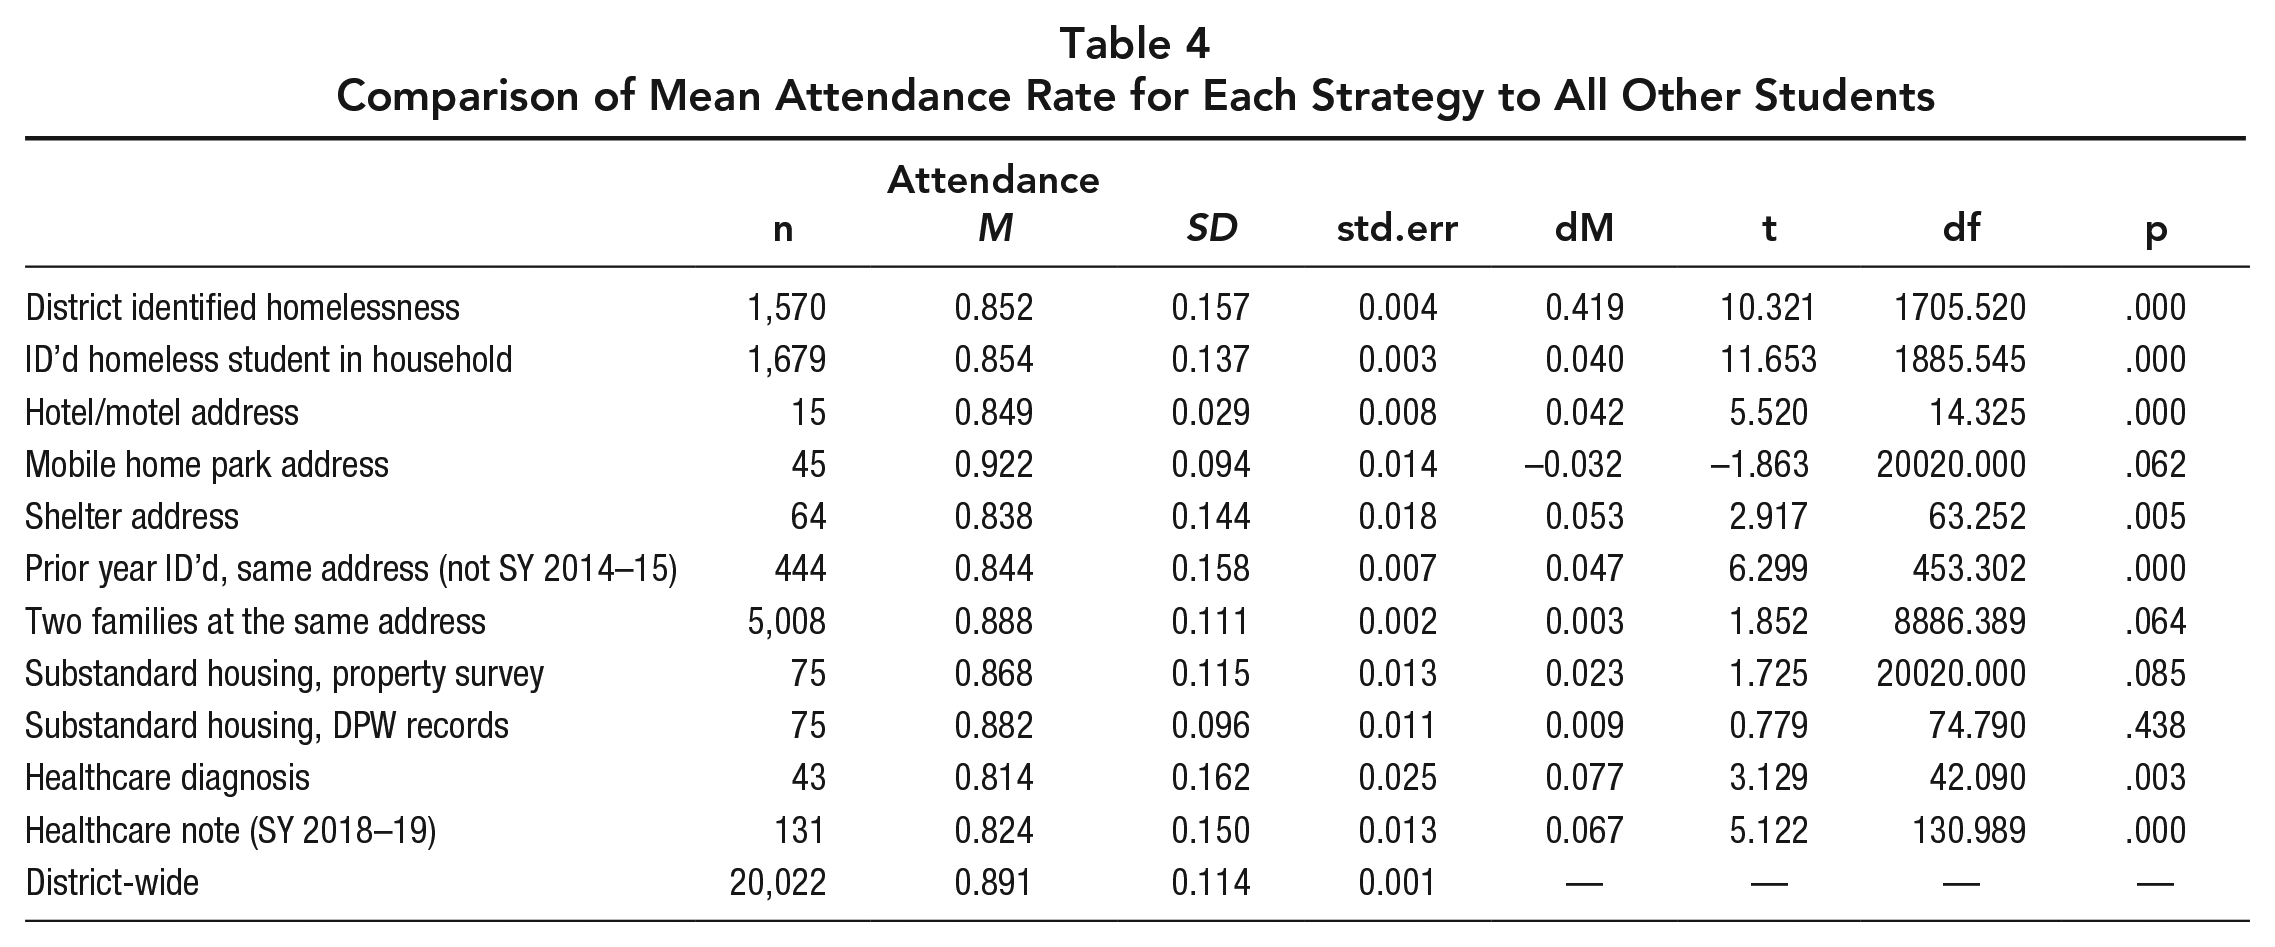
Independent-sample t-tests confirmed that groups of students identified by the school district as homeless and, through six strategies, showed lower average attendance compared to other students (p-values < .01; see Table 4). Two strategies produced nonsignificant effects for lower attendance—namely, substandard housing based on the property survey (p = .085) and two families living at the same address (p = .064). Children living in a mobile home park had a nonsignificant effect for higher attendance (p = .062).
Comparison of Mean Attendance Rate for Each Strategy to All Other Students
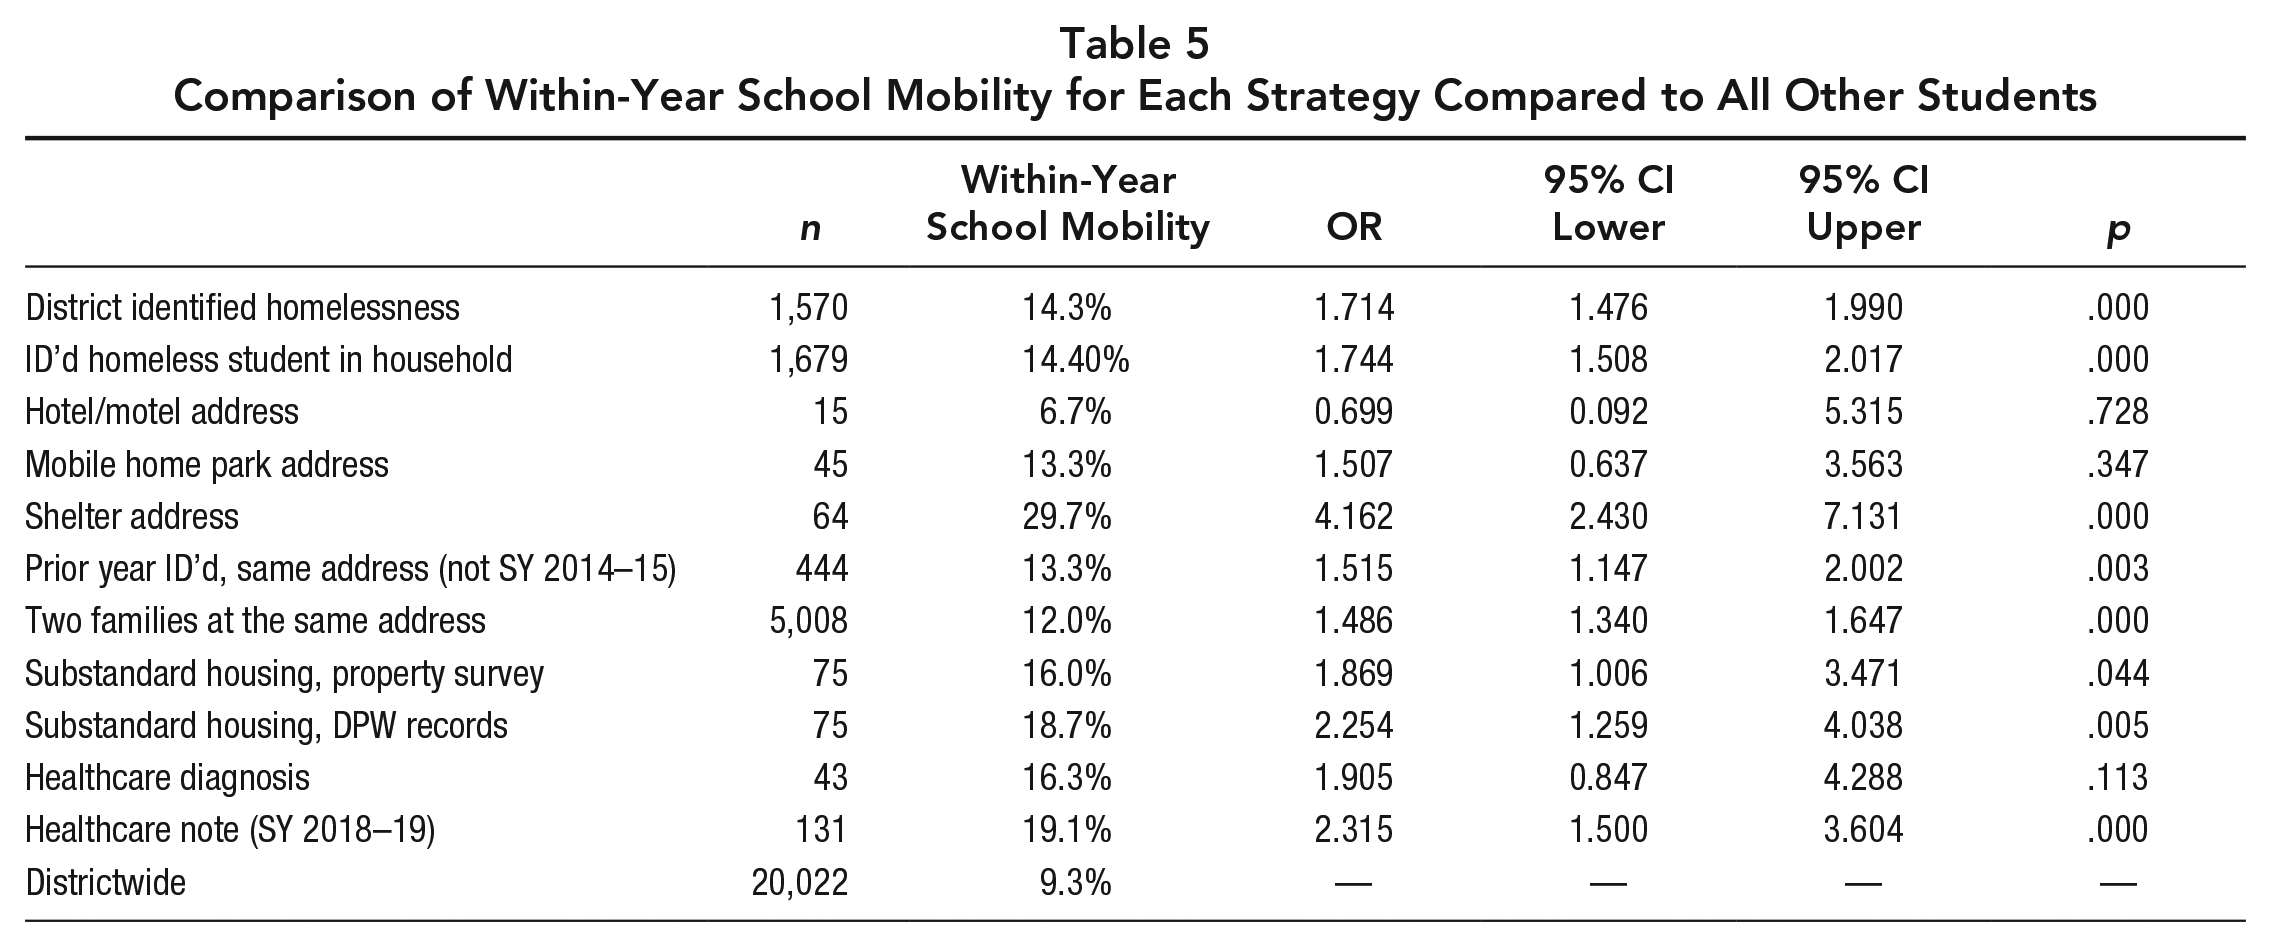
Seven of the 10 strategies represented risk for higher within-year school mobility based on chi-square tests (p-values < .05; Table 5). Exceptions were students staying at a hotel or motel or a mobile home park and students identified by a health diagnostic code reflecting homelessness.
Comparison of Within-Year School Mobility for Each Strategy Compared to All Other Students
The data-based strategies indicated a range of 632 to 8,491 instances of possible student homelessness across the five years that were not identified by the district, allowing for individual students to be considered homeless multiple times if indicated in multiple school years. These counts correspond to a potential 33.83% to 454.55% increase in cases of identified student homelessness. Together, the 10 strategies produced a total count of 8,529 instances of possible homelessness that were unidentified by the district. This number reduces to 8,491 when excluding 38 students staying in the mobile home park, given that they were not at risk for either poor attendance or school mobility that would suggest homelessness and were not identified by any other strategy. We consider this latter count the plausible upper bound for the range of possible counts.
A more conservative approach would only include those strategies that produced groups with significantly different or nonsignificant trends on both attendance and school mobility—further excluding three additional strategies (excluding motel/hotel, substandard housing [DPW]; healthcare diagnosis)—resulting in a count of 8,383. An even more conservative count of 4,569 further discounts by half the number of students sharing an address—and not identified by any other strategy—to acknowledge that one family is likely hosting another and, therefore, is not considered homelessness. Finally, the most conservative count of 632 considers only those four strategies that corresponded with significant differences in both attendance and school mobility, indicating risk (student in a family identified as homeless; shelter address; previous year homeless; healthcare note text).
Discussion
We considered 10 different data-based strategies to identify students experiencing homelessness. We judged nine of these to yield groups of students who could plausibly be experiencing homelessness, though future research and practice should combine these strategies with individual interviews to confirm students’ homelessness status. Together, the strategies suggested that instances of student homelessness were about 34% to 454% greater than formally recognized by the district across five years, depending on more- or less-conservative interpretations of the findings. An at-minimum 34% increase in identified student homelessness represents a considerable number of students in this district. The findings must be interpreted within the context of this particular school district—one that (a) serves a student body from marginalized backgrounds based on race, ethnicity, and low income; (b) is urban; and (c) already usually identifies more student homelessness than most others in its state (Cutuli et al., 2020; Green et al., 2023).
Through a research-practice partnership, we operationalized categories of student homelessness consistent with the federal definition for education and then subjected each to data-based tests to gauge their plausibility. All but one of these strategies indicated significant numbers of students beyond those identified as homeless by the district through its routine processes. Furthermore, groups of students indicated by most of these strategies showed patterns of risk in low attendance or within-year school mobility that is generally consistent with student homelessness. Eight of these strategies appear to especially warrant additional study, including as a component of educational and intersystem collaborative practice and policy interventions aimed at better proactive identification of students experiencing homelessness to ensure access to a free and appropriate education. The findings also challenge the view that school districts are wholly reliant on parent or student report of their housing situation and on reports from other systems (e.g., shelter) when it comes to identifying student homelessness. Much can be learned from routine district data already at their disposal.
Federal legislation requires that school districts proactively identify students experiencing homelessness to extend rights and services to help ensure their access to a free and appropriate education. The current findings help quantify the degree of underidentification and underserving of these students in one district, a glimpse into a much larger problem recognized by others across the nation (Government Accountability Office, 2014; Hatchimonji et al., 2021; National Center for Homeless Education, 2022). Part of this problem is that education records are known to underestimate the number of students with particular needs—not just homelessness—during any given year, and analyses that consider these data at face value without careful consideration run the risk of not only misunderstanding the scope of those needs but also their impact on educational outcomes (Darolia & Sullivan, 2023; Michelmore & Dynarski, 2017). This is a perilous situation for researchers and state and district leadership charged with addressing these student needs. Specifically regarding homelessness, a lack of funding and lack of attention has contributed to a lack of innovation in identifying student homelessness; undercounts of their number; and persistent gaps in attendance, achievement, and attainment among the low-income categories of students in which they are overrepresented (Cowen, 2017; Masten et al., 2015).
Strategies That Rely Only on Education and Public Data
The current findings suggest actions for districts and states hoping to improve their ability to identify and respond to student homelessness. First, districts can start with routine education data that they already have in hand coupled with some easily obtainable public address information for places that serve families in housing crises. Three strategies that rely on only these data sources identified significantly more students as homeless than the school district. They also indicated risk for poor attendance and school mobility. These strategies included taking into consideration all students in families identified as experiencing homelessness, students with shelter addresses, and students who were identified as homeless in a previous year but staying at the same address. Practice emphasis can help address these disparities in identification by (a) having district staff follow up with students previously identified as homeless to see if their situation has changed, (b) asking about other family members whenever any student is identified as experiencing homelessness, and (c) routinely monitoring education records for known shelter addresses. However, education staff should keep in mind that families may be unwilling to disclose their housing situation due to shame, stigma, fear, or other reasons (Pavlakis, 2018). Furthermore, while public knowledge is available for some sorts of emergency shelter programs, the addresses of domestic violence shelters and other safe havens are not and should not be widely known. Education-housing provider partnerships are especially important for serving students staying in those programs.
Another promising data strategy detected families that appear to be doubling-up at the same address. This strategy produced both the highest number of students not identified by the district as homeless (4,544) as well as a considerable degree of overlap with district-identified homelessness (464 students, or 9.3% indicated by this strategy). These students were at risk for school mobility, but their attendance rate was marginally lower than other students. The inconsistency in risk for poor attendance may be because this group includes families who double up due to a housing crisis and also the host families who take them in. Only the former would meet the definition of homelessness in most cases and, perhaps, be expected to manifest risk to educational functioning associated with homelessness. Even so, districts interested in proactively identifying students experiencing homelessness likely can begin with these data strategies that rely on routine education data and then reach out to families to learn more about their housing situations.
Two strategies that used routine education data showed less promise in Camden City Schools. First, very few students had a motel or hotel address in their education record (n = 15 across five years), and all of them were already identified as homeless by the district. Further, while this group was at risk for lower attendance, there was no corresponding risk for school mobility. Both the low number of students identified by this strategy, and the fact that they were already known to the district, might be specific to Camden, a city without any hotels or motels within its borders during the study period and a school district that emphasizes outreach to families staying in certain motels in neighboring counties (e.g., to provide transportation to Camden City schools). This strategy might be more relevant in other districts. Also, students who only reside in a motel or hotel for a very short time might not have that address included in their education records. Second, students living in mobile home parks were rarely identified as homeless by the school district but also were not more likely to experience school mobility and showed a nonsignificant effect for higher attendance than other students in the district. While this group is called out in federal legislation on student homelessness, it seems relatively unlikely that they are experiencing homelessness in the current study.
Integrated Data Strategies
Four strategies considered education data integrated with data from housing-related agencies or healthcare providers. These strategies go beyond what districts can do with education data alone. Rather, they acknowledge and can guide efforts at multisystem collaboration that is widely emphasized in comprehensive homelessness response plans.
Substandard Housing
Two data strategies in the current study attempted to identify students staying in substandard housing, a form of homelessness that tends to be underidentified and overlooked (e.g., National Center for Homeless Education, 2022). The current findings showed mixed success in this regard: while both strategies surfaced considerable numbers of students at addresses deemed substandard, and both corresponded to risk for school mobility, one (based on DPW records of vacant properties) was not significantly related to lower attendance and the other (based on a visual property survey) showed a nonsignificant trend for lower attendance. Additional research is needed to understand this pattern of results. Perhaps these students left substandard housing midyear due to finding better housing or following an event that damaged otherwise adequate housing (e.g., a housefire or weather-related damage). This would increase the likelihood of school mobility but not necessarily have a large impact on attendance. Additional data is needed to understand the processes that explain these findings and to help clarify whether partnerships with agencies charged with enforcing housing codes would be fruitful in improving the homelessness response.
Homelessness Known to Healthcare Providers
Collaboration with healthcare providers appears especially important for educators hoping to identify and support students experiencing homelessness. Linking health records to students and their co-residing guardians produced meaningful increases in counts of student homelessness in the district. Formal diagnoses indicating homelessness and severe housing instability were relatively rare. Even so, considering diagnoses produced a significant number of cases beyond identified student homelessness in the district, and this group had significantly lower attendance and no difference in risk for school mobility.
More common were indications in the healthcare contact note that homelessness was occurring. This strategy produced a relatively high number of cases beyond those already identified as homeless by the district, and this group of students were at risk for both poor attendance and school mobility. This strategy was only based on a single school year unlike the others that were based on five years, underscoring the high potential of this strategy. Clinicians at local health systems were aware of many patients’ homelessness. Homeless education liaisons have an opportunity to collaborate with healthcare providers (Briggs et al., 2013) when it comes to disseminating information about rights and services. Alternative models of healthcare delivery, such as school-based health centers, can provide even deeper coordination between educators and healthcare providers (Cutuli, 2022). Partnerships and collaboration can help open referral pathways to assist education systems in supporting students experiencing homelessness.
Opportunities for State Education Coordinators
State departments of education and state-level homeless education coordinators may be better positioned to use integrated data to support district staff. The current findings have important implications for districts interested in using their own education data to guide outreach to identify and serve students who may be experiencing homelessness and for encouraging partnerships with other health and human service providers with overlapping missions. State departments of education have greater resources and opportunities to partner with other state agencies to integrate data for planning, research, and evaluation purposes.
State leaders have the opportunity to collaborate with a range of health and human services administered at the state level (e.g., Medicaid / CHIP; Supplemental Nutrition Assistance Program; emergency and transitional housing programs; rental assistance and other eviction prevention programs). Meanwhile, state homeless education coordinators are positioned to serve as conduits to direct, advise, and support districts in executing effective plans to respond to student homelessness. State departments also are more likely than most districts to have access to the data infrastructure needed to integrate multiagency records, including education records across districts within the state in the service of following highly mobile students (e.g., through statewide longitudinal education data systems). State-level leadership can ensure compliance with important privacy protections (e.g., FERPA and HIPAA protections) that permit data use without individual consent for specific research and evaluation purposes (Petrila, 2015), though ethical considerations still encourage authentic engagement with and data governance involving representatives of those whose records are being used. Interagency state collaboration through data sharing and analyses of integrated data can inform individual-agency effectiveness in identifying and serving children, youth, and families experiencing homelessness. It is also useful to inform cross-agency efforts at coordination and policy and practice within and across agencies.
For some types of programs, administrative data cannot be shared or used for the purposes of outreach without individual consent/authorization (Petrila, 2015). Nevertheless, state leaders may see value in seeking needed individual consents or authorizations from caregivers for interagency data sharing as a routine practice. Dependent on relevant state and federal statues, individual consents/authorizations could allow various agencies to share information, coordinate, and outreach to families when it is in families’ best interest instead of relying solely on caregivers self-identifying or pursuing needed referrals from multiple providers through their own initiative.
Limitations
These findings are only as good as the data on which they rely. Administrative data may not be ideal for detailed analyses aimed at student homelessness. First, data quality may not be precise. If addresses or guardianship in education records, for example, are not kept up to date, then findings based on these variables may be skewed. Other findings suggest changes in family structure, especially family separations, are not rare among families during homeless episodes (Shinn et al., 2017). This could contribute to inflated estimates of likely homelessness based on these strategies. In addition, this particular IDS did not include data from the homelessness management information system (HMIS), which would provide most emergency, transitional, and other crisis housing interventions. We need additional research from districts deploying these strategies to make lists of potential homeless situations coupled with outreach, documenting the sensitivity and specificity of these strategies.
Families and unaccompanied students often have varied reasons to be guarded about sharing information with education, health, and human service agencies. These include concerns about becoming involved with certain agencies, avoiding social stigma, and desire for privacy balanced with the perception that information-sharing is either necessary or will result in meaningful assistance (Pavlakis, 2018). Student and family willingness to share private information, and whether this information gets recorded in accessible ways (e.g., healthcare diagnosis versus contact notes) influences the accuracy of findings based on administrative data.
Conclusion
The current findings offer viable tools for districts to take a first-and-significant step in proactively engaging students and families who may be experiencing homelessness. Findings demonstrate that there are meaningful numbers of students who appear to be experiencing homelessness and are at risk for poor attendance and school mobility that can be discerned using district data in combination with publicly available information. In addition, collaborations with healthcare providers show particular promise for helping local education agencies ensure that homelessness does not get in the way of education.
Supplemental Material
sj-pdf-1-edr-10.3102_0013189X231215347 – Supplemental material for Strategies to Better Identify Student Homelessness Using Data in an Urban School District
Supplemental material, sj-pdf-1-edr-10.3102_0013189X231215347 for Strategies to Better Identify Student Homelessness Using Data in an Urban School District by J. J. Cutuli, Sandra Torres Suarez, Aaron Truchil, Tyler Yost and Ciani Flack-Green in Educational Researcher
Footnotes
This report was created as part of a research-practice partnership wholly funded by a grant from the Institute for Education Sciences of the U.S. Department of Education to Cutuli (PI) and Torres Suarez (Co-PI) (R305H190067). Publication made possible in part by support from the Nemours Grants for Open Access from Library Services. The opinions expressed are those of the authors and do not necessarily represent views of the Camden City School District, Nemours Children’s Health, the Institute of Education Sciences, or the U. S. Department of Education.
Authors
References
Supplementary Material
Please find the following supplemental material available below.
For Open Access articles published under a Creative Commons License, all supplemental material carries the same license as the article it is associated with.
For non-Open Access articles published, all supplemental material carries a non-exclusive license, and permission requests for re-use of supplemental material or any part of supplemental material shall be sent directly to the copyright owner as specified in the copyright notice associated with the article.