
Abstract
This study provides a comprehensive global snapshot of wealth-based inequalities in higher education attendance. We draw on data from 117 countries to describe cross-national patterns in higher education attendance rates, disaggregated by wealth quintile and country income group. We then calculate four different indicators to quantify the size of wealth-based inequality in higher education attendance and completion for each country. Our findings point to large wealth-based inequalities in higher education attendance cross-nationally, which are: substantially larger than inequalities in secondary completion, larger in low- and middle-income countries than high-income countries, and negatively associated with national wealth. The results serve as a foundation for future studies on how country-level factors and policies exacerbate or reduce wealth-based inequalities.
Keywords
Participation in higher education globally has increased substantially over the past 3 decades (Barakat & Shields, 2019; Marginson, 2016; Schofer & Meyer, 2005). In 2018, the global gross tertiary enrollment rate (GTER) was 38%, up from 19% in 2000 and 9.75% in 1970 (UNESCO Institute of Statistics [UIS], 2020a). Expanded access to higher education is linked to many national and global development outcomes (Oketch et al., 2014; Peercy & Svenson, 2016; Schofer et al., 2021), and equitable access to higher education has been incorporated into the United Nations’s Sustainable Development Goals (SDGs), with Target 4.3 committing to “affordable, quality technical, vocational and tertiary education, including university” (United Nations, 2018). For the individual, higher education is an important determinant of subsequent economic opportunity and other life outcomes, including lifetime earnings, overall health, and social status (Oketch et al., 2014). Yet access to higher education remains unequal within and between countries, and inequalities in higher education attainment contribute to reproducing intergenerational inequalities (Jerrim & Macmillan, 2015).
Until recently, it has been impossible to compare the extent of wealth-based inequalities in higher education attendance and completion worldwide due to a lack of cross-nationally comparable data on students’ background characteristics (Ilie & Rose, 2016; Koucký et al., 2007; Krafft & Alawode, 2018; Sánchez & Singh, 2018; Santiago, 2008). The lack of data has been pronounced in low- and middle-income countries. This inability to measure and compare wealth-based inequalities in higher education stands in stark contrast to the large and sophisticated scholarship on inequalities in academic achievement at the primary and secondary levels thanks to international large-scale assessments such as the Programme for International Student Assessment and the Trends in International Mathematics and Science Study (Montt, 2011; Van de Werfhorst & Mijs, 2010). Moreover, the lack of data on higher education inequality means that many important questions have remained unexplored, including how wealth-based inequalities in higher education compare to lower levels of education (e.g., secondary), to other forms of inequality (e.g., gender and race-based), and over time. Developing measures for the extent of wealth-based inequality in access to higher education cross-nationally is a much-needed step in advancing our understanding of how country-level factors and policies affect inequalities in participation and completion cross-nationally.
Addressing this need, this study calculates wealth-based inequalities in higher education attainment cross-nationally. To do this, we first compile wealth-disaggregated higher education attendance rates in 117 countries and describe cross-national patterns. We then calculate four different indicators that quantify the extent of wealth-based inequality in higher education attendance rates for each country. Specifically, the indicators we calculate are the wealth parity index, a ratio between the attendance rates of the wealthiest and poorest quintiles; the odds ratio (OR), a ratio between wealthiest and poorest quintiles’ odds of attendance; the dissimilarity index, a measure of proportionality of attendance across all wealth quintiles; and the human opportunity index, a measure that combines both proportionality and overall attendance rates to measure progress toward universal access.
All four inequality indicators point to similar findings: Inequalities in higher education attendance are substantially larger than those in secondary completion. They are also larger in low- and middle-income countries than high-income countries and are strongly negatively associated with national wealth. Yet more nuanced differences between indicators also highlight the fact that how inequality is calculated may affect interpretations of how large higher education inequality is, which is an important consideration for global monitoring efforts tracking progress toward the SDGs (United Nations, 2018). Ultimately, this study serves as a foundation for future research on how country-level factors and policies affect wealth-based inequalities over time.
Literature Review
A substantial literature on educational inequality has documented how ascribed characteristics, including race, gender, and parental socioeconomic status, shape an individual’s expected educational attainment (Alon, 2009; Shavit et al., 2007). Studies consistently find that young people from wealthier backgrounds and urban regions and those with university-educated parents are more likely to attend and graduate from higher education, attend more prestigious programs and institutions, and attend graduate school. Yet in contrast to the extensive literature on unequal access to higher education in high-income countries (Jerrim et al., 2015; Jerrim & Vignoles, 2015), research examining inequalities in higher education in lower- and middle-income countries are rare. The existing literature focuses on a handful of countries for which there are data on individuals’ characteristics, including Cambodia (Chea, 2019), Chile (Quiroz et al., 2022), Egypt (Buckner, 2013; Krafft & Alawode, 2018), Tunisia and Jordan (Krafft & Alawode, 2018), India (Chakrabarti, 2009; Sánchez & Singh, 2018), Indonesia (Ogawa & Iimura, 2010), Vietnam (Sánchez & Singh, 2018), and Peru (Sánchez & Singh, 2018). Most of these studies rely on labor market or living standards surveys to model determinants of individuals’ access to higher education, which is typically modeled as a binary variable (i.e., enrolled or not).
Few studies have examined inequality in higher education across multiple countries outside of North America and Europe. In a notable exception, Ilie and Rose (2016) used data from the Demographic and Health Surveys (DHSs) to examine wealth-based inequalities in net higher education attendance in 35 countries in South Asia and Sub-Saharan African countries. Their analysis compared the richest half to the poorest half of the population and showed large differences in net attendance by gender and family wealth. However, they did not put the size of inequalities in perspective relative to other world regions or other levels of education.
In fact, for numerous methodological reasons, it remains difficult to compare the overall extent of inequality in higher education across multiple countries. Methodologically, most studies do not seek to quantify overall inequality; rather, they report the size of inequality as the marginal effect of family wealth on an individual’s likelihood of being enrolled in higher education relative to others. This makes the reference category critically important to interpretations because the size of inequality varies depending on which two groups are being compared. Another concern for cross-national comparability is that studies use different indicators to operationalize family wealth. Although most studies divide the population into wealth quintiles, some use wealth terciles or quartiles. This lack of consistency can affect interpretations of how large disparities are.
Recognizing the limitations of these approaches, scholars have recently sought to develop comparable measures of inequality of opportunity. In a comprehensive report on inequality of opportunity in Latin America, De Barros et al. (2009) applied a dissimilarity index (D-Index) to education outcomes. Similarly, Krafft and Alawode (2018) used household surveys from Egypt, Jordan, and Tunisia to calculate a D-Index as an indicator of inequality in access to higher education, which they argued is the first of its kind. Other recent studies point to the insights that can be gleaned by calculating era-specific indicators of a country’s extent of inequality in higher education access and attainment (Simson, 2021). Recognizing the need for cross-nationally comparable measures of national inequality in higher education, this study calculates country-level measures of wealth-based inequality in higher education attendance rates around the world and describes cross-national patterns.
Data and Methods
Data
This study uses data from the World Inequality Database on Education (WIDE), a public data set produced by the Global Education Monitoring Report, an independent agency of UNESCO that monitors progress toward Education for All and the SDGs (United Nations, 2018). 1 WIDE extracts data from nationally representative demographic, health, and labor market surveys, including Demographic and Health Surveys (DHSs), Multiple Indicator Cluster Surveys (MICSs), and the EU Statistics on Income and Living Conditions (EU-SILC), among others, to track educational inequalities. Our study uses wealth-based inequality data from the most recent year available for each country to provide a snapshot of current trends. To ensure data quality, we keep only countries with data after 2010. Our final data set includes surveys from 117 countries between 2010 and 2019, with 77% of surveys conducted between 2012 and 2015. The data set covers all world regions and country income levels (see Tables A.1 and A.2 in the Appendix available on the journal website).
Conceptualizing wealth
To disaggregate educational indicators by wealth, we use WIDE’s wealth index quintiles (WIQs), where WIQ1 represents the poorest 20% of the population and WIQ5 represents the wealthiest 20% of the population. The household surveys included in WIDE use different measures to classify family wealth. Most surveys from Europe use household income, and most others (e.g., DHSs and MICSs) use household characteristics and assets to classify youth into wealth quintiles (see Section B.1 in the Appendix available on the journal website). There are many debates concerning how to measure family wealth and also specific concerns over the comparability between surveys that use income and those that use household assets. Prior studies have found that assets and income may be measuring slightly different aspects of family wealth: long-term economic status versus present-day availability of resources, respectively (Lora, 2008). Despite these nuances, household assets and income are often highly correlated with one another. Filmer and Pritchett (2001) showed that the internal validity of both measures of income and household characteristics and assets were reliable in measuring family wealth. Similarly, using a household survey from Mexico with detailed data on income and expenditure, McKenzie (2005) found that asset-based indicators were as reliable as income and nondurable consumption indicators in measuring inequality in education, specifically school attendance and educational attainment. This finding is important because it suggests that many types of data can be used to reliably classify the population along a wealth distribution. In our study, a key assumption is that the wealth indices in the underlying surveys are carefully designed, contextually appropriate, and calibrated by survey designers to reliably capture wealth gradations in that context.
Country income groups
We also disaggregate our analysis by country income group. For this purpose, we use the World Bank’s country income group classification which uses countries gross national product per capita (converted from local currency to U.S. dollars) to categorize countries into four income groups: low-, lower-middle-, upper-middle-, and high-income countries (World Bank, 2023).
Educational outcome variables
The focus of our analysis is higher education, which in most countries includes both 2- and 4-year postsecondary education resulting in either a diploma or degree (i.e., International Standard Classification of Education Levels 5 and 6). The most commonly used measure in cross-national studies to quantify participation in higher education is the GTER, an indicator that is publicly available through UIS. However, the GTER is an administrative indicator, which does not report on differential rates of tertiary access for youth from different backgrounds. The major advantage of using nationally representative household surveys is that they collect data on individuals’ background characteristics, allowing for disaggregated analysis. Accordingly, for this study, we use an indicator from WIDE on current higher education participation: the percentage of people between the ages of 18 and 22 years attending higher education during the data collection period. This indicator does not differentiate between students who attended but dropped out and those who never attended. Additionally, due to its narrow age range, the indicator does not account for overage students. As such, it can best be conceptualized as an indicator of a country’s net tertiary attendance rate.
Although the focus of our analysis is on the tertiary attendance rate, to contextualize indicators of tertiary attendance, we also analyze two other educational indicators available in WIDE: upper secondary completion rate and 2-year tertiary completion rate. In WIDE, the upper secondary completion rate is defined as the percentage of youth who graduated upper secondary school and are 3 to 5 years older than the normative graduation age. The tertiary completion rate is calculated as the percentage of people ages 25 to 29 years old who have completed at least 2 years of higher education regardless of whether they graduated or not. As with higher education attendance, both the secondary and tertiary completion rates are based on specific age bands and therefore exclude overage students, which may differentially affect countries’ estimates.
Data Analysis
To analyze global trends, we first conduct a descriptive analysis of educational indicators, disaggregated by wealth quintile and country income group. Next, we calculate various indicators of country-wide inequality. Although attendance and completion rates can be reported as percentages, inequality is a relative concept; as such, there is no single way to measure inequality. Therefore, we calculate four indicators of unconditional educational inequality, each of which conceptualizes inequality slightly differently. Most of these measures have been previously used to calculate inequality in access to lower levels of schooling or in other domains, such as health care. The four indicators are as follows:
Wealth Parity Index
The Wealth Parity Index (WPI) is an interquintile measure that captures inequality between two subgroups, usually between the most advantaged and most disadvantaged groups (i.e., WIQ5 vs. WIQ1). The WPI is commonly used to calculate progress toward SDGs (UIS, 2020b), in part because it is easy to calculate and interpret (Antoninis et al., 2016). In our analysis, we compare the top quintile of the wealth distribution to the bottom 40% (i.e., WIQs 1 and 2 combined) because in some countries, tertiary attendance and completion rates among the poorest quintile are very low. In a few countries, primarily in Europe, we use the adjusted WPI (AWPI) to account for WPIs above 1 (see Section C.1 in the Appendix available on the journal website). The AWPI ranges from 0 to 2. As a measure of parity in educational attainment, higher numbers represent greater parity, with a value of 1 indicating that both groups have equal level education attainment and a minimum of 0 indicating extreme disparity at the expense of the poorest group. Meanwhile, an AWPI closer to 2 indicates a disparity at the expense of advantaged group whereby the disadvantaged group outperforms the advantaged group.
OR
A limitation of the WPI is that its value depends on overall enrollment. This can result in misleading interpretations when countries with very different national educational levels are compared (Antoninis et al., 2016). Consequently, the OR is typically preferred in sociological studies of educational inequality (Jerrim & Macmillan, 2015). The OR takes into account the likelihood of both inclusion and exclusion, allowing for comparisons across very different absolute levels of attendance (see Section C.1 in the Appendix available on the journal website). As with the WPI, we calculate the OR between the top quintile and the bottom 40% (i.e., WIQs 1 and 2 combined), given the small percentage of those in WIQ1 attending higher education in some countries. An OR of 1 means that the odds of higher education attendance of the advantaged group (i.e., WIQ5) and the least advantaged group (i.e., WIQs 1 and 2) are equal. The higher the OR is above 1, the greater the disparity between the advantaged group and disadvantaged group. Because ORs have significant skew, we report the log OR.
One disadvantage of both the WPI and ORs is that they only capture differences between two discrete groups, typically the wealthiest and the poorest. Neither provides a measure of inequality across the whole population. Understanding inequality across the wealth spectrum may be particularly important in higher education, where the recent expansion has typically benefited the middle classes. Therefore, we also calculate two measures of inequality across the whole population: the D-Index and the human opportunity index (HOI).
D-Index
The D-Index conceptualizes inequality as the difference between the existing distribution and equality, defined as proportionality. It asks: To what extent would higher education opportunities between subgroups need to be redistributed to be proportionate? The D-Index is a measure of the percentage of opportunities that would need to be redistributed from most advantaged groups to most disadvantaged groups to achieve equality between all groups (see Section C.2 in the Appendix available on the journal website; De Barros et al., 2009; Krafft & Alawode, 2018). The D-Index ranges from 0 to 1, where 0 indicates perfect equality of opportunity between groups and 1 indicates perfect inequality of opportunities. In our case, each quintile accounts for one-fifth of the population; therefore, for equality to prevail, each quintile would need to compose exactly 20% of seats in tertiary education. Such a distribution would account for a D-Index of O.
The HOI
Finally, we calculate a HOI, which is an indicator inspired by Sen’s (1976) capabilities approach. Like the D-Index, the HOI’s underlying assumption is that if access to opportunities is correlated with an individual’s circumstances (i.e., ascribed characteristics), then inequality exists. However, a society can have perfect equality when no one has access to capabilities-enhancing services such as education. From a capabilities perspective, denying basic services to all is a state of equal deprivation, not equal opportunity. Therefore, the HOI combines both the extent of opportunity and the equality of distribution (see Section C.3 in the Appendix available on the journal website). The HOI ranges from 0 to 1, with 0 representing equal deprivation and 1 denoting equal and universal access. It is a distribution-sensitive measure that accounts for the opportunities allocated to disadvantaged groups in relation to advantaged groups. However, it also increases as the number of opportunities for any group increases.
To examine the external validity of our inequality measures, we correlated our indicators with established measures of economic development, human development, education, and health. Our findings show a strong correlation between our inequality measures and measures across these domains (see Section D.1 in the Appendix available on the journal website). Additionally, a correlation analysis between our four indicators shows high consistency whereby countries with high inequality on one indicator tend to exhibit inequality on other indices as well (see Section D.2 in the Appendix available on the journal website).
Finally, in a third stage of analysis, we examine bivariate relationships between a country’s gross domestic product (GDP) per capita and the two population-wide educational indicators, the D-Index and the HOI. Although explanatory methods using multivariate regression are common in the field, they are beyond the scope of this article. Given the lack of data on wealth-based inequalities in higher education attendance cross-nationally, our primary goal is to describe cross-national trends, which we believe is a necessary first step that precedes attempts to explain them. Therefore, we have been intentionally selective in our analyses, with the goal of highlighting the potential of the WIDE data set and indicators of national higher educational inequality to identify cross-national patterns and generate avenues for future research.
Findings
Overview of Disparities in Educational Outcomes
Figure 1 presents the cross-national averages of each of our three educational outcomes—secondary completion rate, tertiary attendance rate, and tertiary completion rate—by wealth index quintile and country income group.
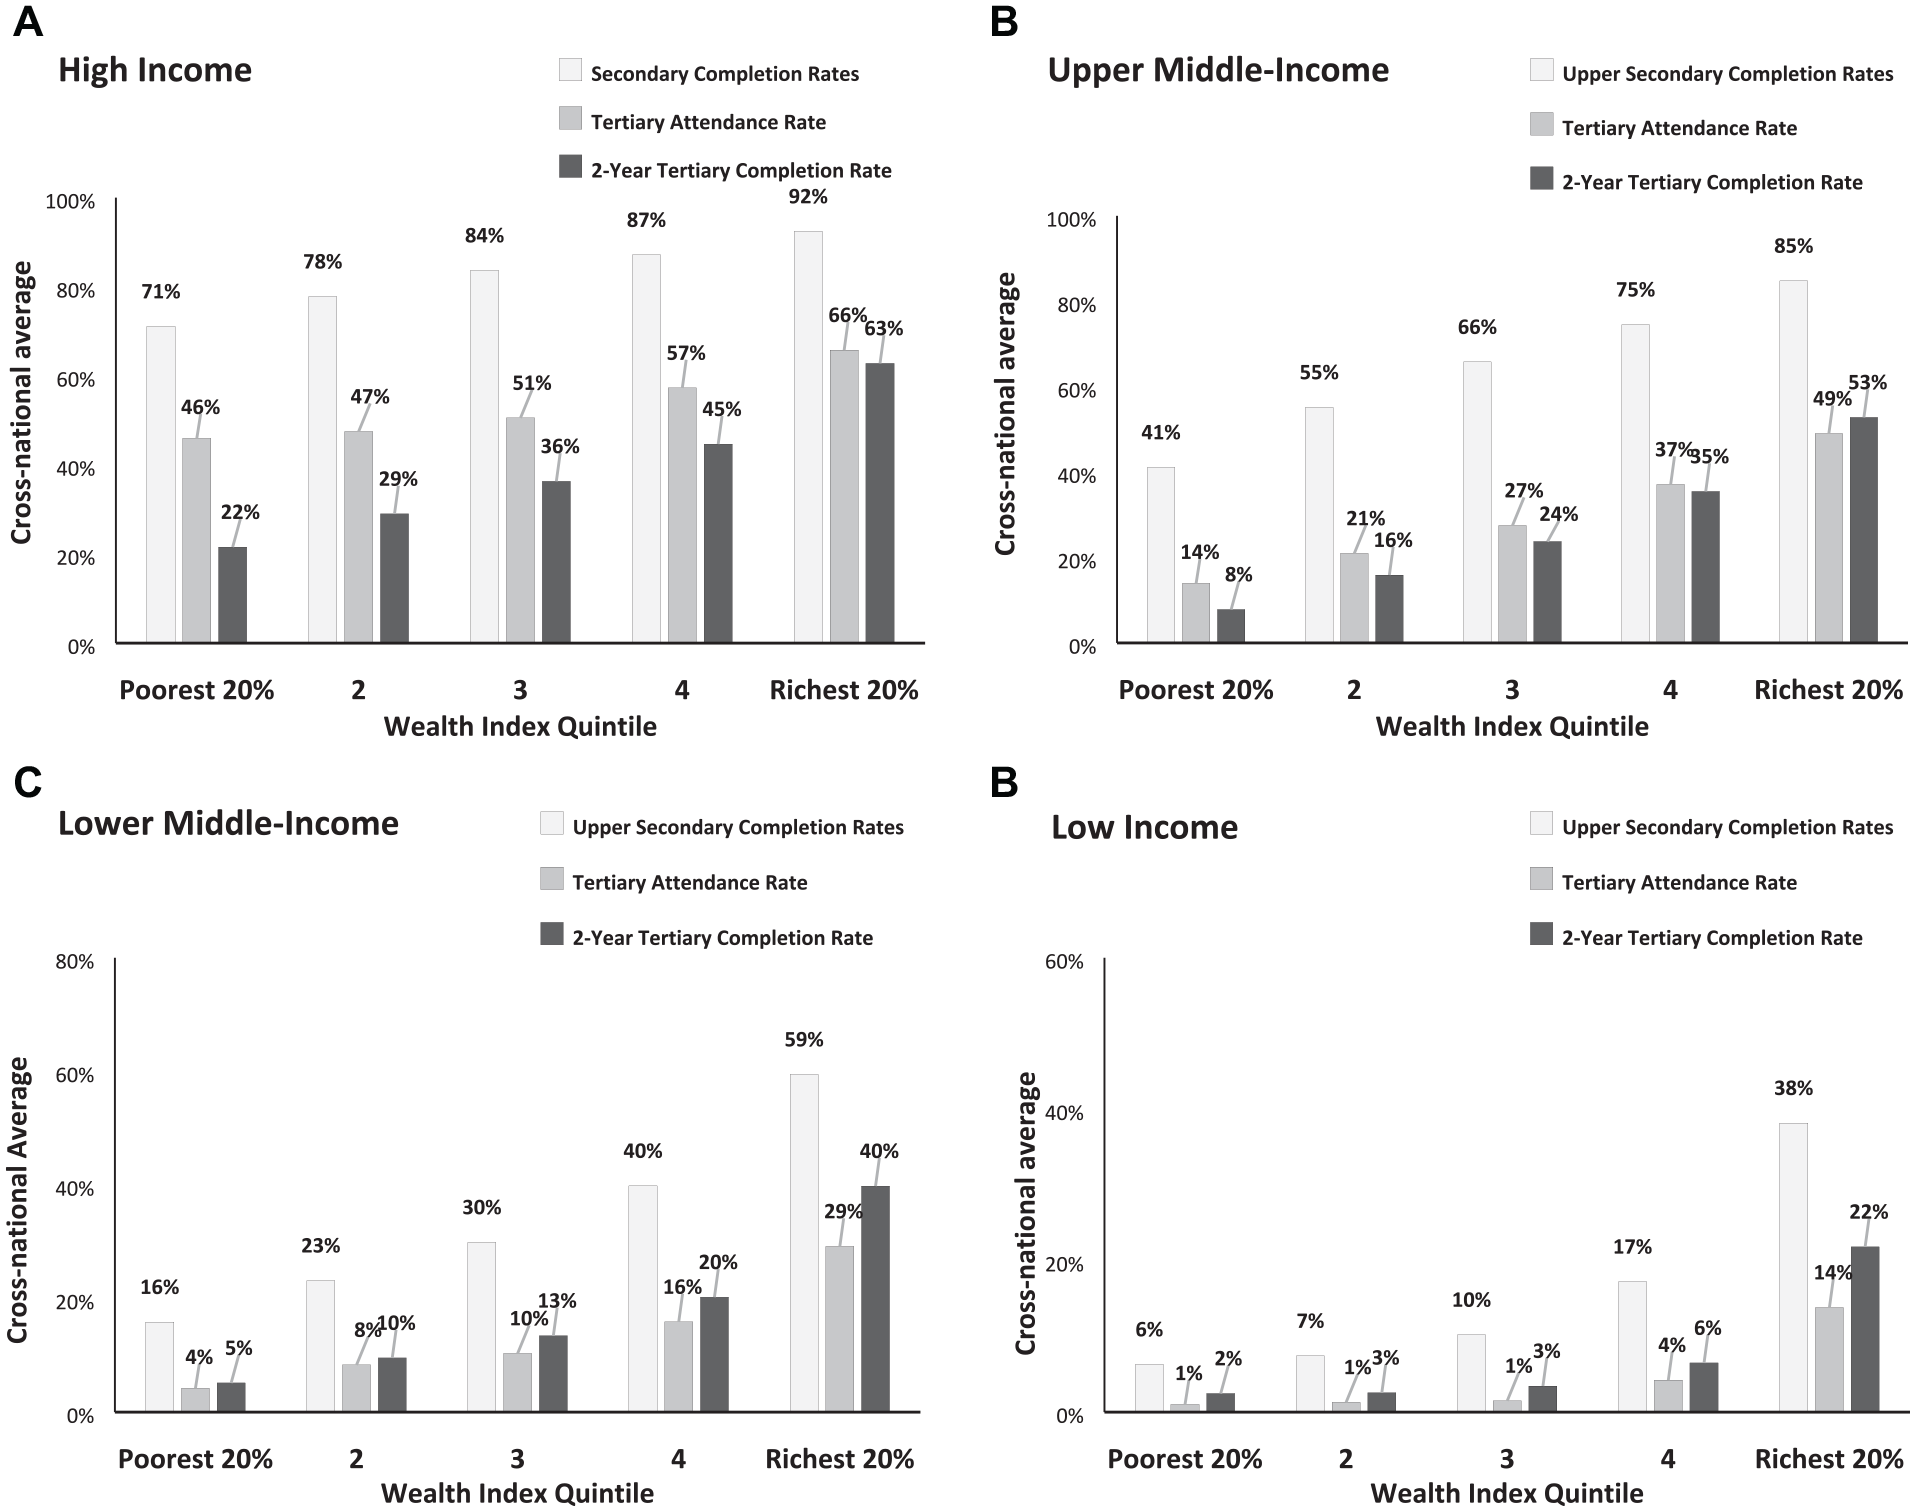
Cross-national averages of educational outcomes by country income groups
Figure 1 highlights three important findings. First, in line with the large literature on inequality, we find that there is a clear relationship between an individual’s family wealth and their likelihood of graduating from secondary school, attending higher education, and completing 2 years of higher education, and this is true across all country income groups. In low-income countries, 14% of students from the wealthiest quintile are attending higher education compared to only 1% of students of the poorest. In middle-income countries, the disparity is larger in overall magnitude: 29% of those from the wealthiest quintile attend higher education compared to only 4% of the poorest quintile in lower-middle-income countries. These percentages are 49% and 14%, respectively, in upper-middle-income countries. The size of the disparity is somewhat smaller in high-income countries, driven primarily by the larger proportion of students from lower wealth quintiles who attend higher education. These findings are in line with those expected by maximally maintained inequality (MMI) theory, which argues that opportunities for higher education are filled first by the wealthiest and only extend to those from lower-class backgrounds once a saturation level is reached among the wealthy (Shavit et al., 2007).
Second, Figure 1 shows that high-income countries have substantially higher participation and completion rates than middle- and low-income countries. Educational outcomes remain very low in absolute terms in low-income countries. For example, among the poorest 60% of the age cohort, tertiary attendance rates and tertiary completion rates are less than 3% in low-income countries. This finding points to a stark contrast between the promise of universal access to higher education enshrined in the SDGs (United Nations, 2018) and the reality that only a tiny proportion of students from the lower and middle classes in low-income countries attend higher education.
Third, secondary completion rates are substantially higher than either tertiary attendance or tertiary completion rates. However, there are differences across country income groups. Tertiary completion rates are lower than tertiary attendance rates in high-income countries for all WIQs. This finding is not surprising because many students who attend some higher education never complete 2 years. Moreover, some systems, including many in Europe, use difficult first-year exams to winnow students. However, in lower-middle and low-income countries, the reverse is true: Tertiary completion rates are higher than tertiary attendance rates across all WIQs. The reasons behind this finding deserve further investigation, yet one possible explanation is that many students in lower- and middle-income countries are overage or have gaps in their tertiary education and are not captured by the tertiary attendance rate, given its narrow age range. Nonetheless, the tertiary completion rates show that by age 29, youth from wealthier backgrounds are more likely to complete 2 years of tertiary education.
Quantifying Wealth-Based Inequalities
In this section, we synthesize the disparities observed in Figure 1 into country-wide indicators of inequality to facilitate comparisons across varied country contexts and educational levels. Table 1 presents the mean value for each of our four inequality indicators. The first column presents the cross-national averages, and subsequent columns present means for each country income group.
Inequality Indicators by Country Income Group
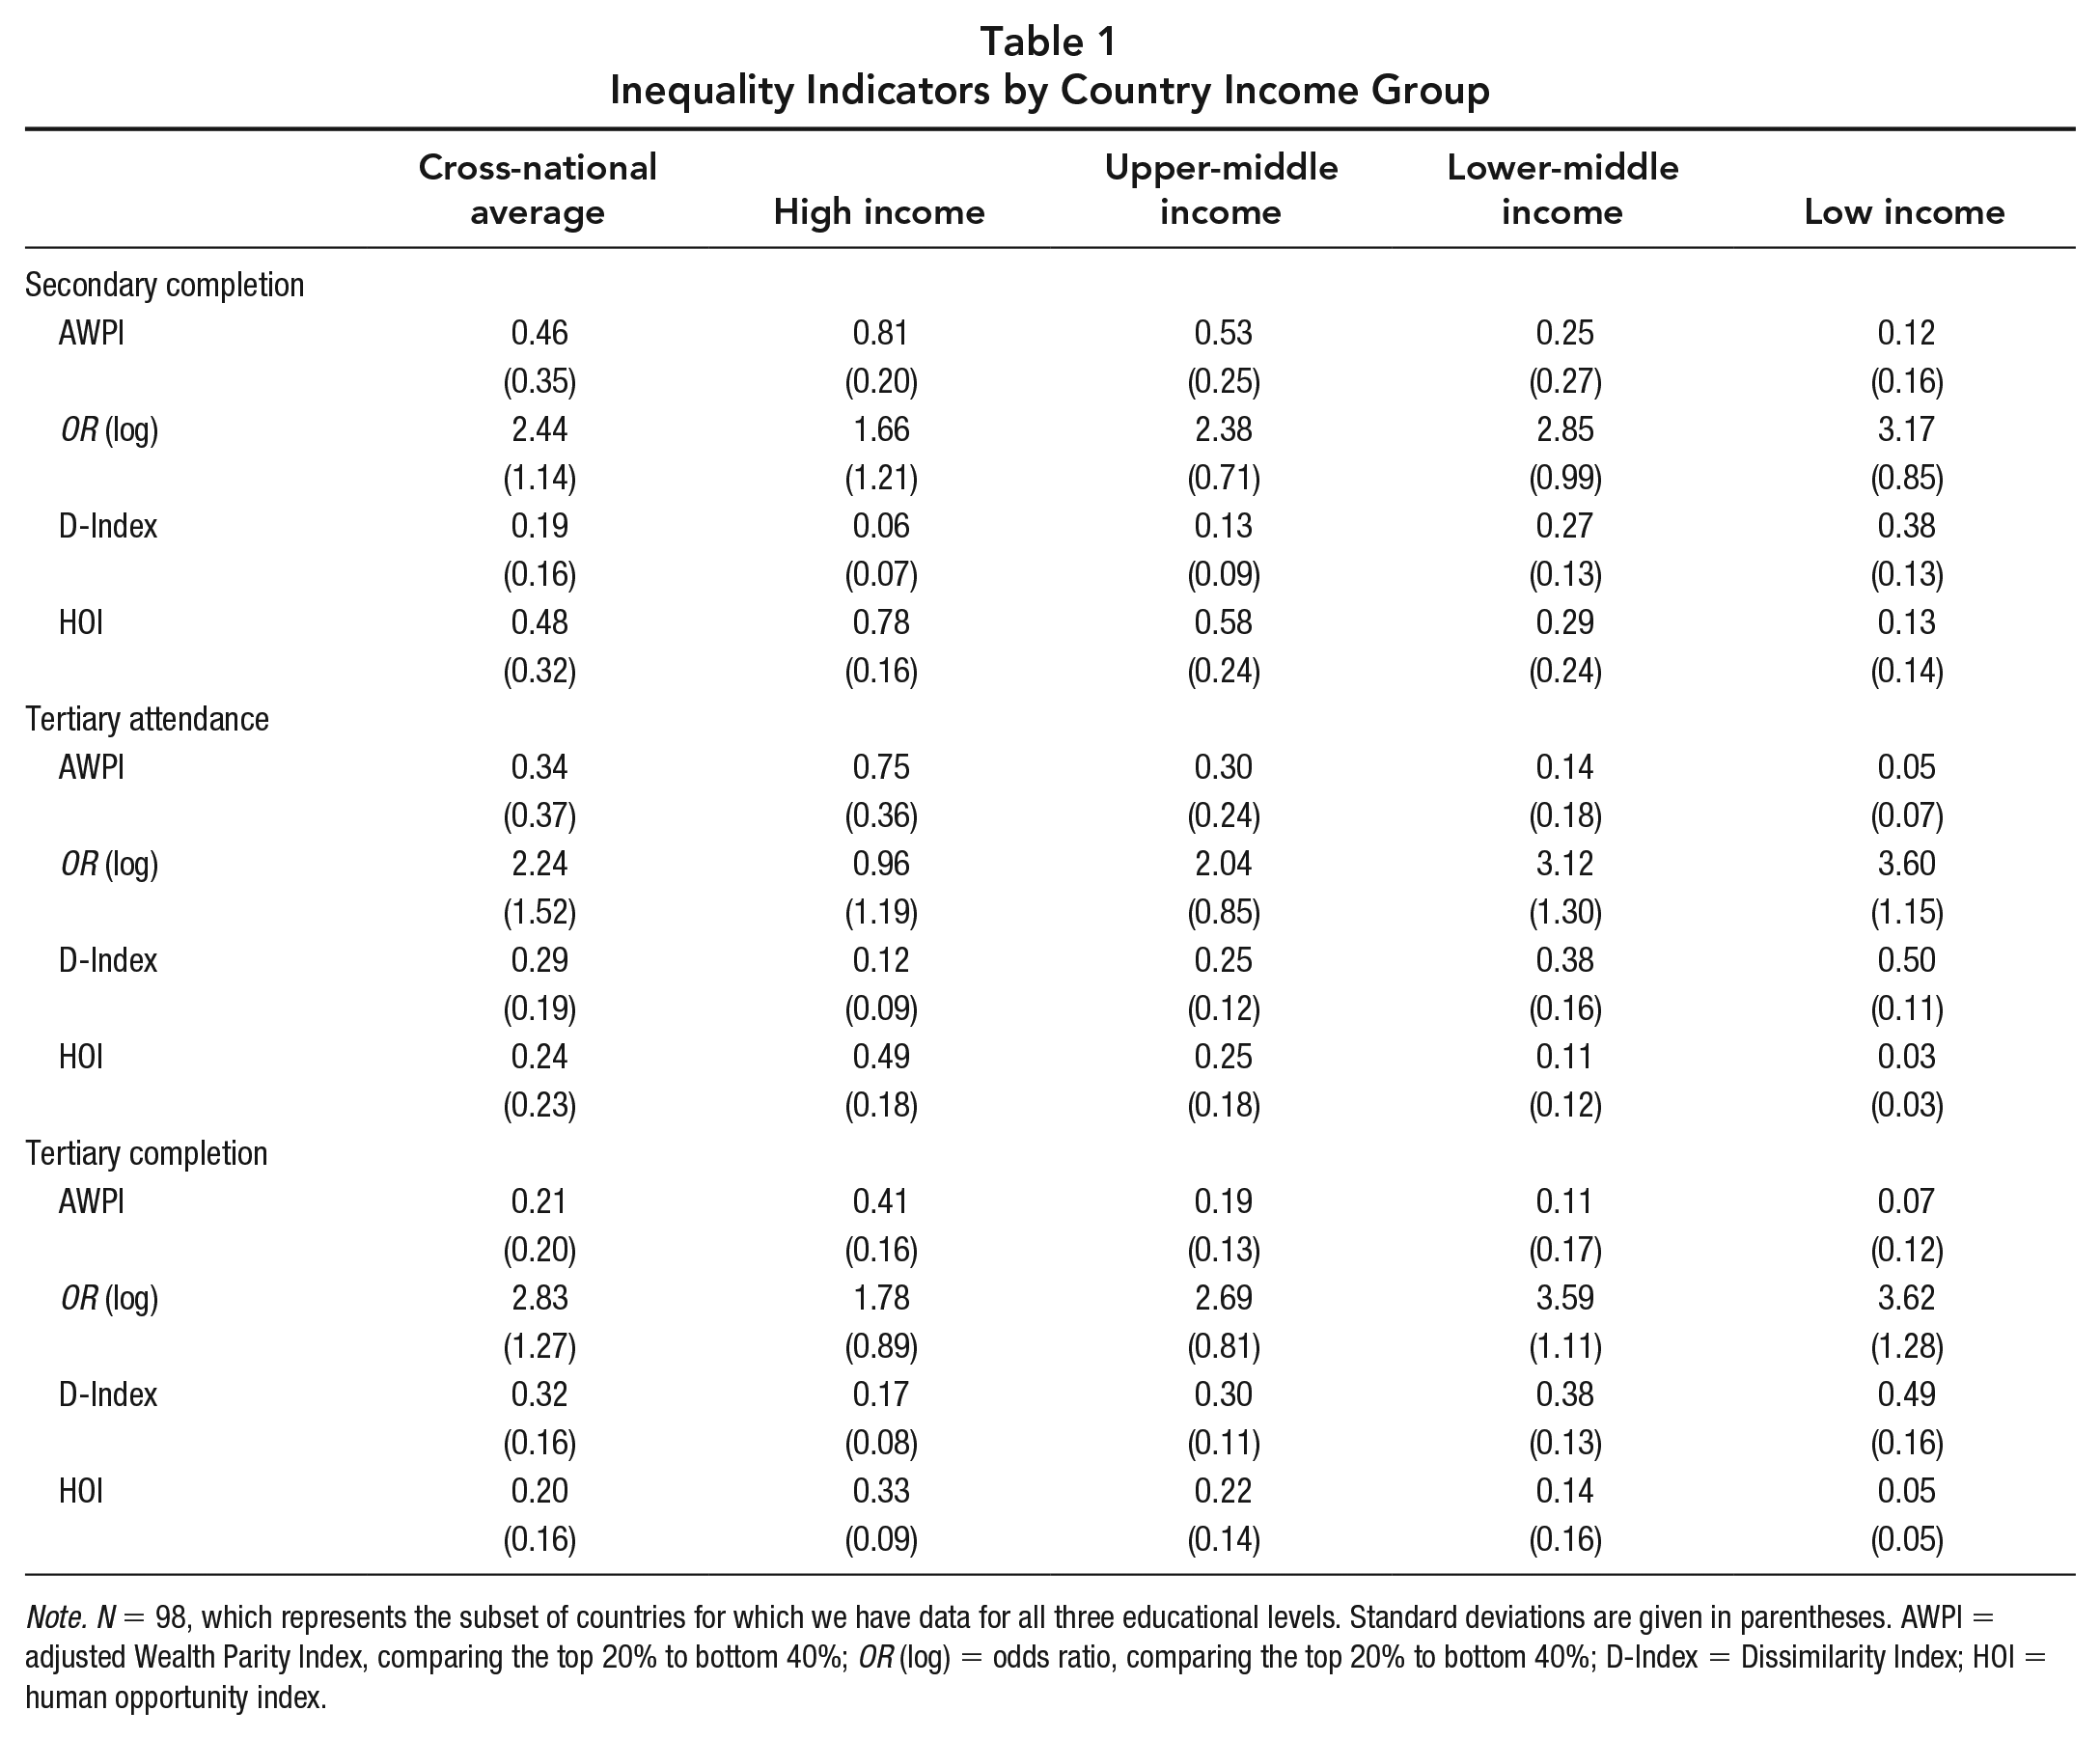
Note. N = 98, which represents the subset of countries for which we have data for all three educational levels. Standard deviations are given in parentheses. AWPI = adjusted Wealth Parity Index, comparing the top 20% to bottom 40%; OR (log) = odds ratio, comparing the top 20% to bottom 40%; D-Index = Dissimilarity Index; HOI = human opportunity index.
The indicator calculations support findings from the descriptive analyses by showing differences in the magnitude of inequality across WIQs, countries, and educational outcomes. Additionally, by calculating an overall magnitude of inequality, they also facilitate comparison and bring attention to some important differences in terms of where disparities are greatest. Generally, the indicators suggest that high-income countries have relatively low levels of inequality in terms of secondary completion rates (AWPI: M = .81, SD = .20) and tertiary attendance rates (AWPI: M = .75, SD = .36), yet inequalities in tertiary completion rates are larger (AWPI: M = .41, SD = .16). Figure 1 supports this finding, showing that tertiary completion rates among WIQ1 students remain quite low even in high-income countries. This finding suggests that although young people of all family backgrounds are attending higher education in high-income countries, family wealth facilitates persistence and success.
In contrast, in middle-income countries, both the WPI and HOI show that inequalities in secondary completion rates are much lower than those for either tertiary attendance or tertiary completion rates. Meanwhile, the inequality indicators for higher education attendance and completion are nearly equal in middle-income countries. This finding suggests that the transition to higher education may be an important determinant in overall inequality in middle-income countries and that the likelihood of transition may be more correlated with family wealth than either secondary completion or tertiary completion after a successful transition. Unequal transition rates to higher education could stem from many factors, including differential performance on secondary placement exams, family resources for tuition and fees, or opportunity costs. The role of family wealth in facilitating the transition to higher education among secondary graduates in middle-income countries is an important area for future research. Meanwhile, in low-income countries, inequalities are very high even at the level of secondary completion rates, pointing to secondary completion being a major factor in facilitating more equal higher education attendance and completion in low-income countries. Inequalities in tertiary attendance and tertiary completion do not vary much from those at the secondary level in low-income countries.
In contrast to the other indicators, calculations of the ORs give more weight to relative inclusion and relative exclusion by comparing participation rates between the wealthiest quintile and the poorest. A few ORs calculations do not fit the global pattern, which highlights the nuanced ways that inequalities occur in different contexts. For example, although low-income countries generally have larger inequalities than lower-middle-income countries, the OR for tertiary completion in lower middle-income countries (log OR: M = 3.59, SD = 1.11) is nearly equal to that in low-income countries (log OR: M = 3.62, SD = 1.28). The large ORs in lower-middle-income countries are driven by high tertiary attendance rates of the wealthiest quintile compensating for gains made among the poorest. For example, although there is little absolute difference in the tertiary completion rates of the poorest quintile in low- and lower-middle-income countries (2% and 5%, respectively), students from the wealthiest quintile in lower-middle-income countries have much higher tertiary completion rates at 40% compared to only 22% in low-income countries (see Figure 1). Although our analysis is cross-sectional, these findings are also consistent with MMI theory, which argues that the wealthiest groups are best positioned to benefit from expanding higher education. They also provide support for the argument that wealth-based inequalities may worsen before saturation is reached.
Higher Education Inequality and National Wealth
To highlight how national inequality indicators can be useful for understanding cross-national patterns, we examine the bivariate relationships between country wealth and inequality indicators. We present two bivariate analyses in Figures 2 and 3, namely, the relationship between national wealth and the D-Index and the HOI, respectively. To operationalize national wealth, we use logged GDP per capita, a widely used indicator of state capacity (Buckner & Khoramshahi, 2021; Schofer & Meyer, 2005). Both figures show a strong correlation between GDP per capita and equality of educational opportunity. Figure 2 clearly shows a strong negative relationship between D-Index and logged GDP per capita, indicating that country wealth is negatively associated with population-wide inequalities in access to higher education, as expected. However, when we graph the relationship between HOI and GDP per capita, we find some important nuances, as shown in Figure 3.
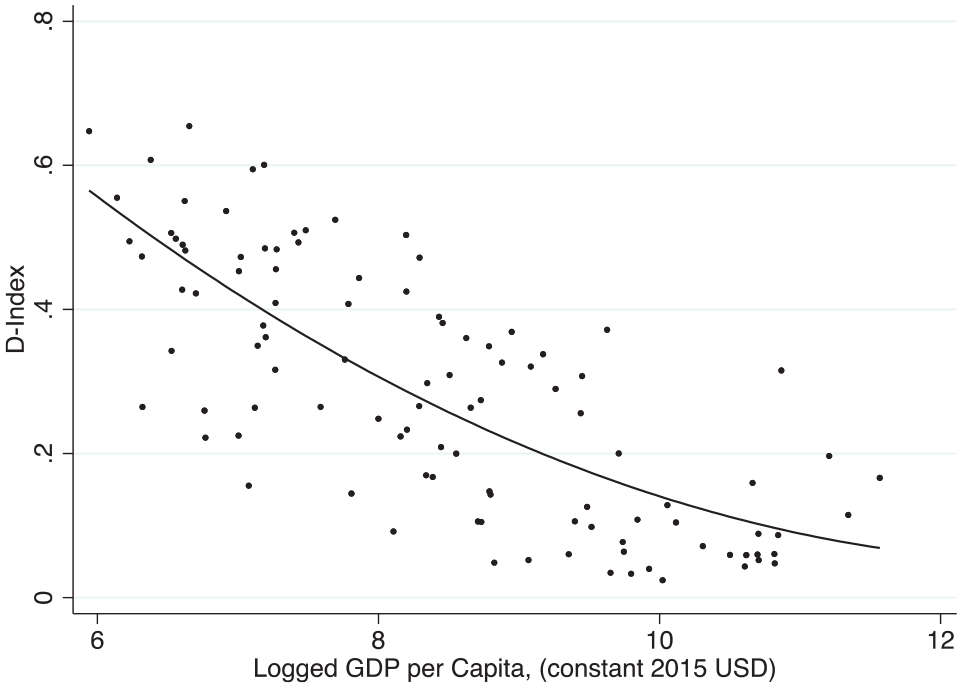
The bivariate relationship between the D-Index for tertiary attendance and GDP per capita
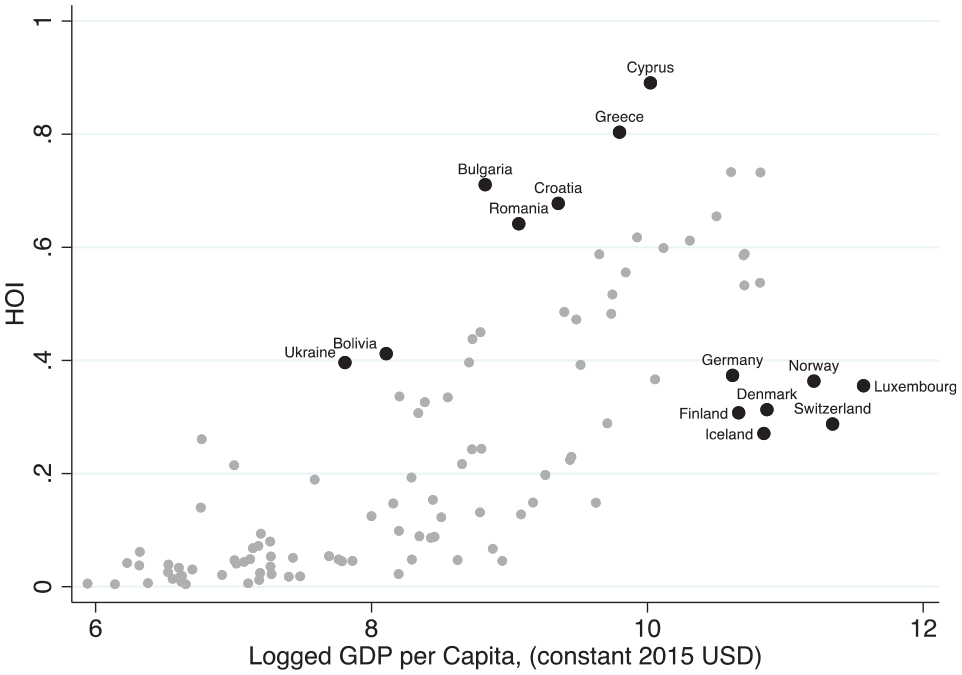
The bivariate relationship between the HOI for tertiary attendance and GDP per capita
Figure 3 clearly shows a positive relationship between HOI and logged GDP per capita, above a certain threshold. However, Figure 3 also shows that there is little relationship between GDP and HOI when logged GDP per capita is below 8 (around $4,500). The relationship increases exponentially above that threshold. This finding is in line with research that finds that massification is, thus far, primarily a phenomenon of middle- and high-income countries (Marginson, 2016). Figure 3 also shows trends not picked up by the D-Index. Specifically, Figure 3 highlights a number of countries that have high GDP per capita but relatively low HOI, namely, Germany, Denmark, Finland, Iceland, Norway, Luxembourg, and Switzerland. Most of these countries are well known for having very low tuition fees and strong vocational sectors in higher education. However, they also have relatively low participation rates, a fact that comes across in the HOI, which rewards countries for both equality of access and overall attendance rates. In contrast, other countries with lower GDPs per capita have been able to achieve relatively similar HOIs, including Ukraine and Bolivia, whereas countries such as Croatia, Romania, Bulgaria, Greece, and Cyprus have all achieved very high values on the HOI for tertiary attendance, likely because of their very high rates of higher education attendance generally (OECD, 2019). These findings show how specific calculations of inequality may affect our interpretations of how far a country is from meeting SDG Target 4.3 (United Nations, 2018), which has implications for global monitoring efforts that are tracking countries’ progress toward the SDGs (Antoninis et al., 2016).
Discussion and Conclusion
This study brings a new cross-national data set to examine wealth-based disparities in higher education attendance and quantifies the magnitude of inequality in each country to advance our understanding of how large wealth-based inequality in higher education attendance is cross-nationally. Unsurprisingly, our findings point to large inequalities in higher education attendance rates both within and between countries. The analyses bring new data to quantify the size of inequalities cross-nationally while also supporting and enriching the substantial literature on the durability of educational inequalities. We find that the magnitude of inequality increases at each additional level of education—secondary completion rates are more equal than tertiary attendance rates, and in most country income groups, tertiary attendance rates are more equal than 2-year tertiary completion rates. This finding is in line with the substantial literature that finds students from wealthier backgrounds are able to use their family resources to facilitate the transition to higher education and to remain enrolled in higher education (Alon, 2009; Shavit et al., 2007).
Second, we find higher education inequalities are strongly correlated with national wealth. In fact, higher education attendance and completion rates are substantially higher for even the most disadvantaged students in high-income countries than the wealthiest quintile in low-income countries, pointing to the importance of national educational systems in facilitating opportunities for both secondary completion and higher education attendance.
Yet our findings suggest that the educational level where family wealth most facilitates higher education opportunity may depend on the country’s level of economic development. Low-income countries have high inequalities in secondary completion rates, which drives subsequent inequalities in tertiary attendance and completion. Meanwhile, in middle-income countries, secondary completion rates are more equal than tertiary attendance or completion rates. This finding suggests that in middle-income countries, the transition to higher education is where family wealth has the largest impact on youth outcomes by facilitating transition and entry to higher education for the wealthiest. In contrast, high-income countries have relatively small disparities in secondary completion or tertiary attendance rates, yet there are still large gaps in tertiary completion rates, with the poorest students less likely to complete 2 years of higher education. These findings are broadly consistent with the literature in sociology of education that overall inequalities decline as each level of education massifies (Alon, 2009; Shavit et al., 2007). By examining countries with very different levels of higher education attendance, we observe countries across the massification spectrum. We see that in the aggregate, family wealth seems to facilitate educational opportunities in different ways depending on the overall level of higher education attendance. However, these observations remain speculative, and we hope that future research can test them more rigorously.
By providing a current snapshot of higher education inequality, we hope to facilitate future research on inequality in higher education attendance that is truly global in scope. One area for future research will be to examine trends over time. Many countries in the WIDE data set have data at multiple time points, which enables longitudinal analyses on how inequalities change within countries over time. Another important avenue for future research should examine the relationships between higher education policy and inequality. A long tradition of comparative studies has examined how educational systems reproduce unequal education and employment outcomes despite policies of expansion (Shavit et al., 2007). Yet the vast majority of these studies focus on North America, Europe, and other industrialized and high-income countries, where data infrastructures exist to gather demographic data at the individual level (Bernardi & Ballarino, 2014; Koucký et al., 2007; Shavit et al., 2007; for exceptions, see Ou & Hou, 2019; Simson, 2021). Consequently, our understanding of how system-wide reforms affect inequality has relied primarily on studies from North America and Europe, which differ in important ways from other world regions. Indeed, relationships that hold in industrialized countries may differ from those in low- and middle-income countries, where enrollment rates in higher education are lower, expansion is more recent (Simson, 2021), financial aid schemes vary, and massification has coincided with privatization (Buckner & Khoramshahi, 2021). Future studies can and should examine these relationships.
Supplemental Material
sj-pdf-1-edr-10.3102_0013189X231194307 – Supplemental material for Wealth-Based Inequalities in Higher Education Attendance: A Global Snapshot
Supplemental material, sj-pdf-1-edr-10.3102_0013189X231194307 for Wealth-Based Inequalities in Higher Education Attendance: A Global Snapshot by Elizabeth Buckner and Yara Abdelaziz in Educational Researcher
Footnotes
Notes
Authors
References
Supplementary Material
Please find the following supplemental material available below.
For Open Access articles published under a Creative Commons License, all supplemental material carries the same license as the article it is associated with.
For non-Open Access articles published, all supplemental material carries a non-exclusive license, and permission requests for re-use of supplemental material or any part of supplemental material shall be sent directly to the copyright owner as specified in the copyright notice associated with the article.