
Abstract
We provide novel evidence on the broader impacts of school choice systems by quantifying disparities in peer continuity from middle to high school in New York City. We find that Black and Hispanic students and those in high-poverty neighborhoods attend high school with a much smaller fraction of their middle school or neighborhood peers than their White, Asian, and low-poverty neighborhood counterparts. Disparities also emerge in peer isolation: 27% and 20% of Black and Hispanic students transitioned with no other student from their middle school, while only 7% to 8% of White and Asian students did. Group differences in choice similarity, which in part reflects systematic variation in the number of local school options, drive this result.
Keywords
School choice policies have transformed the way in which many students are assigned to schools in the United States. Their impact, however, varies between and within districts. Urban districts, which educate 43% of Black and Hispanic compared with 18% of White children, have disproportionately gained charter, magnet, and small schools of choice and are more likely to use centralized enrollment systems in which families submit applications ranking their most preferred schools (M. Benner & Boser, 2018; Bloom & Unterman, 2014; U.S. Department of Education, 2022; Wang et al., 2019). In contrast, traditional residentially based enrollment patterns persist more strongly outside of cities. That families of different racial and socioeconomic backgrounds are increasingly experiencing different school assignment policies makes understanding their full impact important for education researchers studying inequality. Such policies potentially have a range of cascading implications for individuals and communities, affecting not only academic opportunities but also the duration and continuity of children’s peer relationships.
The potential for choice-based school assignment to impact peer continuity and to do so differentially by social background is of interest for several reasons. First, shared contexts and propinquity are key predictors of friendship stability; as a result, most adolescent friends share the same school and grade (Moody, 1999). Friendships are more likely to dissolve when children transition from middle to high school with a smaller fraction of their peers (Felmlee et al., 2018; Temkin et al., 2018), and researchers have linked friendship instability across the transition with lower socioemotional well-being (A. D. Benner 2011; A. D. Benner et al. 2017). Second, continuity in childhood peer groups may promote stronger relationships between parents, a key determinant of social capital. Children who share schools for a longer period are more likely to experience intergenerational closure—parents knowing the parents of their children’s friends (Coleman & Hoffer, 1987; Day & Dotterer, 2020). Third, peer continuity can affect academic outcomes. Prior research found high-achieving middle school students performed better when they entered high school with a majority of their classmates, while low-performing middle school students struggled more academically (Langenkamp, 2009; Schiller, 1999). Together, these studies confirm that peer continuity is not only a quantity of interest in its own right but is also associated with social, emotional, and academic outcomes in high school.
In this article, we examine peer continuity in the transition from middle to high school in New York City (NYC), a context in which all eighth graders are required to rank their top choices and are centrally assigned (Abdulkadiroğlu et al., 2005). We address the following questions:
Research Question 1: To what extent do students experience peer continuity in the transition from middle to high school, and how do levels of peer continuity vary by race/ethnicity and neighborhood poverty?
Research Question 2: What role does high school choice similarity between peers in the same middle school and neighborhood play in the levels of and disparities in peer continuity?
Research Question 3: To what extent do differences in proximate school supply account for this pattern?
We find that the median high school applicant in NYC enrolled in a high school with only 3% of their middle school cohort; nearly one in five applicants were the only student in their ninth-grade class who attended their middle school. Black and Hispanic students and students living in high-poverty neighborhoods were the most isolated from their middle school peers, with 28% of Black students, 20% of Hispanic students, and 29% of students from high-poverty neighborhoods the only student in their ninth-grade class from their middle school cohort (vs. 7% of White students and 7% from low-poverty neighborhoods). The prevailing reason middle school cohorts do not remain peers is their own choice dissimilarity, not other factors, such as program selectivity or oversubscription (although these may influence initial choices). Features of the choice landscape—such as the number and size of nearby school options—are strongly related to choice similarity and, in turn, peer continuity.
While one might expect adolescents to prioritize friends and known peers when choosing schools, our results do not provide strong evidence of coordination, especially for traditionally disadvantaged students. If surprising, this finding is consistent with our own survey of NYC students attending high-poverty schools and recent survey evidence finding friends’ influence ranks low among applicant priorities in Chicago (Sartain & Barrow, 2022).
Background
School Choice and Peer Continuity
A small body of work focused primarily on neighborhoods has addressed peer continuity in the context of choice-based assignment systems. Burdick-Will (2017) examined differences in high school enrollment patterns across Chicago and found that students living in low-income and more violent neighborhoods attended a larger and more heterogeneous set of high schools than students living in higher-income and less violent neighborhoods. The latter tended to travel less far to school and clustered in a small number of destination high schools (see also Sirer et al., 2015). Lenhoff et al. (2022) defined “peer choice sets” in Detroit using the set of all schools attended by families in a neighborhood and identified neighborhoods in which the majority of students attended school close to home and others in which students attended a much more diffuse set of schools. Using idiosyncratic annual changes in application patterns, Ruijs and Oosterbeek (2019) found that students in Amsterdam were more likely to apply to a secondary school when more of their primary school classmates did. While none of these articles were specifically focused on peer continuity, their results suggest important differences in peer continuity by family background and neighborhood context.
The Role of Choices, School Supply, and Preferences on Peer Continuity
In a choice-based school assignment system, the likelihood students remain peers in a school transition depends on the specific school(s) they list on their applications. All else equal, students who make similar choices are more likely to remain peers than students who do not. Other factors also matter, including students’ likelihood of admission to the schools they apply to. Two students with the same top choice school, for example, are more likely to remain peers when they have higher likelihoods of assignment to that school.
This logic extends to the group level. Two student populations may differ in peer continuity because they differ in their propensity to have specific choices in common with their same-school or same-neighborhood peers. Alternatively, two groups with comparable choice similarity may differ in peer continuity if they differ in their likelihood of matching to and enrolling in their preferred choices. Understanding group differences in peer continuity therefore requires a consideration of factors that lead students in the same school or neighborhood to make the same choices as well as factors that lead to variation in match rates.
Choices are affected by factors on both the supply and demand sides. On the supply side, the spatial availability of schools and their admissions policies impact families’ willingness and ability to consider them. In many large districts, the quantity and quality of choices are unevenly distributed. Neighborhoods with higher fractions of Black residents have experienced more school closures and openings (Pearman & Greene, 2022), and fewer high-performing schools tend to be available in these neighborhoods (Edwards, 2021; Laverde, 2022; Sartain & Barrow, 2022).
In NYC, there are stark differences in the number and size of school options across neighborhoods and demographic groups (see Appendix Figures 1 and 2, available on the journal website). Most large comprehensive high schools in the boroughs of Manhattan and the Bronx have been closed and replaced with smaller themed high schools, giving residents more choices (Jennings, 2010; Kemple, 2015). Queens and Brooklyn, in contrast, offer a mix of school sizes, while Staten Island offers mostly large comprehensive high schools. Students may apply to any school in the city, and its extensive public transit system—which is subsidized for students—provides access to a large number of schools (Corcoran, 2018). However, prior studies have found that families have a strong preference for proximity when choosing schools (Glazerman & Dotter, 2017; Harris & Larsen, 2015; Hastings, Kane, & Staiger, 2006). Thus, we might expect residentially proximate families to make more similar choices, all else equal.
Admissions policies further shape the “effective” supply of schools (Corcoran & Baker-Smith, 2018; Rucinski & Goodman, 2022; Sartain & Barrow, 2022). In NYC during our study period, more than a third of all high schools screened applicants using academic or other criteria, such as an audition. Some gave admissions priority to students who lived in their borough, attended a “feeder” school, or attended an open house. The implication is that students who share academic eligibility or admissions priorities are more likely to share choices and remain peers than those who do not.
On the demand side, prior research has found variation in school preferences by family background, with high-socioeconomic status (SES) parents and parents of higher-achieving students more likely to prioritize schools with high test scores than low-SES parents and parents of lower-achieving students (Abdulkadiroğlu et al., 2020; Glazerman & Dotter, 2017; Harris & Larsen, 2015; Hastings et al., 2006). Families also differ in preferences for the racial composition of schools (Bell, 2009; Billingham & Hunt, 2016; Goyette, 2008; Hailey, 2022b; Schneider & Buckley, 2002) and school safety (Hailey, 2022a). Other constraints may prevent families from acting on their preferences, such as access to information (Corcoran & Jennings, 2019, Sattin-Bajaj 2014), proximity to higher-quality schools (Denice & Gross, 2016), and transportation. All else equal, we might expect shared preferences, constraints, and information within a school or neighborhood to lead to similar school choices.
Finally, in adolescence, peers may directly provide information or shape preferences. Prior work finds students have greater agency in high school choice than in earlier stages (Condliffe et al., 2015; Sattin-Bajaj, 2014; Teske et al., 2007), and international evidence suggests information sharing between peers and siblings plays a role in K–12 school choice (Dustan, 2018; Rosenqvist, 2018; Ruijs & Oosterbeek, 2019), but this has not been studied in the U.S. context. By looking at application similarity within schools, our analysis provides new—albeit indirect—evidence on the extent to which same-school peers in NYC make the same high school choices.
Data and Measures
Applications Data and Analytic Sample
Our analytic data set consists of individual high school applications from 2014–2015 matched to student demographic, residential location, achievement, and other information. Applications are from the main round of admissions when initial preferences were submitted and 92% of applicants were matched. 1 The matching algorithm is designed to be strategy-proof, meaning students are incentivized to reveal their true preferences (Abdulkadiroğlu et al., 2005). Students can list up to 12 choices. We used 2014–2015 because large-scale informational interventions we conducted during the 2016–2018 cycles may have affected peer continuity and application similarity in participating schools (Cohodes et al., 2022; Corcoran et al., 2018).
Nonapplications data include student race/ethnicity; gender; language spoken at home; disability status; residential census tract, elementary school zone, and borough; seventh-grade English language arts (ELA) and mathematics test scores; and ninth-grade enrolled school. Seventh-grade scores are the ones used by academically selective high schools and are the most recent at the time of application. We used an average of ELA and math scores—each standardized to M = 0 and SD = 1—as a composite measure of achievement. If either test score was missing, we used the nonmissing score.
Given known limitations of subsidized lunch eligibility as a measure of family income—especially in NYC, where many schools provide universal free meals—we assigned students an index based on the level of concentrated disadvantage in their census tract as a proxy for family income. Following Sampson et al. (1997), we conducted a factor analysis combining six tract-level measures from the 2011–2015 American Community Survey 5-year estimates; this yielded a continuous index that we grouped into citywide quintiles. 2
We excluded applicants from private, alternative, or special education schools, leaving 70,030 from 577 traditional and charter schools. Of our sample, 11.1% (7,775) attended a school that offered ninth grade, meaning they had the option to continue in their current school. (They were still required to apply and rank the school first.) We retained these students because not all chose to remain in their school. Because this group is more likely to attend ninth-grade together and have similar applications, we calculated our outcomes with and without them. Descriptive statistics for the analytic sample are reported in Appendix Table 1 (available on the journal website).
Measuring Peer Continuity
We measure middle to high school peer continuity in two ways. The first is the share of student i’s eighth-grade application cohort that enrolled in their high school in ninth grade. The second is a binary variable equal to 1 when i is the only student from their middle school in their ninth-grade class. These measures capture two dimensions of peer continuity, with the latter representing complete isolation from eighth-grade peers. We experimented with several alternatives, including the share and count of students in i’s ninth-grade class that attended i’s middle school in eighth grade. The findings were qualitatively very similar.
As an alternative conceptualization of peer continuity, we calculated the share of students in i’s neighborhood that enrolled in the same high school as i and a binary variable equal to 1 when i is the only student from their neighborhood in their ninth-grade class. Neighborhoods are defined using elementary school zones, based on current address. 3 This measure is of interest to the extent students in the same neighborhood know one another and are more likely to travel together to school; it is also aligned with prior work focused on neighborhoods (e.g., Burdick-Will, 2017; Lenhoff et al., 2022). The number of elementary zones in the sample (686) is larger than the number of middle schools (577) and contains fewer students, on average (101 vs. 121).
Measuring Choice Similarity
We measure choice similarity as the proportion of students in a reference group j who ranked student i’s first choice school among their top three. We refer to this measure as Top3:

where nj is the number of students in group j and Dik equals 1 if the first-choice school on i’s application is the first, second, or third choice on student k’s application (and zero otherwise). In our case, group j refers to a middle school cohort or neighborhood, but it can refer to any reference group. 4 While we considered more complex measures that incorporate more information about each application, Top3 has desirable properties, is computationally simple, and is easy to interpret. It is also strongly related to peer continuity, as we show later. In 2014–2015, roughly half of all applicants matched to their first choice, and 75% were matched to one of their top three.
In addition to Top3, we calculated for each student the proportion of students in reference group j who had identical top three choices in the same rank order. This special case could arise, for instance, when students have identical preferences, when friends coordinate applications, or when students follow the same set of recommendations from a teacher or guidance counselor.
Importantly, NYC eighth graders apply to programs rather than schools; in our sample, students applied to 727 programs in 427 high schools citywide. Some schools offer more than one program, although most (about 70%) offer just one. We focus on similarity in school choices rather than programs because these align with our notion of middle to high school peer continuity. However, we also calculated similarity using programs because these are what students list on their application. Because programs are a subset of schools, program choice similarity is always less than or equal that for schools.
Methods
We report means for our peer continuity and application similarity measures for the full sample and for student subgroups of interest, including race/ethnicity, levels of neighborhood disadvantage, and prior achievement. These describe the extent to which groups differ, on average, in peer continuity in their transition to high school and in their propensity to share specific school choices with others in their middle school or neighborhood.
While levels and group differences in these measures are of primary interest, we also examine the extent to which differences in peer continuity are “explained” by differences in application similarity (vs. differences in matches or enrollment behavior). We do this in three ways. First, we look descriptively at competing reasons for low peer continuity: a lack in overlap in choices versus other factors. Second, we recalculate our peer continuity measures assuming every student enrolled in their first-choice school. This removes any influence of match rates and focuses on top choices. Third, we use regression to show how predicted group differences in peer continuity change adjusting for differences in application similarity.
After demonstrating the importance of choice similarity for peer continuity, we use the following regression to identify student and other contextual factors that are systematically associated with peer continuity:
where
We report estimated coefficients from the full model but also show how successively adjusting for explanatory variables affects predicted gaps by race or neighborhood disadvantage. The first model includes only a quadratic function of prior achievement, the second adds the school supply measures
Results
Peer Continuity
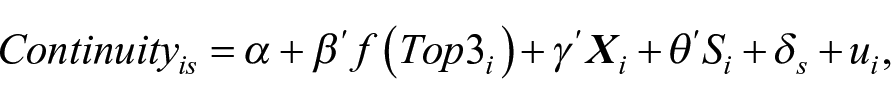
Table 1 reports student-level means for peer continuity from the same middle school (first two columns) and from the same neighborhood (second two columns). Focusing first on continuity from middle schools, we find the mean applicant enrolled in a ninth-grade class with roughly one in eight (12.3%) of their middle school cohort. This overstates peer continuity for the typical student, however, because the median applicant enrolled in a ninth-grade class with only 3.3% of their middle school cohort and nearly one in five applicants (18.2%) were the only student in their ninth-grade class who attended their middle school. When excluding students with the opportunity to remain in their school, overall peer continuity is lower, as expected (see Appendix Table 2, available on the journal website).
Middle to High School Peer Continuity
Note. Authors’ calculations using applications data provided by the Research Alliance for New York City Schools. The total number of students in an eighth-grade cohort and elementary zone are based on all applicants, including those who had the opportunity to remain in their middle school. ES = elementary school; MS = middle school.
There are notable differences in peer continuity and isolation by race, neighborhood disadvantage, language spoken at home, and prior achievement. Students who identified as White, lived in the lowest poverty census tracts, spoke English at home, and scored higher on seventh-grade tests enrolled in high schools with a larger share of their middle school cohort. Students who identified as Black or Hispanic, lived in the highest poverty tracts, spoke another language at home, and scored lower on tests experienced much less peer continuity. For example, the mean Black and Hispanic applicant enrolled in high schools with 9.9% and 11.2% of their middle school cohorts, respectively; the share for White applicants was nearly twice as high (20.2%). The share was only marginally higher for Asian applicants (12.4%), although Asian applicants were also among the least isolated based on the singleton measure.
Remarkably, 27% of Black and 20% of Hispanic applicants were the only student in their ninth-grade class who attended their middle school, compared to 7% of White and 8% of Asian applicants. Similar gaps were observed by prior achievement and neighborhood poverty: 23% of applicants who scored in the bottom quintile on state tests were isolated from their middle school class in ninth grade, compared to 11% of applicants in the top quintile. Twenty-nine percent of applicants living in the highest poverty census tracts were isolated from their middle school class, compared to 7% in the lowest poverty tracts. 6
The second two columns of Table 1 measure peer continuity from neighborhoods using elementary zones as a proxy. Group differences in neighborhood peer continuity mirror those for middle schools, although peer continuity overall tends to be lower by this measure. In part, this reflects prior sorting into middle schools: Students are more likely to transition to high school with peers from their middle school than peers from their neighborhood. Black students were by far the most likely to be the only student from their neighborhood in their ninth-grade class (35.0%) compared with Hispanic (28.4%), White (15.3%), and Asian (15.1%) students.
We also calculated the percentage of applicants who were both the only student from their middle school and the only student from their neighborhood in their ninth-grade class (not shown). Roughly one in nine (10.9%) were so isolated, including 15.8% of Black students, 12.0% of Hispanic students, 5.0% of Asian students, and 4.9% of White students.
Choice Similarity
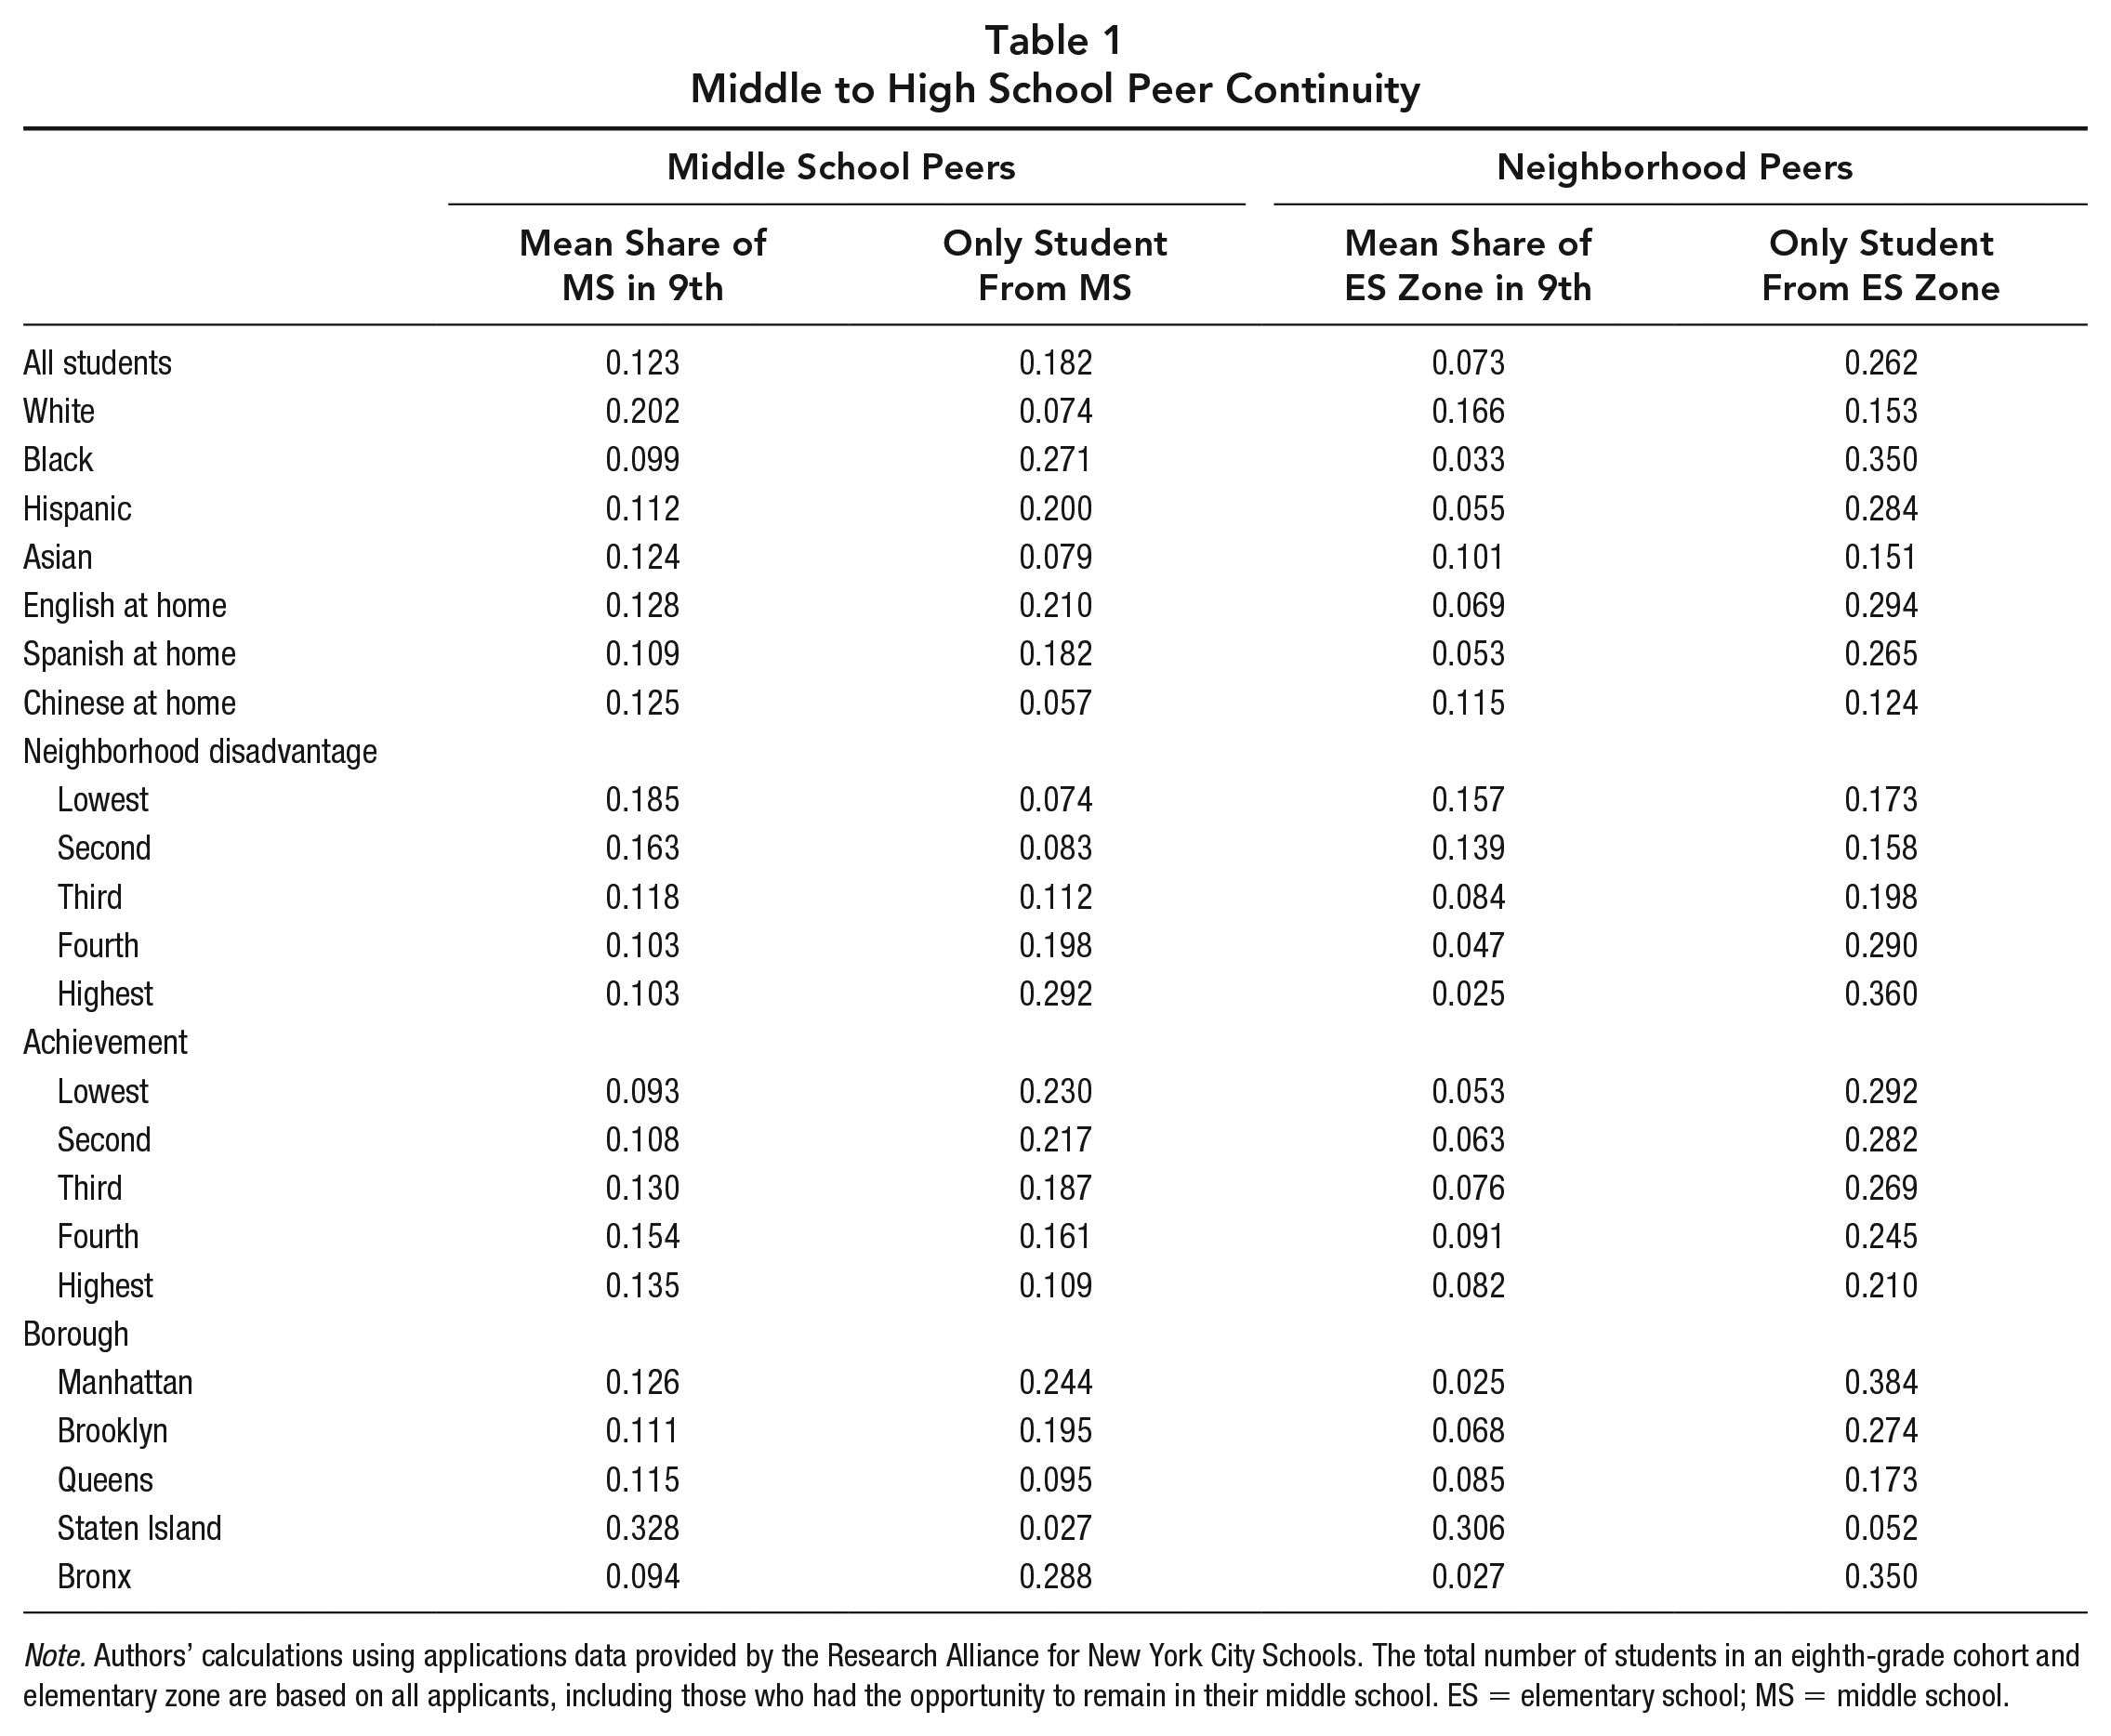
Table 2 reports student-level means for choice similarity using students from the same middle school as a reference group in the first two columns and same neighborhood in the second two columns. The average student’s first-choice high school could be found among the top three of 21.5% of other students in their cohort. The median is again much lower (10.8%). Identical applications are rare in NYC, with the average student sharing top three school choices with only 4.5% of their same-school peers. The median share is zero; indeed, for 69% of students, no other student in their middle school shared their top three ranked choices.
Within-School and Neighborhood Application Similarity
Note. Authors’ calculations using applications data provided by the Research Alliance for New York City Schools. Sample includes all eighth-grade students attending a New York City public middle school, including charter schools, who applied in the main round of admissions in 2014–2015. Reported values in the first and third columns are averages of the Top3 score for students listed in the leftmost column. Values in the second and fourth columns are the mean share with identical top three choices for students listed in the leftmost column. ES = elementary school.
Group differences in application similarity closely mirror patterns of peer continuity. Students who identified as White or Asian, lived in the lowest poverty census tracts, or scored higher on state tests were much more likely to share top choices with others in their middle school than were students who identified as Black or Hispanic, lived in the highest poverty tracts, or had lower test scores. The mean Top3 measures for White and Asian applicants were highest at 0.378 and 0.287, while Black and Hispanic applicants had the lowest similarity (0.146 and 0.176, respectively). Students living in the highest poverty neighborhoods were least likely to share top choices with others in their school (0.139), while those in the lowest poverty neighborhoods made the most similar choices (0.376). Students who scored in the top quintile were more than twice as likely to share top school choices (0.308) than those who scored in the bottom quintile (0.151). Identical top three choices were rare for any subgroup, but applicants who identified as White, lived in the lowest two quintiles of neighborhood poverty, and scored in the top two quintiles or lived in Manhattan or Staten Island were the most likely to share exact top choices. As with peer continuity, choice similarity is lower when excluding students with the option to continue (see Appendix Table 3, available on the journal website).
Appendix Table 4 (available on the journal website) reports the same statistics using programs rather than schools. These are worth noting given that students formally apply to programs, not schools. Because programs are a subset of schools, similarity is generally lower. Identical top three programs are extremely rare, suggesting students rarely coordinate their applications by listing the same ranked choices. Gaps in program similarity by race, prior achievement, and neighborhood disadvantage are roughly proportional to those in Table 2.
The last two columns of Table 2 measure application similarity within neighborhoods, again using elementary zones as a proxy. As with peer continuity, gaps in choice similarity are generally wider at the neighborhood level than at the school level.
The Link Between Choice Similarity and Peer Continuity
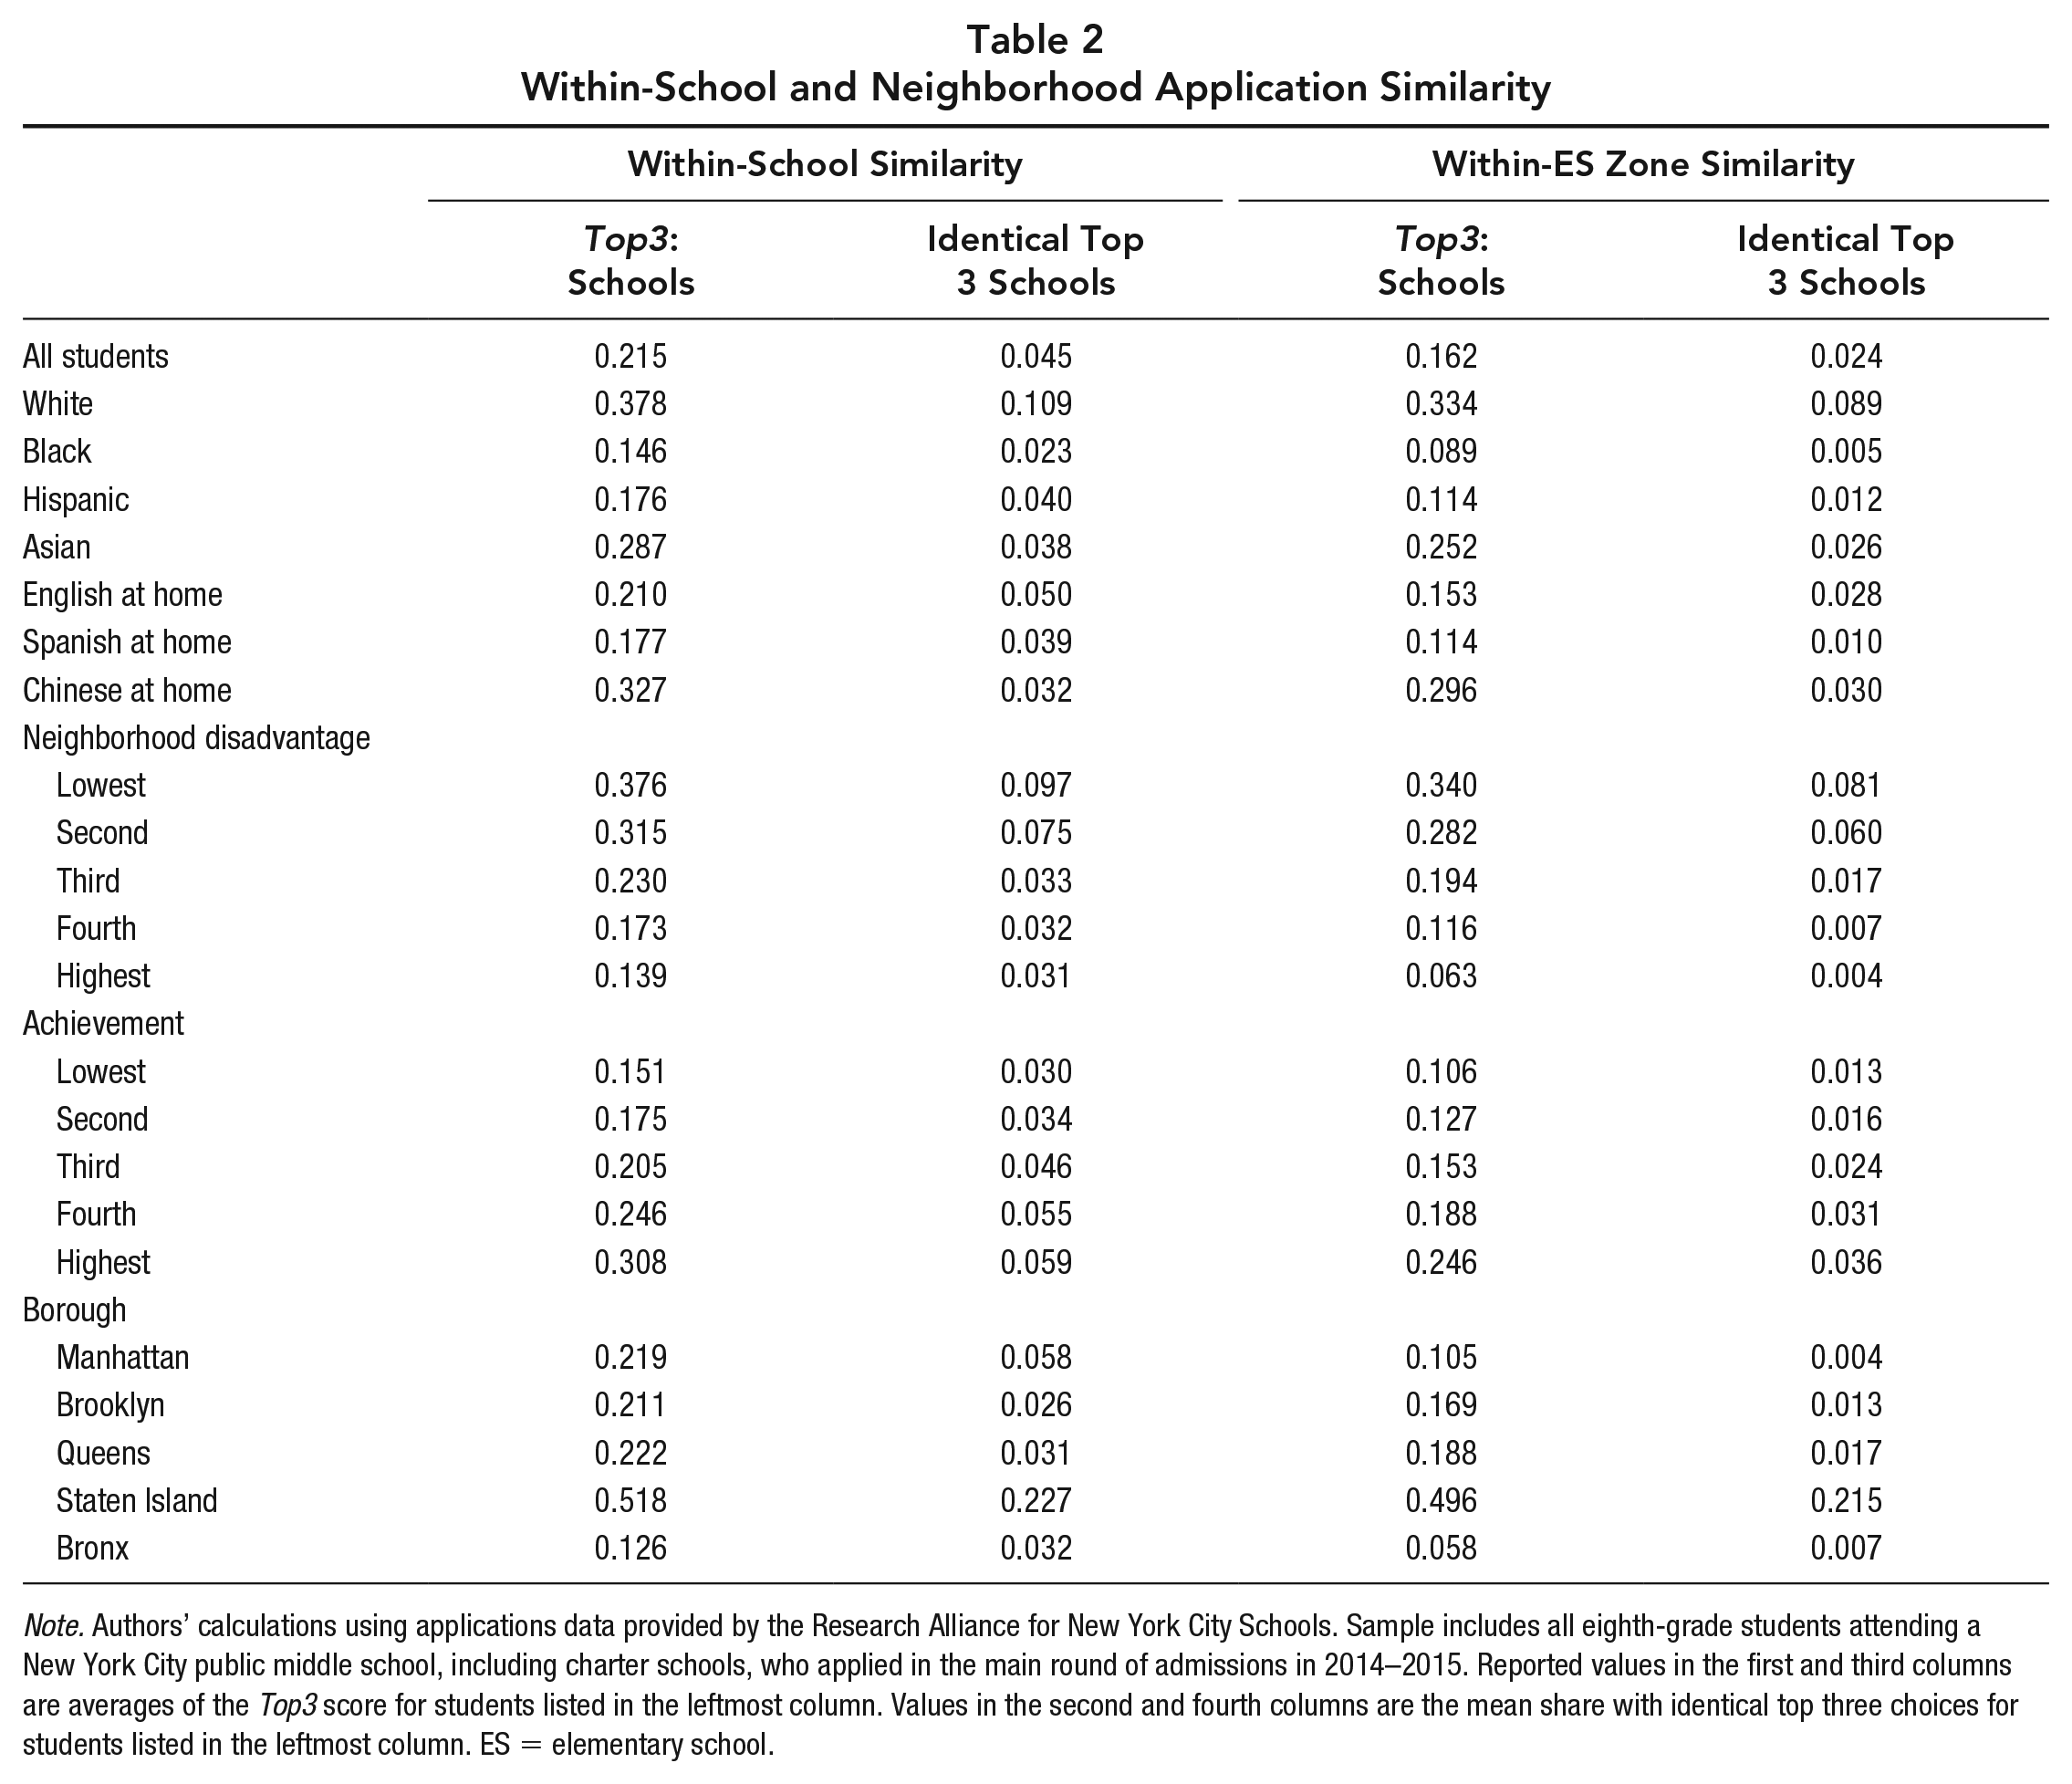
Results thus far reveal sizable group differences in peer continuity in the transition from middle to high school. Moreover, groups with high peer continuity are more likely to share top choices with others in their middle school or neighborhood. This observation reflects the natural link between student choices and the propensity to remain peers in a choice-based assignment system. Figure 1 displays the full bivariate relationship between peer continuity and Top3 application similarity in our sample. Not surprisingly, this relationship is strong, especially for the isolation measure.
Bivariate association between peer continuity/isolation and choice similarity.
These findings prompt two questions. First, to what extent are group differences in peer continuity explained by differences in choice similarity as opposed to differences in placements and enrollment conditional on choices? Second, what student and other contextual factors predict peer choice similarity and, by extension, peer continuity?
Table 3 addresses the first question in two ways. First, we divide members of i’s cohort who did not enroll in their high school into those who listed that high school anywhere on their application but did not match/enroll there (Column B) and those who did not list that school anywhere on their application (Column C). As the top row shows, the prevailing reason students do not remain peers in high school is a lack of overlap in choices. For the average student, 83% of their cohort who did not enroll in their high school did not list that school anywhere on their application. This share is higher for subgroups with low peer continuity (e.g., Black and Hispanic students and those living in high-poverty neighborhoods). Low peer continuity thus appears to be driven by dissimilar choices rather than lower match rates given similar choices.
Choices as an Explanation for Differences in Peer Continuity
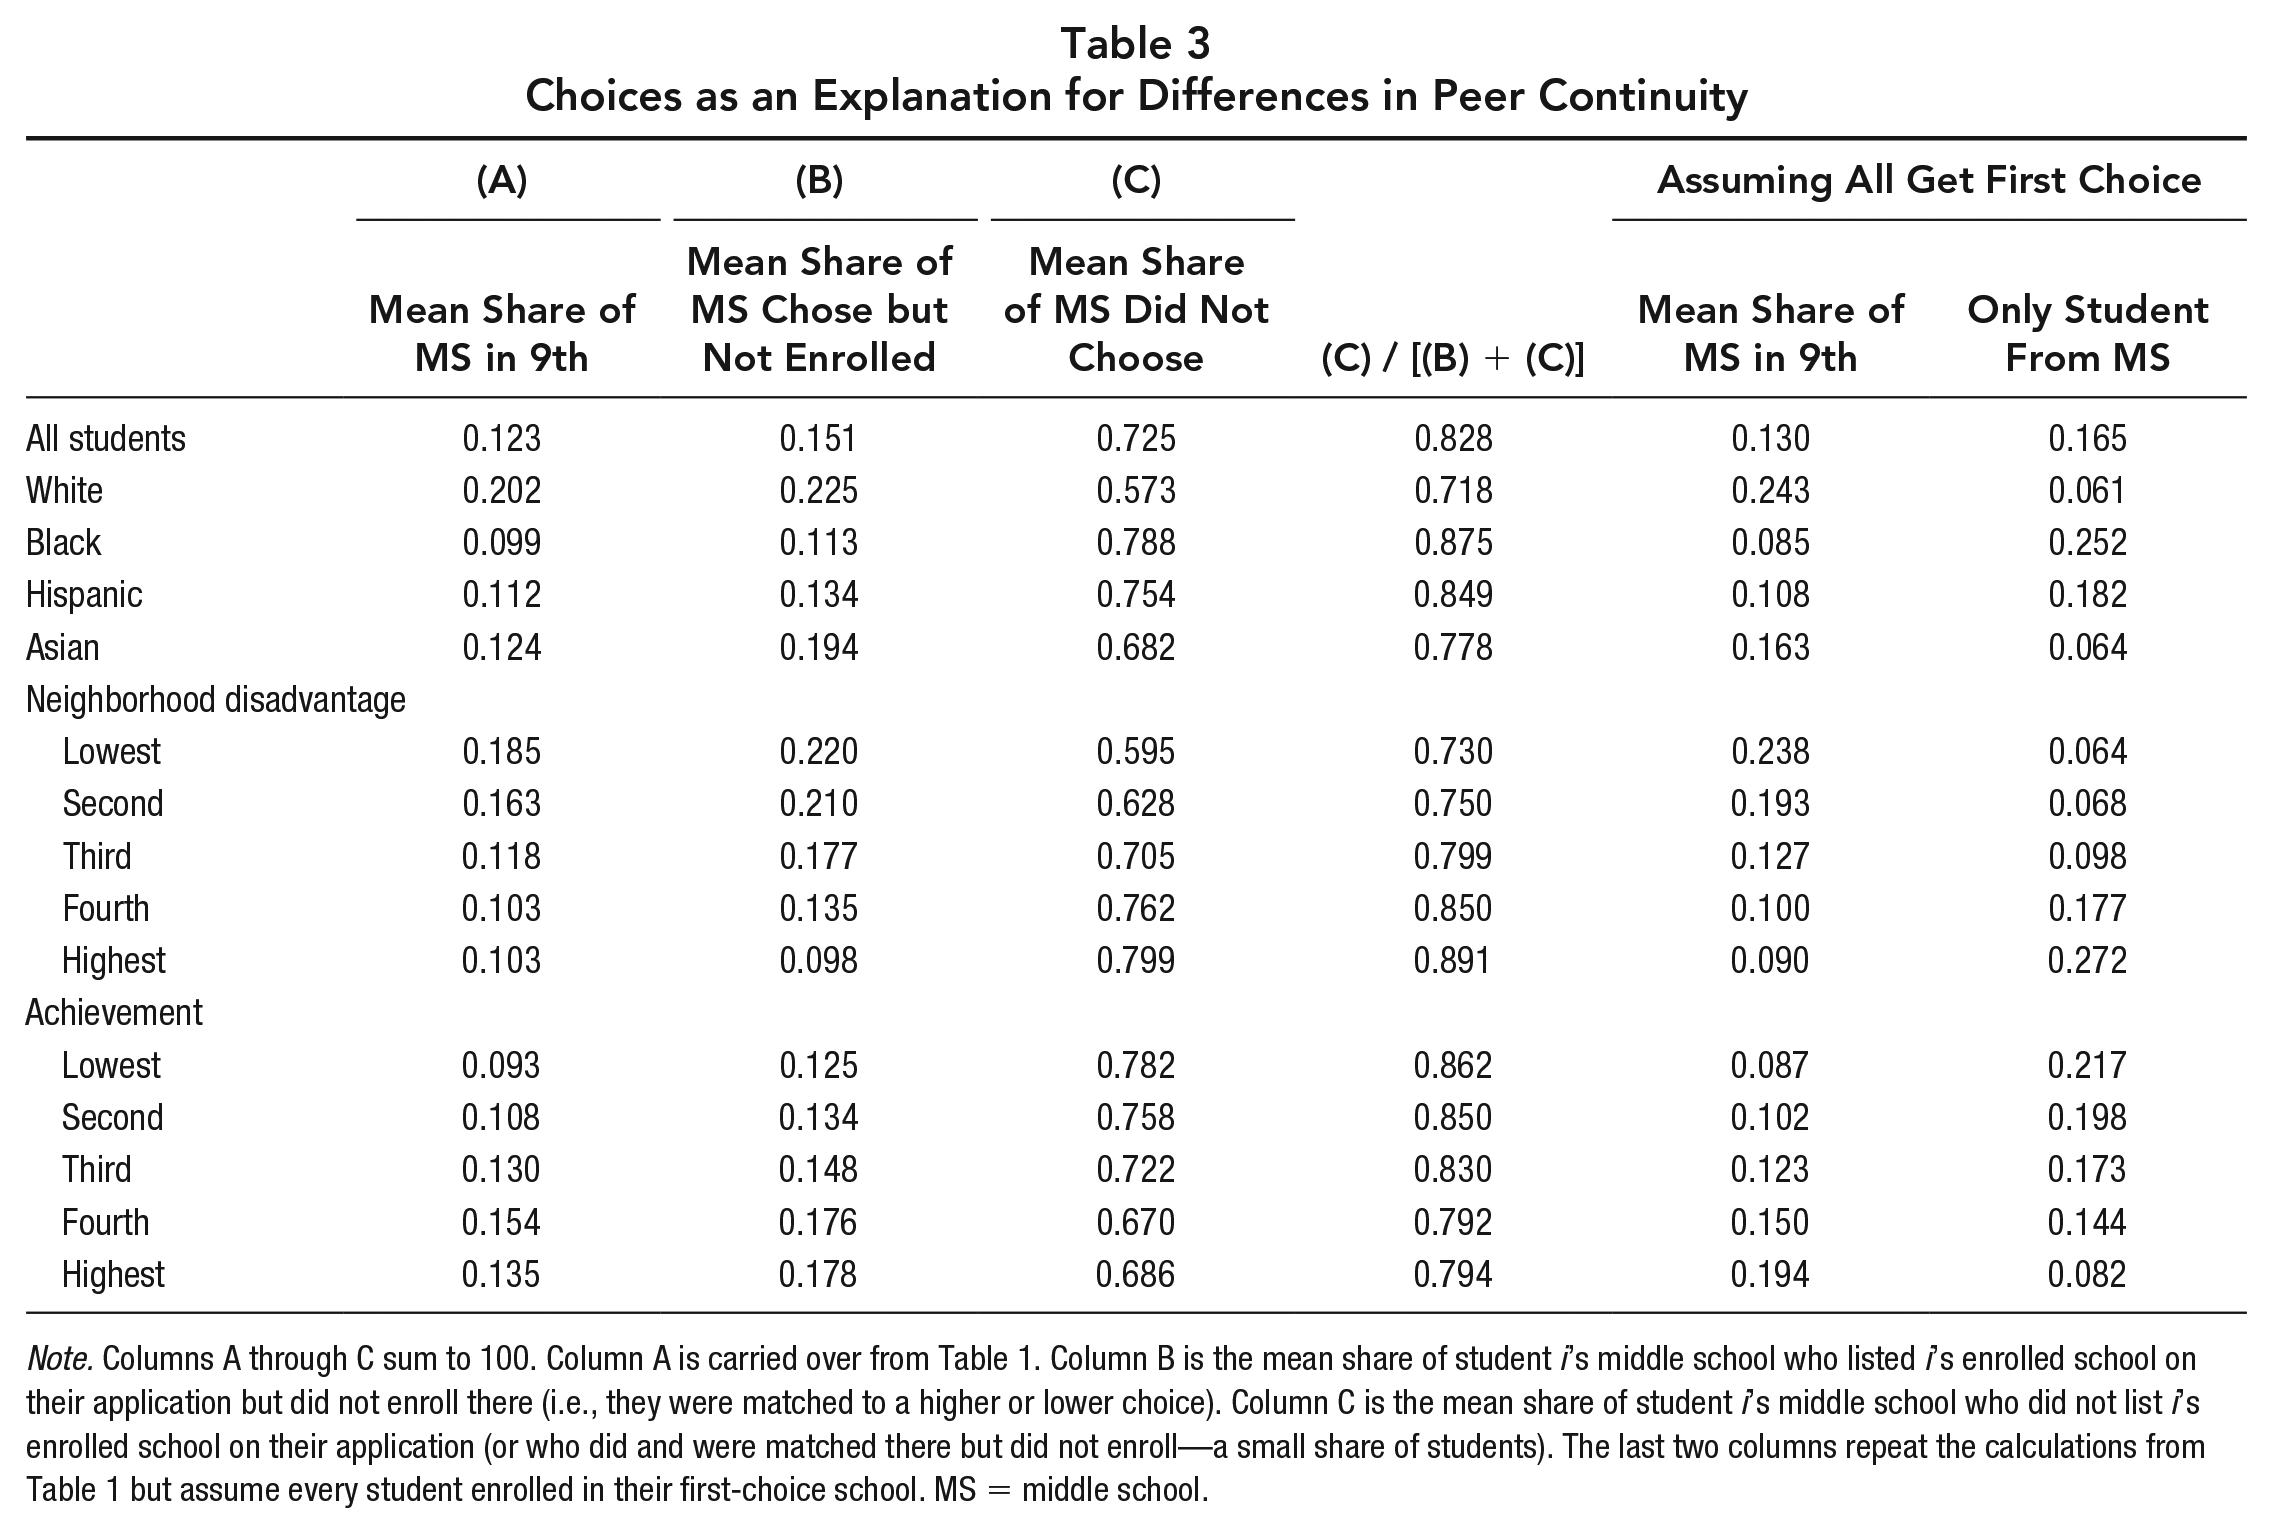
Note. Columns A through C sum to 100. Column A is carried over from Table 1. Column B is the mean share of student i’s middle school who listed i’s enrolled school on their application but did not enroll there (i.e., they were matched to a higher or lower choice). Column C is the mean share of student i’s middle school who did not list i’s enrolled school on their application (or who did and were matched there but did not enroll—a small share of students). The last two columns repeat the calculations from Table 1 but assume every student enrolled in their first-choice school. MS = middle school.
Second, we recalculated mean peer continuity and isolation assuming all students enrolled in their first-choice school (rightmost columns of Table 3). Peer continuity would be higher overall if students enrolled in their first choice, but the difference is small, especially for the share measure (0.130 vs. 0.123 for the full sample). About one in six students (16.5%) would be the only student in their ninth-grade class from their middle school, compared to 18.2% in practice. Gaps in peer continuity by race, neighborhood disadvantage, and achievement are generally higher, not lower, under this scenario. Interestingly, White and Asian students end up enrolling in schools where they experience less peer continuity than “desired” (as evidenced by their first choices), while Black and Hispanic students enroll in schools where they experience more. A similar pattern holds by quintiles of neighborhood disadvantage and achievement.
Finally, we used regression to examine the extent to which gaps in peer continuity and isolation are “explained” by application similarity. (Similarity enters the regression as a quadratic, as suggested by Figure 1.) The first two panels in Figures 2 and 3 show how raw gaps by race/ethnicity and neighborhood poverty, respectively, are reduced when adjusting for differences in similarity. Gaps in the continuous measure of peer continuity largely disappear when adjusting for differences in application similarity. For example, assuming all students have mean Top3 similarity, Black-White and Hispanic-White gaps in peer continuity become small and statistically insignificant. Gaps in isolation are cut in half but remain sizable at 10.4 and 4.7 percentage points.
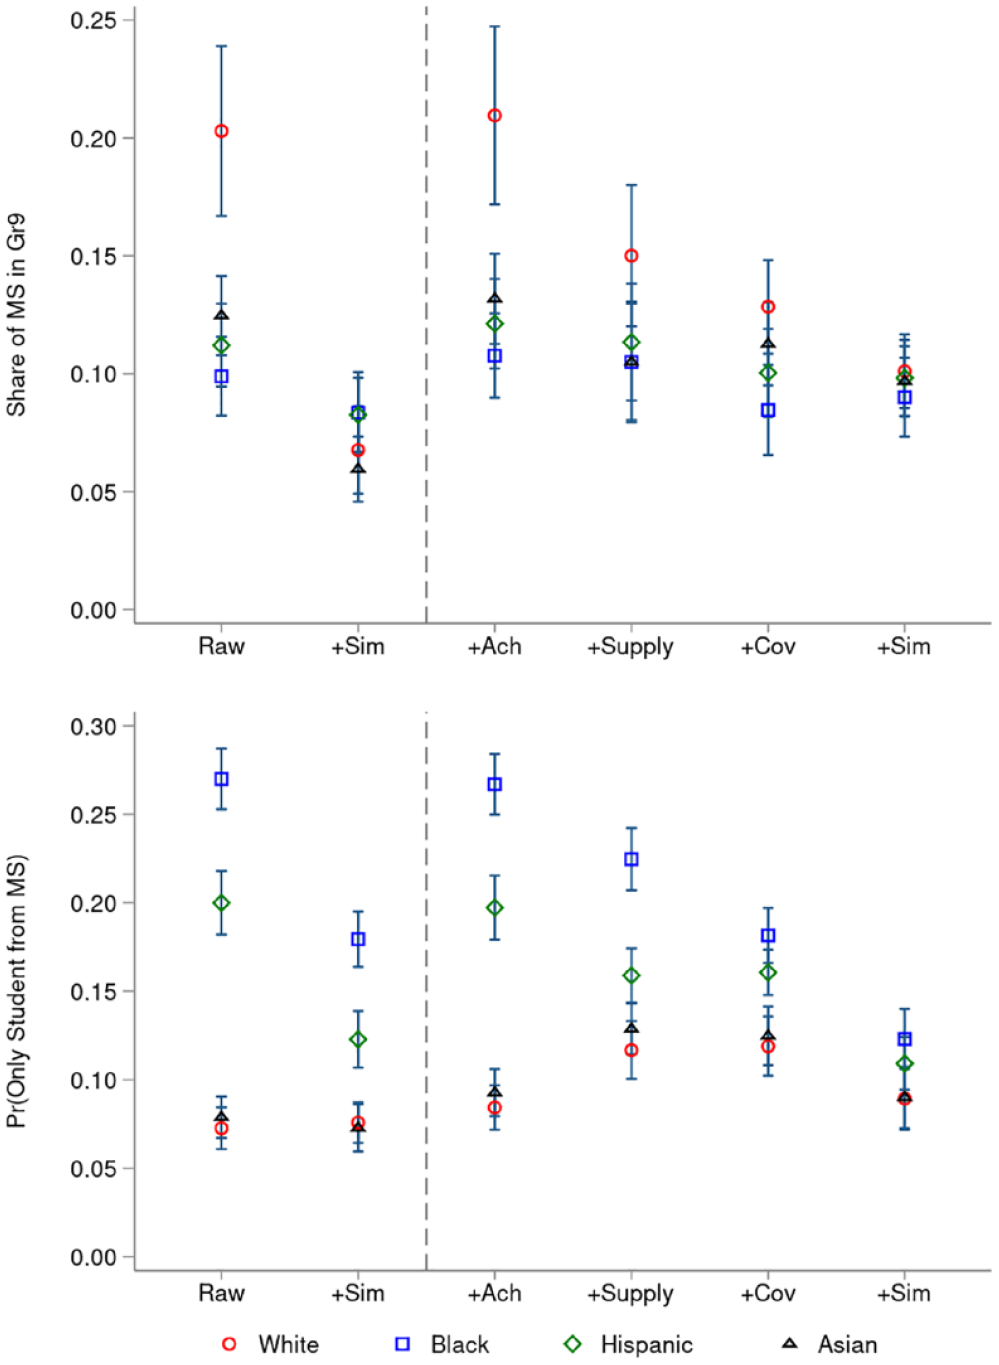
Regression-adjusted predictions of peer continuity/isolation by race/ethnicity.
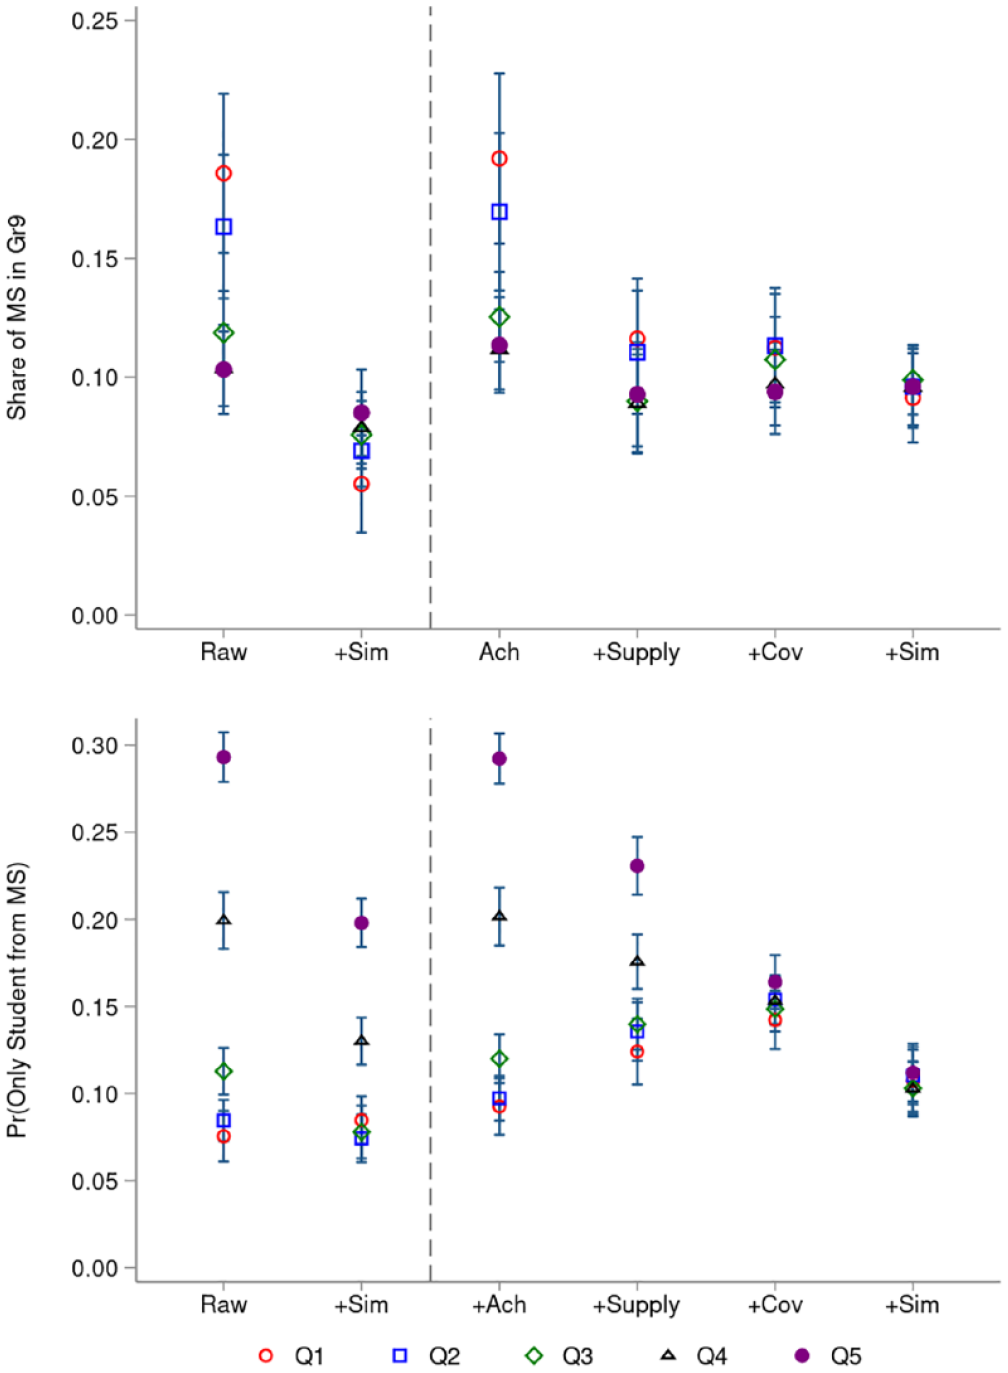
Regression-adjusted predictions of peer continuity/isolation: by tract disadvantage.
Other Predictors of Peer Continuity
Adjusting for choice similarity has intuitively large effects on gaps in peer continuity because students who apply to the same schools are—all else equal—more likely to attend together. This implies that individual and contextual factors that lead students to make more or less similar choices have a strong effect on peer continuity. For the next three panels in Figures 2 and 3, we remove Top3 from the regression and consider other predictors of peer continuity. All coefficients and standard errors are reported in Appendix Tables 5 and 6 (available on the journal website).
In the third panel of Figures 2 and 3, we adjust only for seventh-grade test scores, which influence both where students apply and their likelihood of admission to those schools. Perhaps surprisingly, this has little effect on predicted gaps by race and neighborhood poverty, and the marginal effect of a 1 SD increase in achievement on peer continuity is small. Raw gaps in peer continuity observed in Table 1 do not appear to be strongly related to prior achievement.
In the fourth panel of Figures 2 and 3, we further adjust for differences in local school supply, measured using the number of schools, mean ninth-grade cohort size, and mean demand (applications per seat) for schools within 3.5 miles of student i’s census tract. 7 (Each enters the regression as a quadratic.) In this case, assuming students have equal school supply by these measures has a large effect on predicted gaps in peer continuity, cutting gaps by half or more. For example, a 1 SD increase in the number of high schools within 3.5 miles (about 38 schools) is associated with a 4.8 percentage point increase in the likelihood of being isolated in ninth grade. This suggests the local supply of school options has an important effect on students’ propensity to make similar choices and experience peer continuity.
In the fifth panel of Figures 2 and 3, we adjust for the full set of student and other covariates described earlier and report predicted margins at the sample means of these covariates. (For the margins by race, we hold the distribution across quintiles of neighborhood disadvantage constant and vice versa.) Doing so further reduces gaps in peer continuity by race and neighborhood poverty, although not to the same extent as adjusting for measures of school supply.
Regression coefficients in Appendix Tables 5 and 6 (available on the journal website) point to other factors associated with peer continuity. For example, students with the option to remain in their school experienced substantially greater peer continuity, attending ninth grade with a 41 percentage point higher share of their cohort (p = .026), and had a 12 percentage point lower likelihood of isolation (p = .011). Students who enrolled in a specialized high school attended ninth grade with 8 to 10 percentage point fewer middle school peers, on average (p < .05). Students who attended a middle school with fewer own-neighborhood peers experienced less peer continuity, and students who were isolated in middle school were, on average, 5.5 percentage points (p = .006) more likely to be isolated in ninth grade. Students from larger cohorts were less likely to be isolated in ninth grade, and those who listed high-demand schools in their top three were more so.
The rightmost panel of Figures 2 and 3 brings the Top3 measure back to the regression and shows that adjusting for similarity—together with the other covariates—renders most gaps in peer continuity insignificant, suggesting these residual differences are captured by “unexplained” choice dissimilarity. A deeper understanding of contextual factors that lead to dissimilarity in school choices would be a productive area for future research.
Discussion
This article documents middle to high school peer continuity in the context of a large urban school district with school choice and examines its variability across student populations. We find peer continuity from middle to high school to be quite low in NYC, with large disparities by race, neighborhood disadvantage, and prior achievement. Often, NYC students transition from middle to high school with none of their eighth-grade peers.
We also explored potential explanations for disparities in peer continuity. In NYC, group differences appear to be driven largely by choices, not differences in the probability of admission or enrollment behavior; peer continuity would vary by social background even if all students received their top choice.
It is less clear why peer choice similarity varies by social background, but the answer appears related to features of the local choice landscape. In NYC, traditionally disadvantaged groups have more (and smaller) school options within a short commuting distance from home (Corcoran, 2018), creating more opportunities for separation. NYC also has a middle school choice process that clusters students with similar interests and academic performance. This process may have its own effects on sorting, leading to later differences in high school choice similarity. Our results suggest that proximate school supply is important in statistically explaining gaps in peer continuity.
Demand-side factors may also play a role. Access to and use of information vary across contexts and by socioeconomic background (Corcoran & Jennings, 2019), as do school counseling practices related to school choice (Sattin-Bajaj et al., 2018). These may produce systematic differences in choice coherence and coordination within middle schools. Preferences for peer continuity may also vary, and in some cases, families may purposefully seek out a different peer group than the one in their current school or neighborhood. Indeed, some research has found disadvantaged students are more likely to benefit from the “fresh start” that changes in peer contexts provide (Weiss & Bearman, 2007). In our data, Black and Hispanic students would have experienced even less peer continuity had they received their first choice, while White and Asian students would have experienced more. (Of course, first-choice schools differ in other respects, such as academic performance and selectivity.)
Our findings provide little support for coordination between same-school peers in high school applications, particularly among traditionally disadvantaged populations. While perhaps surprising, it is consistent with results of a student survey we conducted in 29 high-poverty NYC middle schools in 2015. 8 In that survey, friends’ intentions to attend a school ranked 16th out of 18 school characteristics in terms of importance. Friends ranked lowest among interpersonal influences on school choices, behind parents, counselors, teachers, and siblings. Notably, Sartain and Barrow (2022) found very consistent results in their survey of Chicago high school applicants.
Because school districts control the enrollment policy, the number and variety of options available, and the conditions under which students make school choices, it is worthwhile to understand whether and how choice policies contribute to divergent childhood social contexts. Future research can help fill this gap in several respects. First, we need to know more about the consequences of variation in peer continuity like those documented here. Recent evidence shows that the disruption of friendships and peer networks during school transitions can lead to social isolation and academic difficulties (A. D. Benner, 2011; A. D. Benner et al., 2017; Felmlee et al., 2018; Stein et al., 2021). The extent to which these effects are unevenly distributed across groups is crucial for understanding the full impacts of school choice systems for students and their communities.
Second, better evidence is needed on factors explaining variability in choice similarity within and between districts. This could include research with quasi-experimental designs that takes advantage of variation across locations and/or over time to identify the effects of school choice systems that affect choice similarity. New data collections from students and families on the influence and importance of peers in school choices would also be valuable.
The expansion of school choice has been concentrated in historically disadvantaged communities, and we find that even within those communities, disadvantaged families experience far lower peer continuity than more advantaged families. The effects of choice systems on peer continuity and any cascading effects on students and their communities are thus likely to be highly unequal. More research is necessary to understand how peer continuity is produced and how it matters for social and academic outcomes.
Supplemental Material
sj-pdf-1-edr-10.3102_0013189X231184185 – Supplemental material for Choosing Alone? Peer Continuity Disparities in Choice-Based Enrollment Systems
Supplemental material, sj-pdf-1-edr-10.3102_0013189X231184185 for Choosing Alone? Peer Continuity Disparities in Choice-Based Enrollment Systems by Nicholas D. E. Mark, Sean P. Corcoran and Jennifer L. Jennings in Educational Researcher
Footnotes
Acknowledgements
We would like to thank the New York City Department of Education, James Kemple, and the Research Alliance for New York City Schools for providing access to the data required for this study. We benefited greatly from feedback from Carolyn Sattin-Bajaj, Lauren Covelli, conference participants at the 2019 Association for Education Finance and Policy Annual Conference, and research staff members at the New York City Department of Education.
Notes
Authors
References
Supplementary Material
Please find the following supplemental material available below.
For Open Access articles published under a Creative Commons License, all supplemental material carries the same license as the article it is associated with.
For non-Open Access articles published, all supplemental material carries a non-exclusive license, and permission requests for re-use of supplemental material or any part of supplemental material shall be sent directly to the copyright owner as specified in the copyright notice associated with the article.