
Abstract
A recent article calculates new benchmarks from the distribution of effect sizes in a dataset, without accounting for signed values or sampling appropriately. In addition, the focus-narrowing approach it takes does little to address the issues highlighted about the value of effect size for policy.
Power analysis may have been the most constructive influence Cohen had in his distinguished career (Cohen, 1962). However, calling its standardized mean difference component “effect size” (ES) may have been the most damaging. The recent article, “Interpreting Effect Sizes of Education Interventions” (hereafter IESEI), synthesizes work on how studies’ contextual features impact ES (Kraft, 2020). Ceteris paribus, ES is larger for more homogenous samples, more proximal measures or less effective comparisons (Simpson, 2017). “Effect size” is thus a misnomer: It does not measure the size of effects in a way suitable for policy.
Two approaches have been taken to this problem; arguing ES still measures policy effectiveness provided
ESs are adjusted for design differences (Adjustment: see Hunter & Schmidt, 2004).
Only studies with common features are compared (Focus-narrowing: e.g., excluding studies with researcher-designed tests, Cheung & Slavin, 2016).
IESEI takes the second approach to the question “How large is the effect relative to other studies with broadly comparable features?” (p. 247). This raises both a technical issue about calculating benchmarks and a theoretical issue about whether, even with appropriately calculated benchmarks, ES can ever be useful for policy decisions.
Calculating Benchmarks
Alongside cost and scalability metrics, IESEI develops new benchmarks for small, medium, and large ES from terciles of the distribution of ESs from existing datasets.
It can be reasonable to determine rules of thumb for classifying items using an existing distribution. For example, from windspeeds recorded from the angle of a windsock, an air traffic controller might want to categorise gusts of wind across the runway to distinguish breezes, gales, and hurricanes. However, two issues arise: (1) sign and (2) sampling:
If sign is not accounted for, gusts from the left and right of the runway cancel out in calculations of distribution subdivision points, reducing them or even resulting in them having different signs. From the point of view of the pilot, gust direction is important, but strong rightward gusts are still strong gusts, not gentle leftward breezes.
Windsocks are designed to capture wind movement as it matters for pilots: directions of very light air movements cannot be reliably determined, nor distinguished from zero. Recording essentially random movements of a flaccid windsock—even for air movements caused by passing birds and insects—as if they reliably represented gusts of given speed and direction would severely attenuate the distribution of gusts. Benchmarks set as terciles of that distribution could then classify the lightest of breaths as gales or hurricanes.
IESEI aims to classify ESs “relative to the empirical distribution of effects from specific classes of studies and outcome domains” (p. 251) but includes signs and uses unrestricted sampling.
Randomized controlled trials of the type in the dataset are normally symmetrical with respect to treatment. Few trials in IESEI’s dataset could be described as comparing the status quo with the status quo plus an additional action 1 : in most cases, both groups receive alternative treatment or have opportunities unavailable to the other. So, an ES of -x on treatments A versus B is an ES of x for B versus A for the same outcome. For example, the Institute of Education Sciences (IES) subset of IESEI’s dataset includes both the ES = .17 for Saxon against Scott-Foresman maths curricula and ES = −.17 for Scott-Foresman against Saxon, from the same study (Agodini & Harris, 2010).
Unless calculations use absolute ES, benchmark divisions will be reduced. They may even have different signs, rendering benchmark regions uninterpretable: had IESEI used only the IES subset, the terciles would have been −.05 and +.05, leading to Agodini and Harris’s study ES being classed as small one way and large the other. Bizarrely, ES = 0 would be classed as medium.
In terms of sampling, IESEI is clear in its aim to create benchmarks for effects. Cohen describes ES as “the degree to which the null hypothesis is false” (Cohen, 1988, pp. 9–10). Making a claim of a particular ES presupposes a reliable claim of an effect. Without such warrant, standardized mean difference cannot distinguish any effect of difference in treatments from group allocation effects, even in an ideal randomized controlled trial. IESEI accepts “education interventions often result in no effect” (p. 241), yet includes many “no effects” in the distribution.
Distinguishing “effect” from “no effect” is controversial (Mayo, 2018). Power analysis and almost all IESEI’s studies come from frequentist traditions, so one might define “effect” (and restrict sampling) using statistical significance. Alternatively, one might exclude results when evidence favors the null (e.g., Dienes & Mclatchie, 2018).
However it is achieved, both construction and use of benchmarks should involve only “effects” reliably distinguished from “no effect.” For example, it is difficult to argue ES = .08 from Fabiano et al.’s (2010) report card intervention study should be included as an effect: The authors concluded “no observed benefit of the intervention” (p. 233) given p = .61; the 95% confidence interval [−.42, .60] shows the data are consistent with a broad range of positive, negative and zero ESs; and evidence favors the null (Bayes factor = .42). IESEI not only includes it but also declares it a medium ES.
Including studies without reliable effect claims severely attenuates the distribution—IESEI’s distribution is extremely leptokurtic (
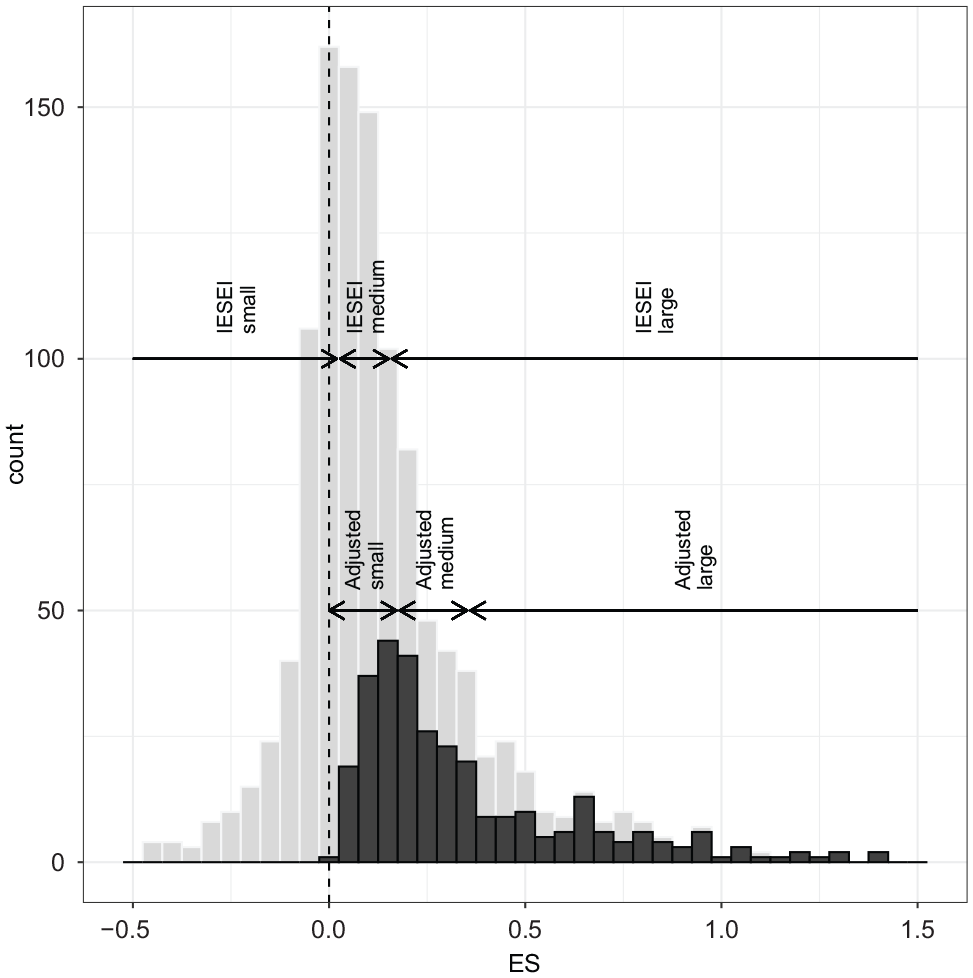
Distribution of effect sizes (ESs).
Focus-Narrowing as a Strategy
Despite highlighting many influences on ES—including alignment between outcome measure and treatments, measurement timing, measure reliability, sample targeting, and inclusion criteria—IESEI uses only two in narrowing focus: excluding correlational studies and restricting to standardized tests.
As with all focus-narrowing approaches, this leaves other features open. Otherwise identical studies can have “large” or “small” ES depending on the homogeneity and targeting of the sample, choice of comparison treatment, timing of measurement, and so on. Moreover, narrowing to standardized tests still leaves considerable freedom. A difference in treatments affecting only, say, fraction addition, could have a “large,” “medium,” or “small” ES depending on whether the standardized test measures fraction addition, fraction arithmetic, or general mathematics. Focus-narrowing approaches work only when focused so tightly that design features are effectively identical.
While, theoretically, adjustment approaches could make interventions comparable using ES, Hunter and Schmidt (2004) note that it is rarely possible to know enough about two pieces of research to make such adjustments.
So, despite Cohen’s nomenclature, “effect size” does not measure the size of an effect as needed for policy. Lipsey (1998) suggests thinking of it like a signal-to-noise ratio: higher because the signal is boosted or noise reduced; neither affecting signal content. Choice of sample, comparison treatment and measure can impact ES; at the extreme, educationally trivial interventions can have infinite ES (Simpson, 2019).
By resetting benchmarks—which are set too low as a result of sign and sampling issues—IESEI avoids addressing the danger in Cohen’s misnomer. It permits rhetorically strong but misleading claims about pedagogical importance, when all some researchers discover are weak signals against noisy backgrounds.
Supplemental Material
sj-pdf-1-edr-10.3102_0013189X20985448 – Supplemental material for Benchmarking a Misnomer: A Note on “Interpreting Effect Sizes in Education Interventions”
Supplemental material, sj-pdf-1-edr-10.3102_0013189X20985448 for Benchmarking a Misnomer: A Note on “Interpreting Effect Sizes in Education Interventions” by Adrian Simpson in Educational Researcher
Footnotes
Notes
References
Supplementary Material
Please find the following supplemental material available below.
For Open Access articles published under a Creative Commons License, all supplemental material carries the same license as the article it is associated with.
For non-Open Access articles published, all supplemental material carries a non-exclusive license, and permission requests for re-use of supplemental material or any part of supplemental material shall be sent directly to the copyright owner as specified in the copyright notice associated with the article.