
Abstract
A host of recent literature suggests benefits to Black children of being matched to same-race teachers. We extend this literature to explore whether being matched to a Black teacher is related to Black students’ likelihood of being identified for two types of discretionary educational services in the following academic year: gifted education and special education. While we do not find that access to Black teachers affects students’ likelihood of gifted identification, Black students matched to Black teachers are less likely to be identified for special education. The results are strongest for Black boys, particularly those who are also economically disadvantaged and are strongest for disabilities with more discretion in identification.
One of the most persistent problems in U.S. education policy has been the inequality in achievement and attainment outcomes for children from different race/ethnic groups. Compared to their White or Asian peers, Black and Hispanic 1 students have lower test scores on average (Hanushek et al., 2020; National Assessment of Educational Progress, 2022; Reardon, 2011). More importantly, these students also have lower rates of educational attainment, such as high school graduation and college enrollment (Ma et al., 2016; Murnane, 2013).
A substantial body of literature has traced the ways that these gaps emerge over time. One set of studies has focused on differences between the discretionary educational settings that Black and White children are exposed to—in particular, the differential rates of identification of Black and White children for gifted programs and for special education services (which we call, together, “discretionary educational services”). Relative to White children, Black students are under-represented in gifted programs (Office of Civil Rights [OCR], 2020a, 2020b). This is problematic because several studies have found that gifted program participation is associated with better short-run and longer-run academic outcomes (Bhatt, 2009; Card & Giuliano, 2016), although other studies have found null effects (Bui et al., 2014). Some recent quasi-experimental evidence has shown that benefits to gifted identification are larger for low-income and Black and Hispanic students (Card & Giuliano, 2016, but see Redding & Grissom, 2021).
A parallel set of literature has explored whether racially minoritized students are disproportionately represented in special education (Artiles, 2019; Waitoller et al., 2010). The findings in this literature have been mixed. Multiple studies have found that students of color are more likely to be identified with disabilities than other students (Cruz et al., 2021; Skiba et al., 2008), particularly in more subjective disability categories such as emotional disturbances (Bal et al., 2019; Donovan & Cross, 2002). Other scholars have found that Black students may be under-identified for some disability categories when predictors like test scores or economic and health indicators are taken into account (Elder et al., 2021; Hibel et al., 2010; Morgan et al., 2015), though these conclusions have received significant pushback (Collins et al., 2016; Skiba et al., 2016). While there are ongoing debates as to which comparisons are most appropriate to understand representation in special education (Ahram et al., 2021; Cruz & Rodl, 2018), it is useful from a policy perspective to distinguish factors that contribute to special education identification. This imperative is particularly urgent for disabilities (such as learning disabilities) that generally rely on teacher or administrator discretion (rather than medical practitioners’ judgment) for initial referrals and identification, as these disabilities may be most prone to subjectivity and, ultimately, misclassification (Donovan & Cross, 2002).
At the same time, a second body of work has emerged in recent years looking at the effects of exposure to same-race teachers on students’ schooling outcomes. Compared to White peers, Black students have lower probability of being taught by race-congruent teachers (Lindsay et al., 2017). Roughly 7% of teachers are Black nationwide (U.S. Department of Education, n.d.), compared to 15% of students (U.S. Department of Education, 2022). This is problematic because past literature has suggested that Black teachers hold higher expectations for Black students (Gershenson et al., 2016) and are associated with better outcomes for those students, including performance on tests, discipline, attendance, and even high school graduation and college enrollment (Dee, 2004; Gershenson et al., 2022; Holt & Gershenson, 2019; Lindsay & Hart, 2017; Shirrell et al., forthcoming).
Building on these two strands of literature, this study explored whether access to same-race teachers was associated with the likelihood that Black children entered gifted programs or special education services. Drawing on a sample of North Carolina students from 2007–08 to 2012–13, we built on past research on this question using stronger quasi-experimental techniques to extract more plausibly causal estimates of this relationship. We harnessed a large, detailed dataset that identified the types of disabilities for which students were served (e.g., specific learning disability, autism, etc.) to determine whether any effects of exposure to Black teachers came primarily through disabilities subject to more discretion in identification of the disability. We also explored heterogeneity in effects of exposure to Black teachers, looking at differences by student characteristics (like socioeconomic status, sex, and student grade) as well as school characteristics (e.g., school demographic composition).
North Carolina is an ideal site to study this question. North Carolina mirrored national trends in that Black students were under-represented in gifted programs (6% of Black fifth graders were in gifted programs in 2012, compared to 23% of their White peers) and over-represented in special education programs (17% of Black fifth graders, compared to 13% of White fifth graders; authors’ calculations, available on request). Unlike many states, North Carolina also had a sufficiently large share of Black students and Black teachers to offer the variation in access to Black teachers needed to answer our research questions: roughly 15% of teachers in North Carolina were Black in 2017–18 compared to 7% nationally (U.S. Department of Education, n.d.). Notwithstanding its relatively large share of Black teachers, North Carolina also mirrored the nation in that a far smaller share of its teachers were Black relative to the share of its students who were Black (24%; Lindsay et al., 2017).
We found that exposure to Black teachers was not related to the probability of gifted identification for Black students, on average. However, Black students matched to Black teachers had a reduced likelihood of being newly identified with disabilities. This relationship was especially pronounced for Black boys, particularly those who were economically disadvantaged. We also found that this relationship was stronger for disability categories, such as specific learning disabilities, that had a more discretionary component in their identification.
Literature Review
Gifted Identification
A long line of literature has suggested that Black students are identified for gifted programs at lower rates than their White or Asian peers (Ford, 1998; McBee, 2006; Pearman & McGee, 2022; Wright et al., 2021). These trends have persisted over time, and the most recent data available from the US Department of Education's Office of Civil Rights (from 2017–18) showed that Black and Hispanic students comprised 8.9% and 16.8% of students in gifted and talented programs (OCR, 2020a), respectively, compared to 15.5% and 27.2% of the general population of public school students (OCR, 2020b). White and Asian students were both over-represented in gifted programs relative to their representation in the general student population.
Education advocates and researchers worry that these disparities may be partly driven by identification processes that are subjective (Lakin, 2016). While a growing number of states and districts are adopting universal screening to identify gifted children—over 50% of districts in a recent survey of district gifted coordinators (Callahan et al., 2017)—historically, students have often been tested for gifted programs based in part on teacher recommendations (McBee, 2006). For instance, McClain and Pfeiffer (2012) found that roughly a quarter of states required schools to consider nominations for gifted programs (e.g., from teachers) in their gifted identification processes. At the district level, a national survey conducted during the time period covered by this analysis found that 86.5% of districts nationwide relied on teacher recommendations for at least part of their identification of gifted children, whereas 80.5% factored in parent nominations (Callahan et al., 2013, cited in Lakin, 2016; see Callahan et al., 2017, for an updated version with less specificity in precise figures). This is potentially concerning as teacher recommendations may be subject to bias based on student background characteristics (Elhoweris et al., 2005). For instance, a recent study demonstrated that racial disparities in access to gifted education were more pronounced in counties with higher rates of anti-Black bias (Pearman & McGee, 2022).
We posited that the lower likelihood that Black students would encounter same-race teachers may partially drive the disparity in identification to the extent that Black teachers are more likely to recognize Black students as gifted. Past literature provides evidence that this may be true (Gershenson et al., 2021). For instance, Black teachers tend to hold higher expectations of Black students than do White teachers evaluating the same child (Gershenson et al., 2016) and rate Black students higher on noncognitive skills such as being attentive, completing homework on time, and being nondisruptive (Dee, 2005). Black teachers may also be more likely to use teaching practices—such as culturally relevant or culturally sustaining pedagogical practices (Ladson-Billings, 2009; Paris & Alim, 2014)—that may promote success for Black students, and they may be especially devoted to building Black students’ aspirations (Siddle Walker, 1996). Recent studies show that Black students matched to Black teachers see boosts in academic achievement (Dee, 2004; Egalite et al., 2015). These findings suggest that teacher race match may matter for how students are evaluated and viewed by the teachers; if teacher evaluations are a major channel for gifted identification, Black students may be less likely to be identified for services partially due to their lower rates of access to race-congruent teachers.
Special Education Identification
The relationship between student demographic characteristics and identification for special education services has received a tremendous amount of attention from researchers. One of the most influential reports in this vein, by a committee convened by the National Research Council to study minority representation in special education, used data from the Office of Civil Rights and the Office of Special Education Programs to characterize the representation of students from different race/ethnicity groups across a number of special education categories (Donovan & Cross, 2002). This study found particular over-representation of Black children in the categories of intellectual disabilities 2 and emotional disturbances (Donovan & Cross, 2002); other studies have echoed this finding and found disproportionate representation for Black children identified with learning disabilities as well (Zhang & Katsiyannis, 2002; Zhang et al., 2014).
However, these differential identification rates may depend on study approaches, such as whether researchers adjust for covariates associated with race (Ahram et al., 2021; Cruz & Rodl, 2018; Morgan et al., 2017). For instance, while some studies have found that racial differences in disability identification—particularly for intellectual and learning disabilities—remained even when students were compared to those of similar socioeconomic status (Grindal et al., 2019), others have found that race gaps in some types of special education services were partially (Sullivan & Bal, 2013) or fully (Shifrer et al., 2011) mediated by socioeconomic factors. Similarly, studies using the ECLS-K have found that Black, Hispanic, and Asian students are identified for services less frequently than White students after controlling for characteristics such as kindergarten test scores that are correlated with socioeconomic status (SES) (Hibel et al., 2010; Morgan et al., 2015). While some other scholars have criticized the assumption that SES or correlated factors should be controlled in these cases (Cruz & Rodl, 2018; Skiba et al., 2016), this debate raises important interpretive complexities for our study.
Other ecological factors related to students’ environments may shape racial patterns in identification with disabilities as well. At the microsystem level, Hibel et al. (2010) found that special education identification rates were lower in schools with higher concentrations of minoritized students; this pattern largely explained the under-representation of Black students in special education after controlling for student-level factors.
Other studies have shown that the racial composition of schools matters for special education identification as well. Elder et al. (2021) found that Black students were under-identified for special education services compared to White students with similar observable economic and health characteristics if they attended schools with relatively high concentrations of under-represented minority students. However, if they were in predominantly White schools, Black students were over-identified for special education relative to observably similar White students. Fish (2019a) further explored the interplay between disability classification and segregation and found that as the school-level proportion of White students rose, the risk of “lower-status” disability identification increased for students of color, including those diagnoses where subjectivity plays a larger role in the identification. Fish defined “lower status” disabilities as those that lead to a greater chance of exclusion from the classroom and reduced student access to grade-level content. Additional work on schools as racialized organizations has demonstrated the role that school practices play in disproportionate representation in special education services (Kramarczuk Voulgarides et al., 2021). Taken together, this set of studies suggests the role of contextual factors in affecting racial patterns of identification for special education services.
Teacher race may be one such contextual factor. Teacher race congruence may affect special education identification for Black children through similar channels to gifted identification. For instance, if Black teachers are less likely to experience cultural mismatches with and hold deficit-oriented conceptions of Black students, this may reduce their odds of referring Black students for special education evaluation (Ahram et al., 2011; Hart et al., 2010; Tefera et al., 2013). In addition, because Black teachers are associated with improved performance for Black children (Dee, 2004; Egalite et al., 2015), this improvement in performance and successful engagement in classwork may translate to a lower likelihood of referrals as well.
Researchers typically argue that racial disproportionalities in special education are problematic; however, the effects of special education on student outcomes generally is a point of some controversy. On the one hand, receiving special education services may be beneficial to students to the extent that students genuinely need those services to keep up with peers academically. On the other hand, some scholars have argued that special education use stigmatizes children (Shifrer, 2013) and can cause them harm, even as it is intended to serve protective functions (Artiles et al., 2016). Absent convincing evidence of benefits to special education, educators should consider such potential harms when identifying students for services. Evidence on this question is mixed; some researchers have reported benefits to identification, especially in math (Ballis & Heath, 2021a; Hanushek et al., 2002). Some have found null or negative effects (Morgan et al., 2010), while other studies have found that benefits differ based on the subject or the grade at which students were identified for services (Kvande et al., 2019). 3 Schwartz et al. (2021) also studied race as a moderating factor. While they found overall benefits to special education services on math and reading scores, these effects were much smaller—near zero—for Black students. In light of the disproportionate assignment of Black children to special education, the authors noted that one plausible explanation of this finding may be over-identification for this group (p. 505).
Relatively few papers have studied the effects of racial disproportionality in special education per se on student outcomes. However, a recent working paper used quasi-experimental methods to leverage the imposition of a policy intended to address over-representation of Black students in special education to uncover causal effects (Ballis & Heath, 2021b). This paper found that reducing over-representation of Black students in special education was associated with improvements in long-run outcomes like high school graduation and college attainment for Black students, suggesting benefits to interventions—such as caps on disproportionate enrollment—that target over-representation in special education for this group. Our paper explored whether access to Black teachers may act as such an intervention.
The Impacts of Being Taught by a Same-Race Teacher
A growing body of literature has demonstrated both the short and long-run impacts of access to same-race teachers (Bristol & Martin-Fernandez, 2019; Redding, 2019). Researchers have found positive impacts of teacher-student ethnoracial congruence on a host of short-term outcomes, such as test scores (Dee, 2004; Egalite et al., 2015), exposure to exclusionary discipline practices (Lindsay & Hart, 2017; Shirrell et al., forthcoming), and behavioral outcomes such as absences (Gottfried et al., 2022; Holt & Gershenson, 2019). Teacher-student racial congruence also matters for long-term outcomes: having a same-race teacher in the early grades is associated with decreased rates of high school dropout and increased rates of college matriculation for Black students (Gershenson et al., 2022). These results are driven largely by the outsized impacts of these matches for Black boys, particularly by boys who are defined as economically disadvantaged over the course of their elementary and middle school years. The lack of diversity and racial representation among teachers continues to be a national policy challenge, as the teaching workforce is nearly eighty percent White (Lindsay et al., 2017), while the student population is only about 50% White.
While the impacts of Black teachers on Black students’ test and disciplinary outcomes is relatively well established, only a handful of articles have looked at how teacher race is related to identification of discretionary programs, such as gifted education or special education. Rocha & Hawes (2009), Grissom & Redding (2016), Grissom et al. (2017), and Nicholson-Crotty et al. (2016) used nationally representative data to explore how access to Black teachers related to identification for gifted services. They found that Black students with lower exposure to Black teachers were less likely to be identified for gifted programs. However, these studies could not control for cross-school differences in gifted identification using school fixed effects; our analysis using statewide administrative data did permit the inclusion of school fixed effects.
Similarly, the literature linking teacher race to special education identification is sparse. 4 One of the earliest studies in this vein (Rocha & Hawes, 2009) used national data and found less over-representation of Black students with diagnoses of mild intellectual disability in schools where Black teachers made up a larger share of faculty. Hibel et al. (2010) also used nationally representative data to explore factors associated with identification for special education. They found that the share of teachers of a particular race within a school did not differentially predict the likelihood of special education identification based on student race, but this may have been partially an artifact of relatively large standard errors. Similarly, using statewide data from Wisconsin, Fish (2019b) found that students in schools with greater shares of teachers of color had a higher likelihood of special education identification on average but did not find consistent evidence that exposure to teachers of color mattered differentially for students of color. In both Hibel et al. (2010) and Fish (2019b), the researchers were only able to differentiate between teachers of color (generally) vs. White teachers, which may have limited their ability to specifically test for benefits to teacher-student race matching. For all three studies, researchers looked at the teacher racial composition of the school as a primary predictor rather than the specific teacher to which students were matched. Our study built on this literature using fine-grained data on specific student-teacher matches to determine whether Black students matched to Black teachers, in particular, saw differences in special education identification rates.
Methods
Data and Sample
To explore whether access to same-race teachers affected the likelihood of identification for discretionary educational services, we drew on administrative data from North Carolina elementary schools in the years 2007–08 through 2012–13. (We refer to years based on the spring term, so our data run from 2008 to 2013). The North Carolina data allowed us to observe the use of gifted and special education services and to link students to the specific teachers with whom they were observed. We also drew some school-level variables, such as charter school status, from the National Center for Education Statistics Common Core of Data files.
Because our analysis was primarily motivated by a desire to examine factors related to the perpetuation of unequal outcomes for racially minoritized students, we focused primarily on Black students in our main analyses. While we would also have liked to speak to the effects of teacher-student race match for other minoritized groups like Hispanic or Native American students, in practice there were too few teachers from those groups in North Carolina to support a well-powered econometric analysis. While our main results focused on Black students, we also looked at the effects of being matched to Black teachers on students of other races in extensions to our main results.
Because student identification for gifted and special education services most often occurred in elementary schools in our data, we focused on elementary students. Identification of students in gifted programs was generally first reported in third grade, although many students continued to join gifted programs in fourth and fifth grades as well (Table 1). Identification for special education occurred throughout students’ K–12 careers but was concentrated in elementary grades. 5 Table 1 shows the timing of identification for discretionary services for Black students, among those ever identified for a given service type, for students in sample cohorts observed from grades 1–5. In practice, this means students entering first grade in the 2008 or 2009 academic years. Note that initial identification for gifted services was roughly equally divided between third and fourth grades, with a smaller share of students entering fifth grade. For disabilities, most students (~64%) were identified by first grade. Roughly 10% of students using special education services in elementary school were first identified in each of grades 2–4, with 7% entering in grade 5.
Minimum Grade of Service Use Among Black Students Ever Identified as Gifted or Disabled
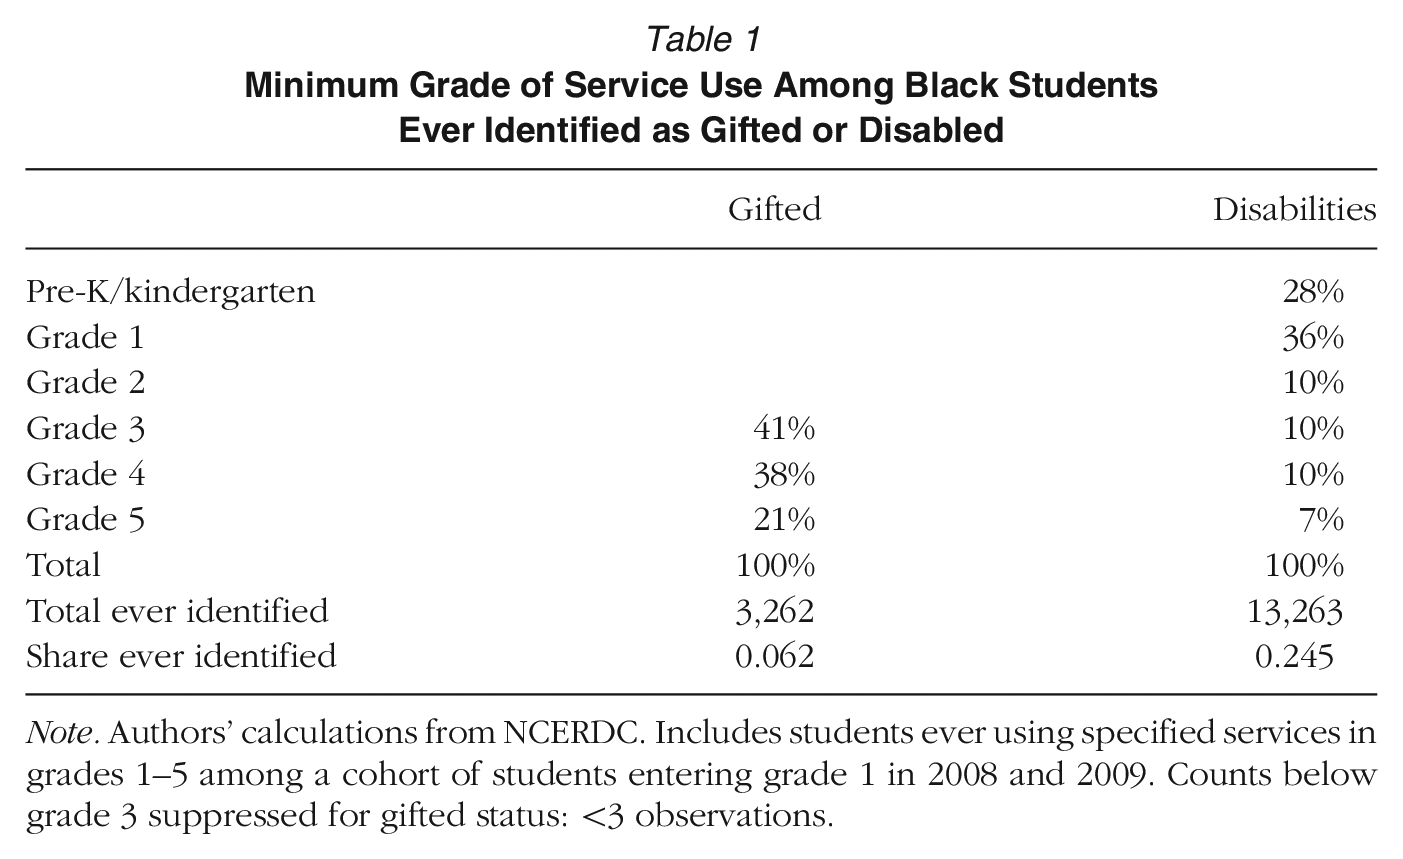
Note. Authors’ calculations from NCERDC. Includes students ever using specified services in grades 1–5 among a cohort of students entering grade 1 in 2008 and 2009. Counts below grade 3 suppressed for gifted status: <3 observations.
We focused on the effect of current-year teachers on identification for disability or gifted services by the following year for two reasons. First, disability service use data in our sample were collected in April 6 ; students newly identified with disabilities in the last quarter of the academic year may, therefore, have been missed if we relied on current-year classifications. In addition, current-year teachers’ recommendations for program identification may take time to result in changes (e.g., because of lags between recommendation for screening and uptake of either special education or gifted services); again, focusing on current-year outcomes may have missed the influence of current-year teachers on identification processes. Thus, our analyses of gifted services focused on students in grades 2–4 (who may be identified to enter gifted programs starting in grades 3–5). Our special education analyses focused on Black students in grades 1–4 (observed entering services in grades 2–5); our sample did not include students below grade 1 since these grades were not mandatory. Our sample for disability analyses—our largest sample—comprised 546,433 student-year observations for North Carolinian Black students in grades 1–4.
Models
From a research perspective, an ideal approach toward evaluating the effect of exposure to Black teachers on Black students’ identification for discretionary education programs would be to randomly distribute Black students across schools and then to randomly assign them to teachers. If the Black students randomly assigned to Black teachers had systematically different outcomes than their peers assigned to non-Black teachers, this would provide evidence that Black teachers causally affected students’ identification for special education services or gifted programs. Given that this is not a realistic study, researchers must look for alternative designs.
A naïve approach would use ordinary least-squares regressions to relate assignments to Black teachers to students’ use of discretionary educational services, controlling for student characteristics—like free or reduced lunch use—that may be correlated with discretionary educational service use. However, this approach would be subject to several threats to validity. Most importantly, it introduces the potential for omitted variable bias if factors related to student outcomes also influenced student assignment to teachers. For instance, Black teachers were more sparsely represented in rural schools than in urban schools (online appendix Table A2); if rural schools were also less aggressive about classifying students with IEPs, perhaps due to labor markets offering less access to qualified special education teachers, then exposure to Black teachers would be spuriously positively correlated with identification for special education.
While this concern could be addressed by adding school fixed effects and time-varying school-level controls, we may be concerned that unobserved factors would continue to generate within-school sorting to Black teachers in ways that might bias our results. Thus, for instance, if very involved Black parents were likely to push for both gifted identification and access to Black teachers where available, our estimates of the effects of being matched to Black teachers would be biased in a positive direction. On the other hand, if principals strategically assigned lower-achieving Black students to Black teachers in hopes that assignment to Black teachers would improve their trajectories (Kalogrides et al., 2013), our estimates for gifted identification might be negatively biased. Similar stories could hold for identification of disabilities; if lower-achieving students were more likely to be matched to Black teachers, this could inflate the relationship between exposure to Black teachers and special education identification.
We addressed this using instrumental variable techniques to carve out the impact of being matched to a Black teacher. Specifically, we used an instrument pioneered by Bettinger & Long (2010) to leverage deviations from long-term trends in the staff composition at a given school to determine whether, for instance, Black students had higher chances of being identified as gifted in years where Black teachers made up a larger share of the potential teachers to which students could have been exposed, relative to student exposure in other years for that school. Specifically, the exogenously determined predicted likelihood of a student being matched to a Black teacher was generated by a first-stage equation relating the race of the realized teacher for student i (BlackTchigst) to the races of the set of teachers that taught in grade g and school s in year t:

The term ShareTchBlack represents the fraction of teachers in the student's school, grade, and year who were Black. We focused on teachers identified as the primary teachers for classes comprising at least five students within a given school-grade-year combination. By primary teachers, we mean that these teachers provided the majority of instruction for their students during the day.
7
We included vectors of student (
We then estimated a second-stage equation modeling the likelihood that student i in grade g in school s would be identified (Ident) for a given discretionary service by year t+1 as a function of predicted access to a Black teacher

Again, we used year t+1 for our main set of outcomes because discretionary service identification could occur throughout the academic year. Thus, depending on when schools reported students’ gifted status or special education service use, we risked missing some identification decisions in year t that occurred after student status was reported for the year. This analytic decision followed prior literature (e.g., Grissom & Redding, 2016). In specification checks, we also explored whether the race of students’ year-t teacher affected their year-t use of discretionary services.
Because we assumed that use of a given discretionary educational service (gifted or special education services) that was already in effect in the year prior (t-1) should not be attributed to the novel influence of having a Black teacher (or not) in year t, we excluded from the sample students who used that same service in year t-1 (see online appendix Table A3 for estimated shares of students using services in t-1). 8 In robustness tests, we explored whether results were sensitive to different ways of treating prior-year classifications, such as eliminating years (2008) where our information on prior-year classifications was less reliable.
All models were estimated with robust standard errors clustered at the school level.
Measures
Outcomes
Our main outcome measures captured students’ next-year use of discretionary educational services, specifically in gifted (sometimes called academically/intellectually gifted) tracks or in special education services. Identification for gifted services could be subject specific; for example, students could be identified as academically/intellectually gifted in math but not in reading. We classified children as gifted if they were identified in either subject. Students were classified as having a disability in a given school year if they were recorded with a primary exceptionality. Since our outcomes captured whether students used a given discretionary service (gifted or special education services) in year t+1, while excluding those who used those services in year t-1, we say that they have been “identified” for services in the interim.
We also observed the specific disabilities for which students received services. In some analyses, we estimated effects for high- or medium-incidence vs. low-incidence disabilities using categories drawn from a 2020 Congressional Research Service report. 9 Based on nationwide data from 2019, this report categorized specific learning disabilities, other health impairments (a category that includes ADHD), and speech impairments as “high-incidence disabilities” (Congressional Research Service [CRS], 2020); these were also the most prevalent disabilities in our data (Table 2). Medium-incidence disabilities included intellectual disabilities, autism, emotional/behavioral disturbances, and developmental delays (CRS, 2020); again, this mapped closely to our data. The other disabilities outlined by the Individuals with Disabilities Education Act (deafness, blindness, hearing impaired, multihandicapped, orthopedically impaired, traumatic brain injured, and visually impaired) were considered “low-incidence.” Online appendix Table A4 lists the diagnoses classified under each category.
Descriptive Statistics by Sex, Black Students in Grades 1–4, 2012
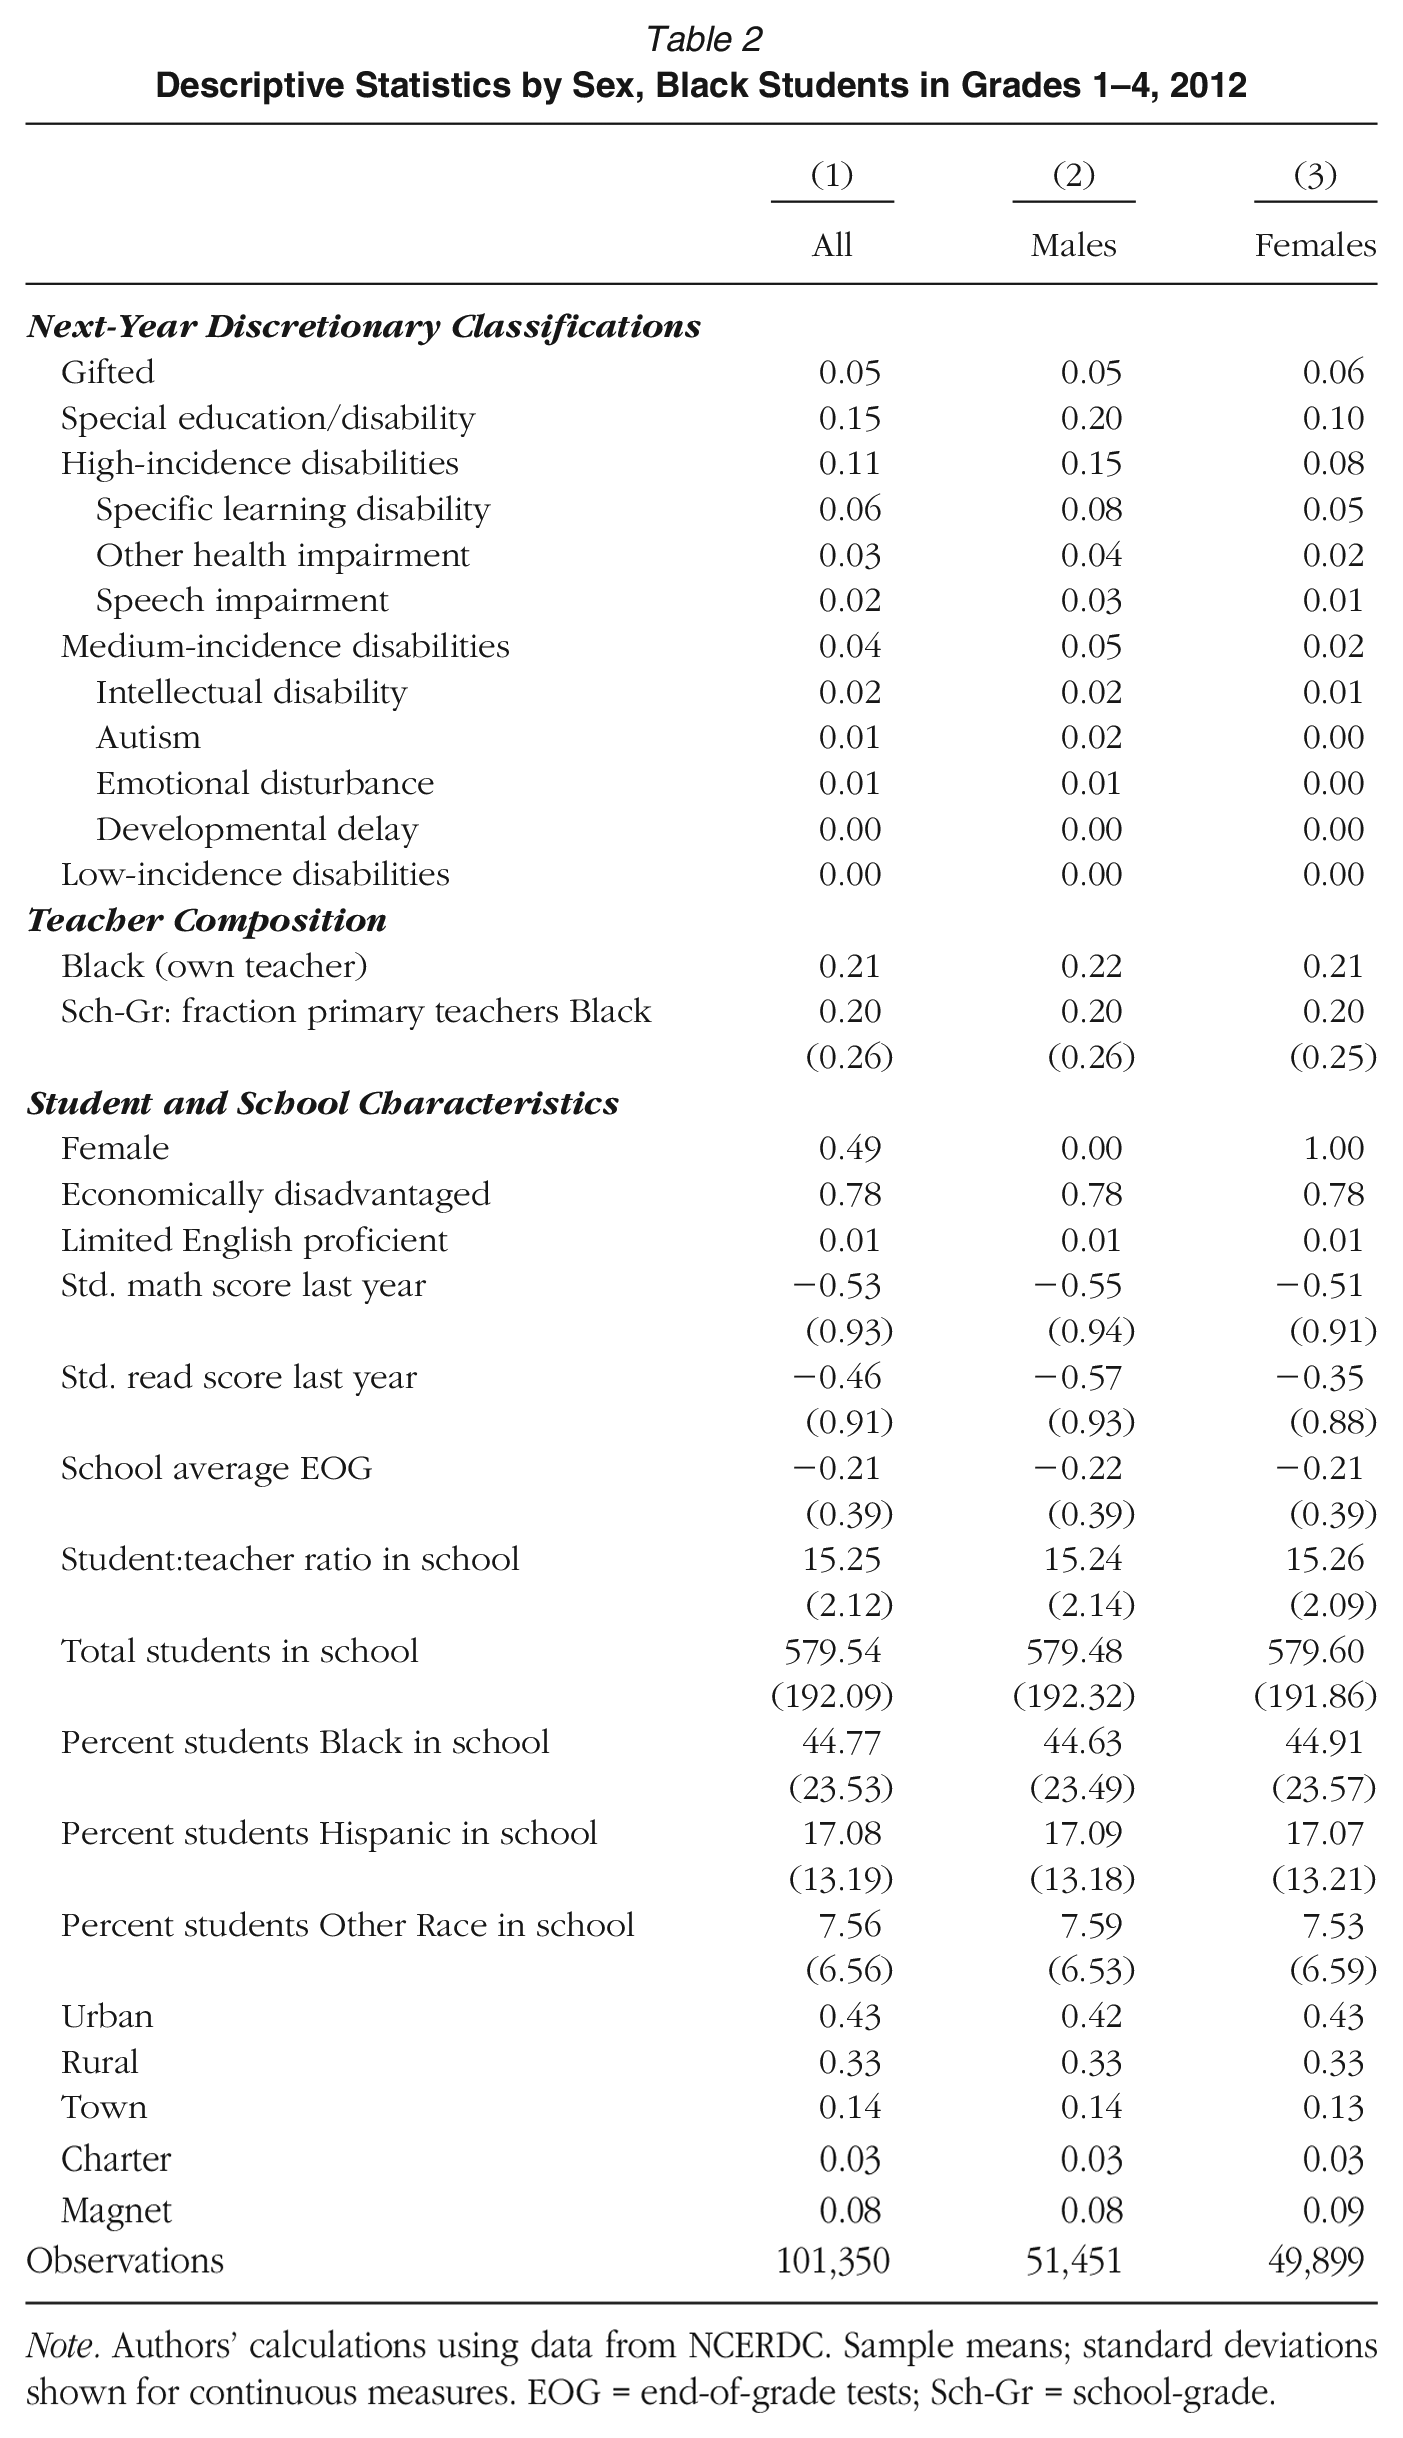
Note. Authors’ calculations using data from NCERDC. Sample means; standard deviations shown for continuous measures. EOG = end-of-grade tests; Sch-Gr = school-grade.
In addition to having sufficient representation in the sample to allow us to plausibly observe effects on these disabilities, we focused on high- and medium-incidence disabilities because these tend to be somewhat less objectively defined and, therefore, more open to educators’ interpretation around whether students may merit identification for services. For instance, the Congressional Research Service report (2020) noted that diagnostic criteria for high- and medium-incidence disabilities varied substantially more across states than did diagnostic criteria for low-incidence disabilities, suggesting a greater role for subjectivity in these disabilities. Low-incidence disabilities tend to be less subjective to diagnose (Donovan & Cross, 2002; Sullivan & Bal, 2013). This suggests that contextual factors—like teacher recommendations—may be more influential in the identification of high- or medium-incidence disabilities than for low-incidence disabilities.
Teacher Composition Variables
Our main independent variable captured whether a student's own teacher was Black. We focused on students’ primary teachers (those providing more than 50% of instruction) since these were the teachers students had the most direct exposure to, and they likely had the most influence on students’ identification for services. 10 The vast majority of first- through fourth-grade students in North Carolina in our analytic window (approximately 90% of students who could be matched to teachers) were assigned to one primary teacher, although they may have encountered subject matter specialists (e.g., art or gym teachers, reading specialists, etc.) as well. If a primary teacher was not identified for students in our data, we imputed the likely primary teacher based on student schedules; we considered a teacher to be a primary teacher for a student if they were both the math and ELA teacher of record for that student.
Our main instrument captured the share of primary teachers who were Black, among those teaching at least five students in the student's school and grade in a given year. As our IV analyses show, students had a higher likelihood of being exposed to a Black teacher in years when Black teachers made up a higher share of the total teaching force for a school grade.
Student Characteristics
We controlled for several student characteristics, including sex (an indicator for whether a student was female), and an indicator for whether a student was economically disadvantaged (ED). 11 We considered a student ED if they were classified as economically disadvantaged by the state in every year that they were observed in our sample with economic disadvantage data. We included indicators for whether students were English learners (classified limited English proficient) and controlled for prior-year math and reading standardized scores for students in grades 4 and 5. Year-prior scores were standardized within the full sample (including students of all races) for each grade-year combination. We included missing variable dummies for student characteristic variables, and for the school characteristic variables described later, when data were missing. This was especially important since not all grades were tested, and we wanted to preserve data for students in untested grades in t-1. We also used some of these student characteristics as stratifying variables: we generated estimates separated out by sex, economic disadvantage status, and grade.
School Characteristics
We controlled for several school characteristics, including school average standardized test score (an average of math and reading), the pupil-teacher ratio, and the log of the total number of students enrolled. We controlled for school urbanicity (differentiating urban, rural, and town schools from the omitted suburban category) and for whether schools were charter or magnet schools (traditional public schools omitted). We also controlled for school racial composition (percent Black, percent Hispanic, and percent Other Race; percent White omitted).
Table 2 provides descriptive statistics for Black students in 2012 overall and for boys and girls separately. Five percent of students were classified as gifted in year t+1, with roughly equal representation across genders. About 15% of the sample was classified with disabilities in year t+1, with stark gender differences: 20% of Black boys, but only 10% of Black girls were identified with disabilities. For both groups, most disabilities fell under the high-incidence disability categories, and specific learning disabilities were the most common disability type.
About 21–22% of students’ teachers were Black, roughly consistent with—but slightly higher than—the share of teachers in their school grades who were Black. This suggests some purposive matching of Black students with Black teachers, as other studies have found is common (Kalogrides et al., 2013). The vast majority of Black students—nearly 80%—were classified as economically disadvantaged, and consistent with this economic disadvantage, the average student in our sample scored about half of a standard deviation below the mean for both reading and math.
Results
Main Results
Our initial set of results explored the relationship between matching to a Black teacher and students’ propensity to be identified for gifted services by the next academic year (among students not previously using services in the year prior, Table 3). We first confirmed that our instrument—the share of primary teachers in a given school-grade-year who were Black—was strongly related to whether an individual Black student's own teacher was Black; the F statistics from the first stages of our regression (Panel A) for all students (Column 1), males (Column 2) and females (Column 3), were all above F = 15,000.
Instrumental Variables Estimates of Match to Black Teacher on Gifted and Disability Identification
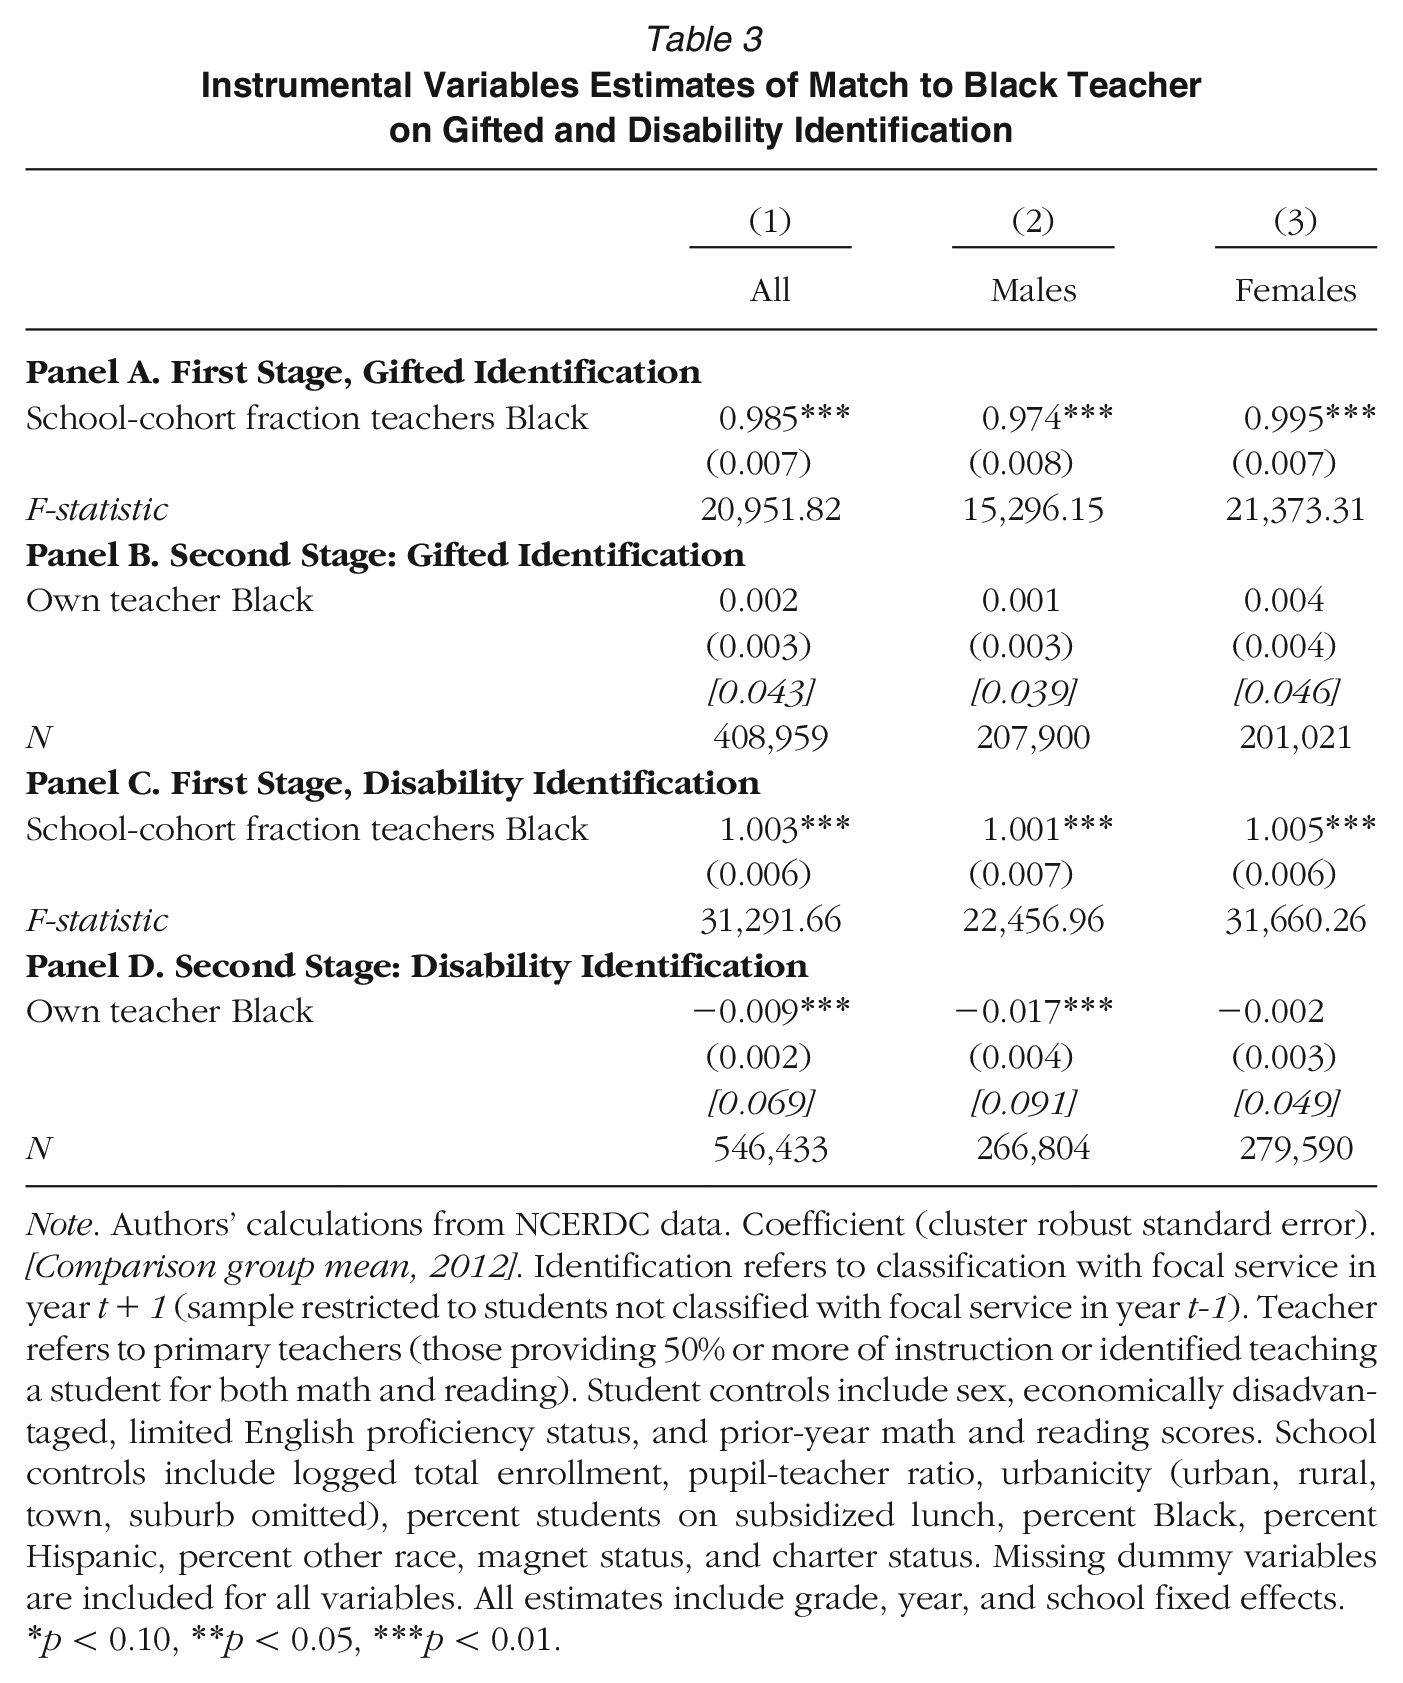
Note. Authors’ calculations from NCERDC data. Coefficient (cluster robust standard error). [Comparison group mean, 2012]. Identification refers to classification with focal service in year t+1 (sample restricted to students not classified with focal service in year t-1). Teacher refers to primary teachers (those providing 50% or more of instruction or identified teaching a student for both math and reading). Student controls include sex, economically disadvantaged, limited English proficiency status, and prior-year math and reading scores. School controls include logged total enrollment, pupil-teacher ratio, urbanicity (urban, rural, town, suburb omitted), percent students on subsidized lunch, percent Black, percent Hispanic, percent other race, magnet status, and charter status. Missing dummy variables are included for all variables. All estimates include grade, year, and school fixed effects.
p < 0.10, **p < 0.05, ***p < 0.01.
However, our second-stage estimates (Table 3, Panel B) provided little evidence that being matched to a Black teacher translated into heightened likelihood of being identified for gifted services for Black students in our sample. While the point estimates for each of our samples were positive, in no case were the estimates statistically significant.
There was stronger evidence that being matched to a Black teacher affected special education identification. Again, the first stage indicated a strong relationship between the school-grade-year teacher composition variable and students’ own likelihood of being matched to a Black teacher (Table 3, Panel C). However, we observed significant relationships between teacher race and student identification in the second stage (Table 3, Panel D). Specifically, Black students matched to Black teachers were nearly one percentage point less likely to be identified for special education services the following year. The relationship was driven primarily by boys: while the relationship between teacher race and special education identification was nonsignificant and small for Black girls, Black boys saw a significant reduction of about 1.7 percentage points in the likelihood of being identified with a disability if they were matched to a Black teacher (Column 2).
These effects are meaningful. As a proportion of students’ baseline rates of novel identification for disabilities in year t+1 (given in italics below the second-stage standard errors), being matched to a Black teacher resulted in about a 13% reduction in the likelihood of being newly identified with a disability by the following year for the Black sample overall. The comparable figure for boys was roughly 18%. The stronger effects for boys are consistent with a number of other papers that have shown particularly strong effects of Black teachers on the educational outcomes of Black boys (Gershenson et al., 2022; Lindsay & Hart, 2017).
In online Appendix B, we describe and show results for robustness tests exploring whether our results were sensitive to different decisions about how to measure and model our relationships of interests. Our results were highly stable; they were robust to using current-year service use—rather than next year’s—as a primary outcome, to using multiple alternate samples that relax or expand sample exclusion criteria, or to including district time trends.
Heterogeneity
While we found a relationship between teacher race and disability identification outcomes for Black children in general and for Black boys in particular, it was possible that this relationship was stronger under certain conditions. Some past studies have suggested that less affluent Black boys particularly benefit from access to Black teachers (Gershenson et al., 2022). In addition, given the usual timing of entry into special education, effects may have differed based on whether students were in earlier vs. later grades. We, therefore, broke our results down based on student economic disadvantage indicators and by grade. Table 4, Panel A, replicates our main results to ease comparisons.
Instrumental Variables Estimates of Match to Black Teacher on Gifted and Disability Identification by Student Characteristics
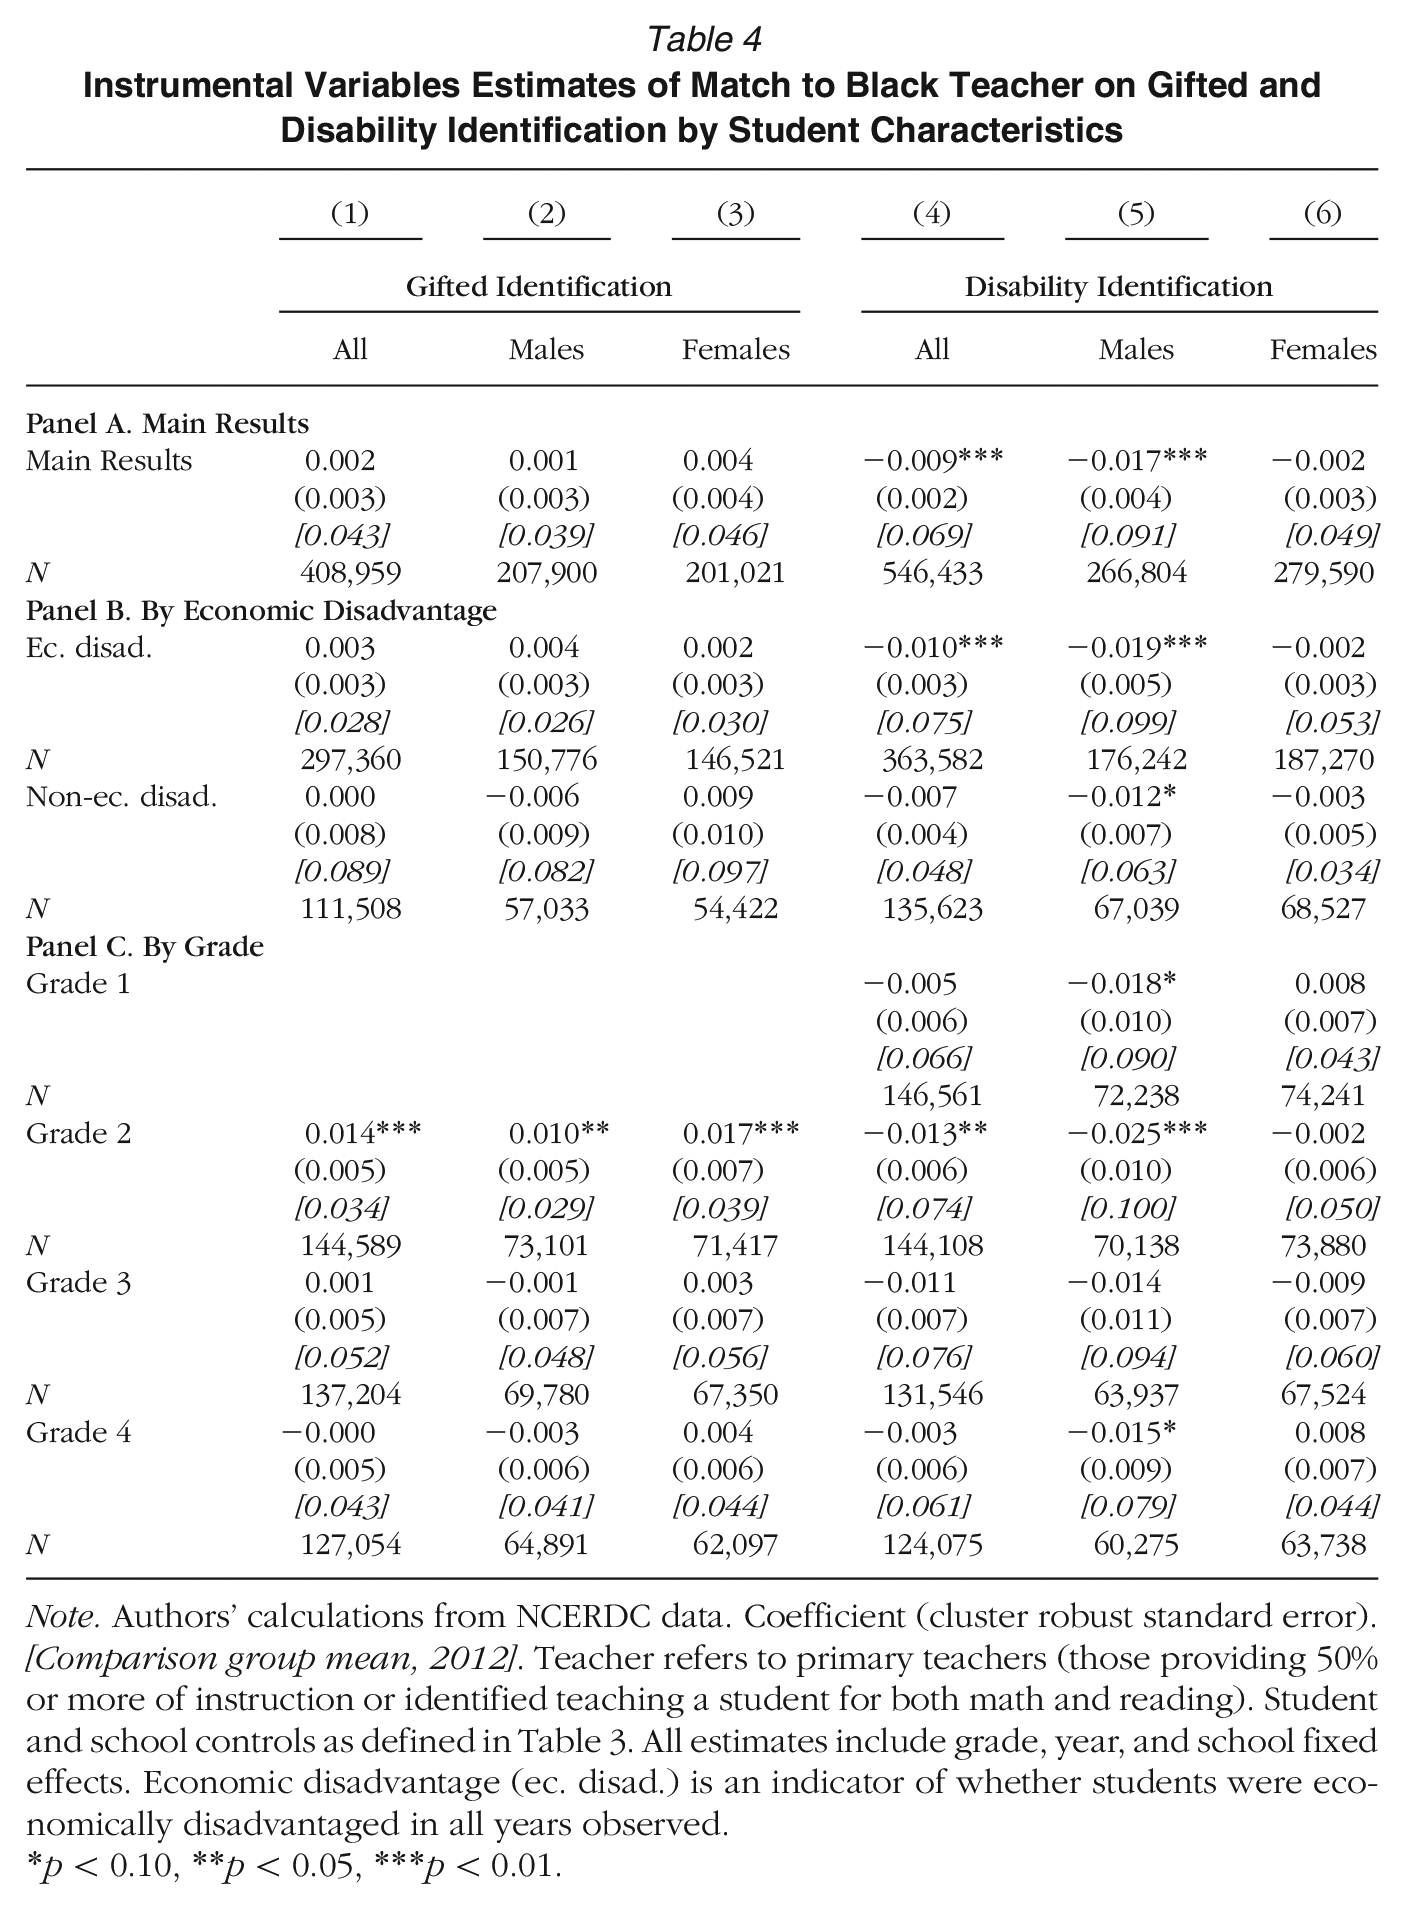
Note. Authors’ calculations from NCERDC data. Coefficient (cluster robust standard error). [Comparison group mean, 2012]. Teacher refers to primary teachers (those providing 50% or more of instruction or identified teaching a student for both math and reading). Student and school controls as defined in Table 3. All estimates include grade, year, and school fixed effects. Economic disadvantage (ec. disad.) is an indicator of whether students were economically disadvantaged in all years observed.
p < 0.10, **p < 0.05, ***p < 0.01.
We found that the relationship between access to a Black teacher and disability identification was especially strong for economically disadvantaged Black boys (Table 4, Panel B). ED Black boys not previously identified with disabilities who were matched to Black teachers had roughly a two-percentage-point reduction in being identified with disabilities compared to their peers matched to non-Black teachers. For non-ED Black boys, Black teachers were also associated with a significant decrease in identification with disabilities, but the change was closer to one percentage point. Note, however, that the two estimates were within each other's confidence intervals. For girls, we found no relationship between teacher race and identification with disability, and there was also no statistically significant relationship between teacher race and gifted identification for either sex.
Interesting patterns emerged with respect to the identification of discretionary services across grades (Table 4, Panel C). Notably, while the overall effects of Black teachers on identification for gifted programs in the following year were positive but not statistically significant from 0 when all grades were pooled, we found significant and positive effects when looking just at grade 2. Effects were especially pronounced for Black girls, who were nearly two percentage points more likely to be identified for gifted programs when matched to a Black second-grade teacher (b = 0.017). Since third grade is the first year that students were generally identified for gifted services in North Carolina, 12 this suggests that students’ earliest identification opportunities were significantly influenced by access to Black teachers. For Black boys, being matched to Black teachers was predictive of reduced likelihood of identification with disabilities in all grades but not always at a statistically significant level. The magnitude of coefficients was larger in earlier grades, although the estimates for grades 1 and 2 were within the confidence intervals of the estimates for grades 3 and 4 and vice versa.
Disability Types
While the previous evidence shows that Black teachers were associated with lower rates of identification with disabilities for Black boys, this relationship could vary based on the type of disability considered. For instance, teacher discretion may be relatively limited in promoting or inhibiting diagnosis with low-incidence disabilities, which tend to have more objective, consistently defined standards for diagnosis (CRS, 2020). We, therefore, examined whether our results for disability identification, for male students specifically, varied based on the type of disability considered (Table 5; comparable results for female students were null across all disability types). In addition to looking at these relationships for Black boys overall (Column 1), we separately considered ED and non-ED Black boys (Columns 2 and 3).
Instrumental Variables Estimates of Match to Black Teacher for Male Students for Identification with Different Disability Types
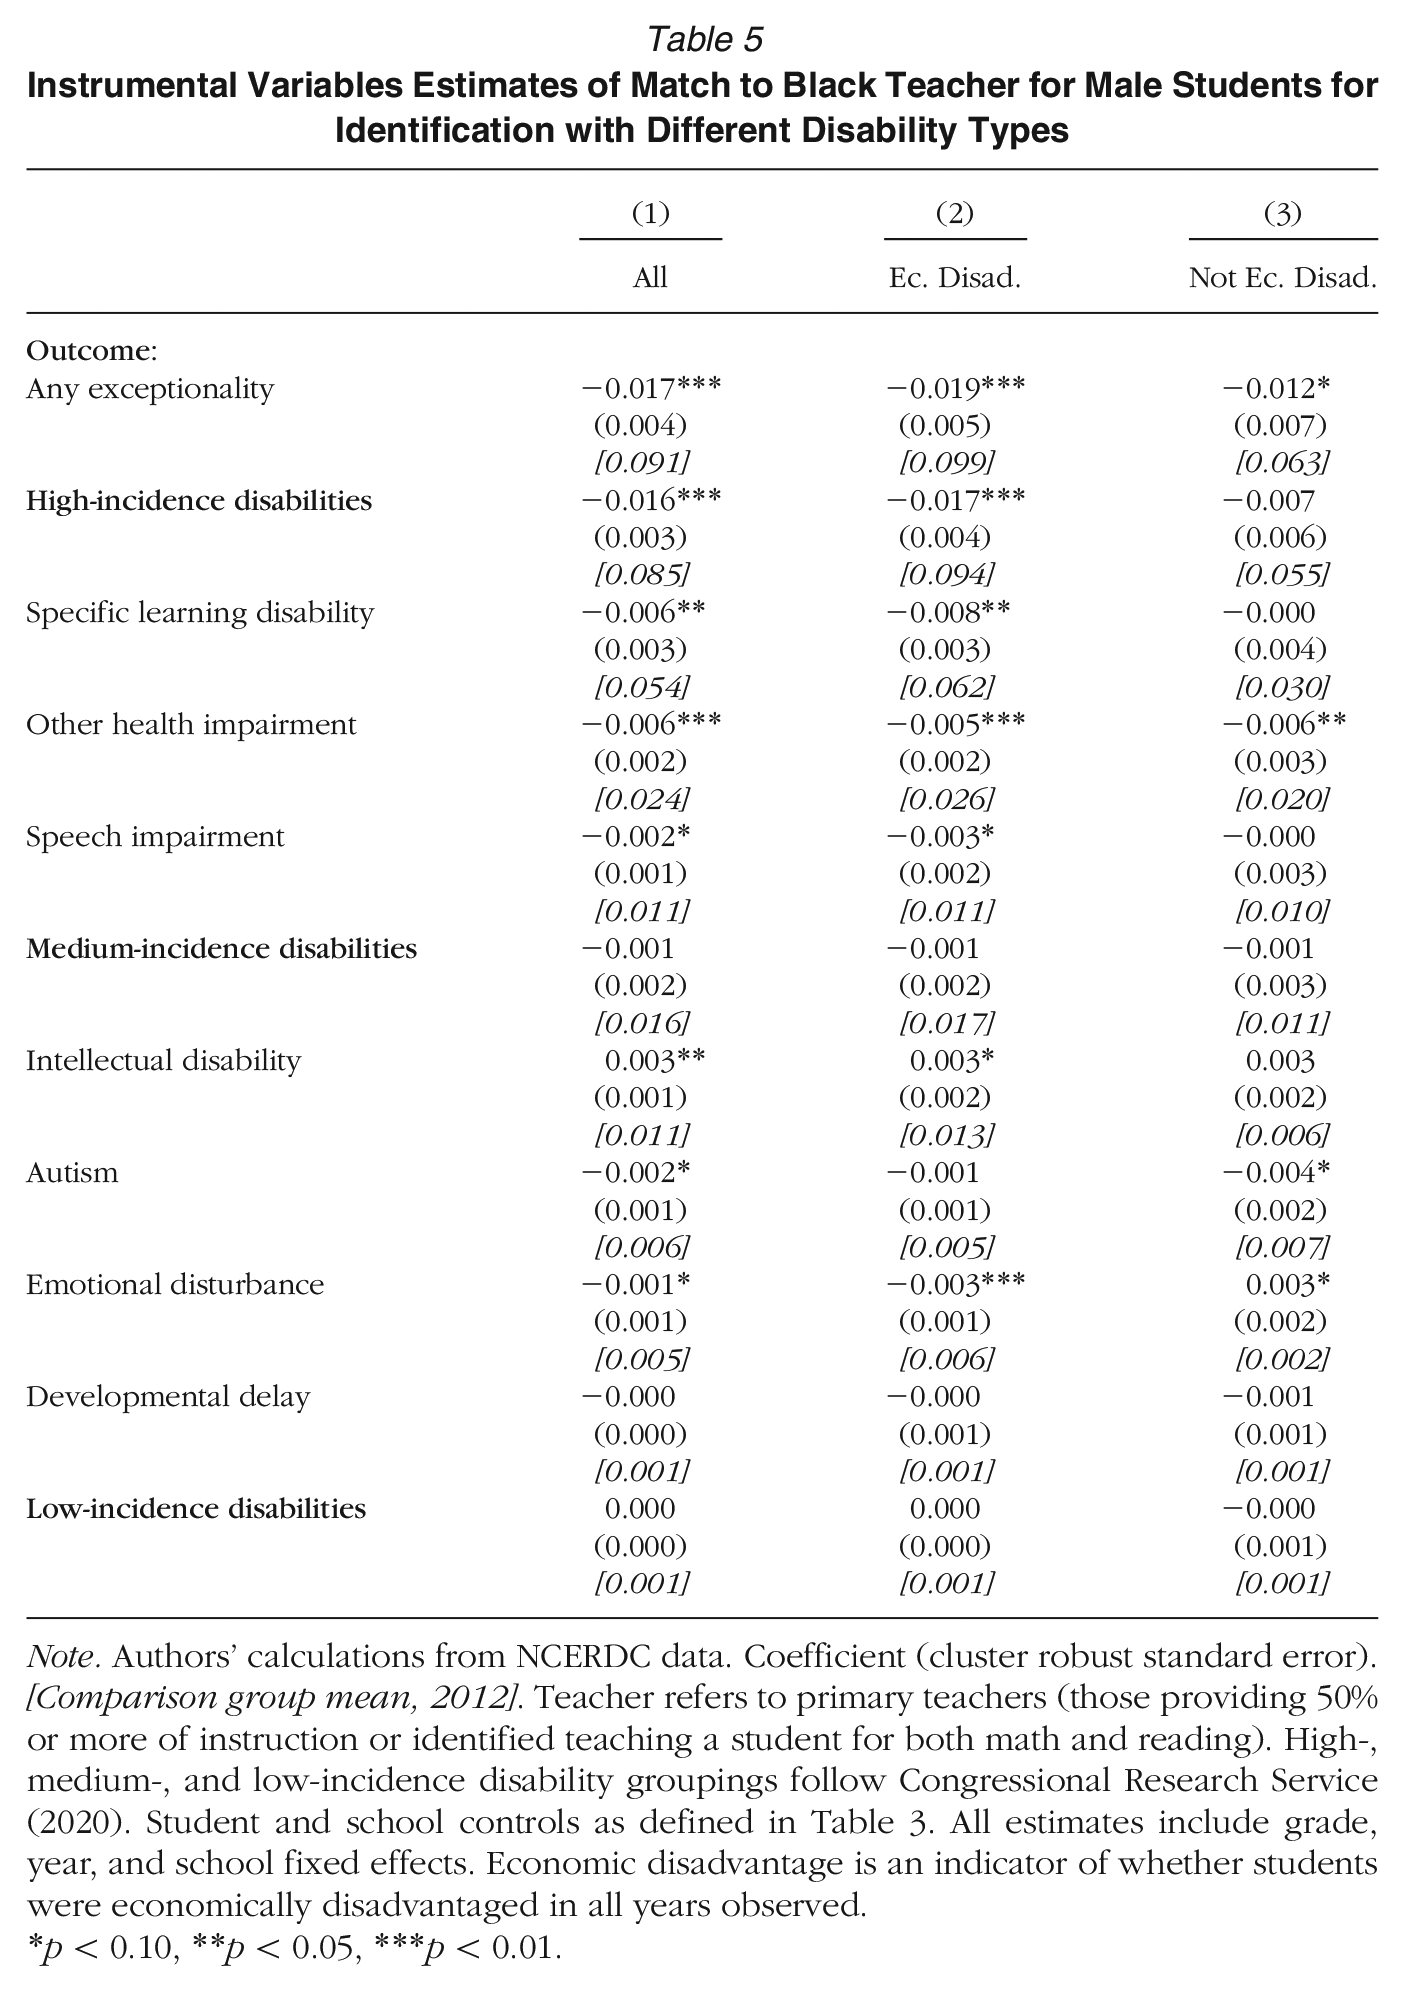
Note. Authors’ calculations from NCERDC data. Coefficient (cluster robust standard error). [Comparison group mean, 2012]. Teacher refers to primary teachers (those providing 50% or more of instruction or identified teaching a student for both math and reading). High-, medium-, and low-incidence disability groupings follow Congressional Research Service (2020). Student and school controls as defined in Table 3. All estimates include grade, year, and school fixed effects. Economic disadvantage is an indicator of whether students were economically disadvantaged in all years observed.
p < 0.10, **p < 0.05, ***p < 0.01.
We found that being matched to a Black teacher was more predictive of the likelihood of identification with high-incidence disabilities (b = −0.016, p < 0.01) than for medium- or low-incidence disabilities (Column 1). These relationships were negative for each of the high-incidence disabilities—specific learning disabilities, other health impairments (which includes ADHD), and speech impairments—though the relationship was only marginally significant for speech impairments (p < 0.10). For several medium-incidence disabilities—autism and emotional disturbance—Black boys matched to Black teachers saw lower rates of identification, though the results were only marginally significant. In contrast to the overall pattern, however, Black boys matched to Black teachers were slightly more likely to be identified with intellectual disabilities (b = 0.003, p < 0.05).
We observed interesting patterns around economic disadvantage. The negative relationship between Black teachers and identification with disabilities overall was stronger for ED Black boys (Column 2; b = −0.019, p < 0.01) than for non-ED Black boys (Column 3; b = −0.12, p < 0.10), and the disparity was even more pronounced when considering high-incidence disabilities specifically (b = −0.017, p < 0.01 vs. −0.007, n.s.). In general, the negative relationships between Black teachers and identification were stronger across most disability types for ED Black boys. Two interesting exceptions were autism and other health impairments, where the declines were similar in size or somewhat larger in magnitude for non-ED Black boys.
While there were a few deviations from the overall pattern, taken together, these results suggested a particularly pronounced reduction in diagnosis with disabilities that have a more discretionary component when Black boys were matched to Black teachers, particularly for Black boys who were economically disadvantaged. We return to these results in our discussion.
Heterogeneity Based on School Demographic Composition
Given the findings by Elder et al. (2021) and Fish (2019a) that disability diagnoses often depend in part on school demographic contexts, we explored whether the relationship between Black teacher match and identification for services was moderated by school demographics. We broke schools into quartiles based on the share of their students who were Black. For disability identification (Table 6, Columns 4–6), we did not find any evidence that Black teachers mattered more in schools where Black children made up a smaller share of the student population. While the coefficients were largest for the schools with the least-Black populations, the change in coefficients across the demographic gradient was not monotonic. For instance, for Black boys, the coefficients were largest in the schools with the fewest Black children (b = −0.023) and with the most Black children (b = −0.020); the estimates were within each other's confidence intervals, and the estimates for the middle two quartiles were nonsignificant and smaller in magnitude.
Second Stage Instrumental Variables Estimates of Black Teacher Match by School % Black
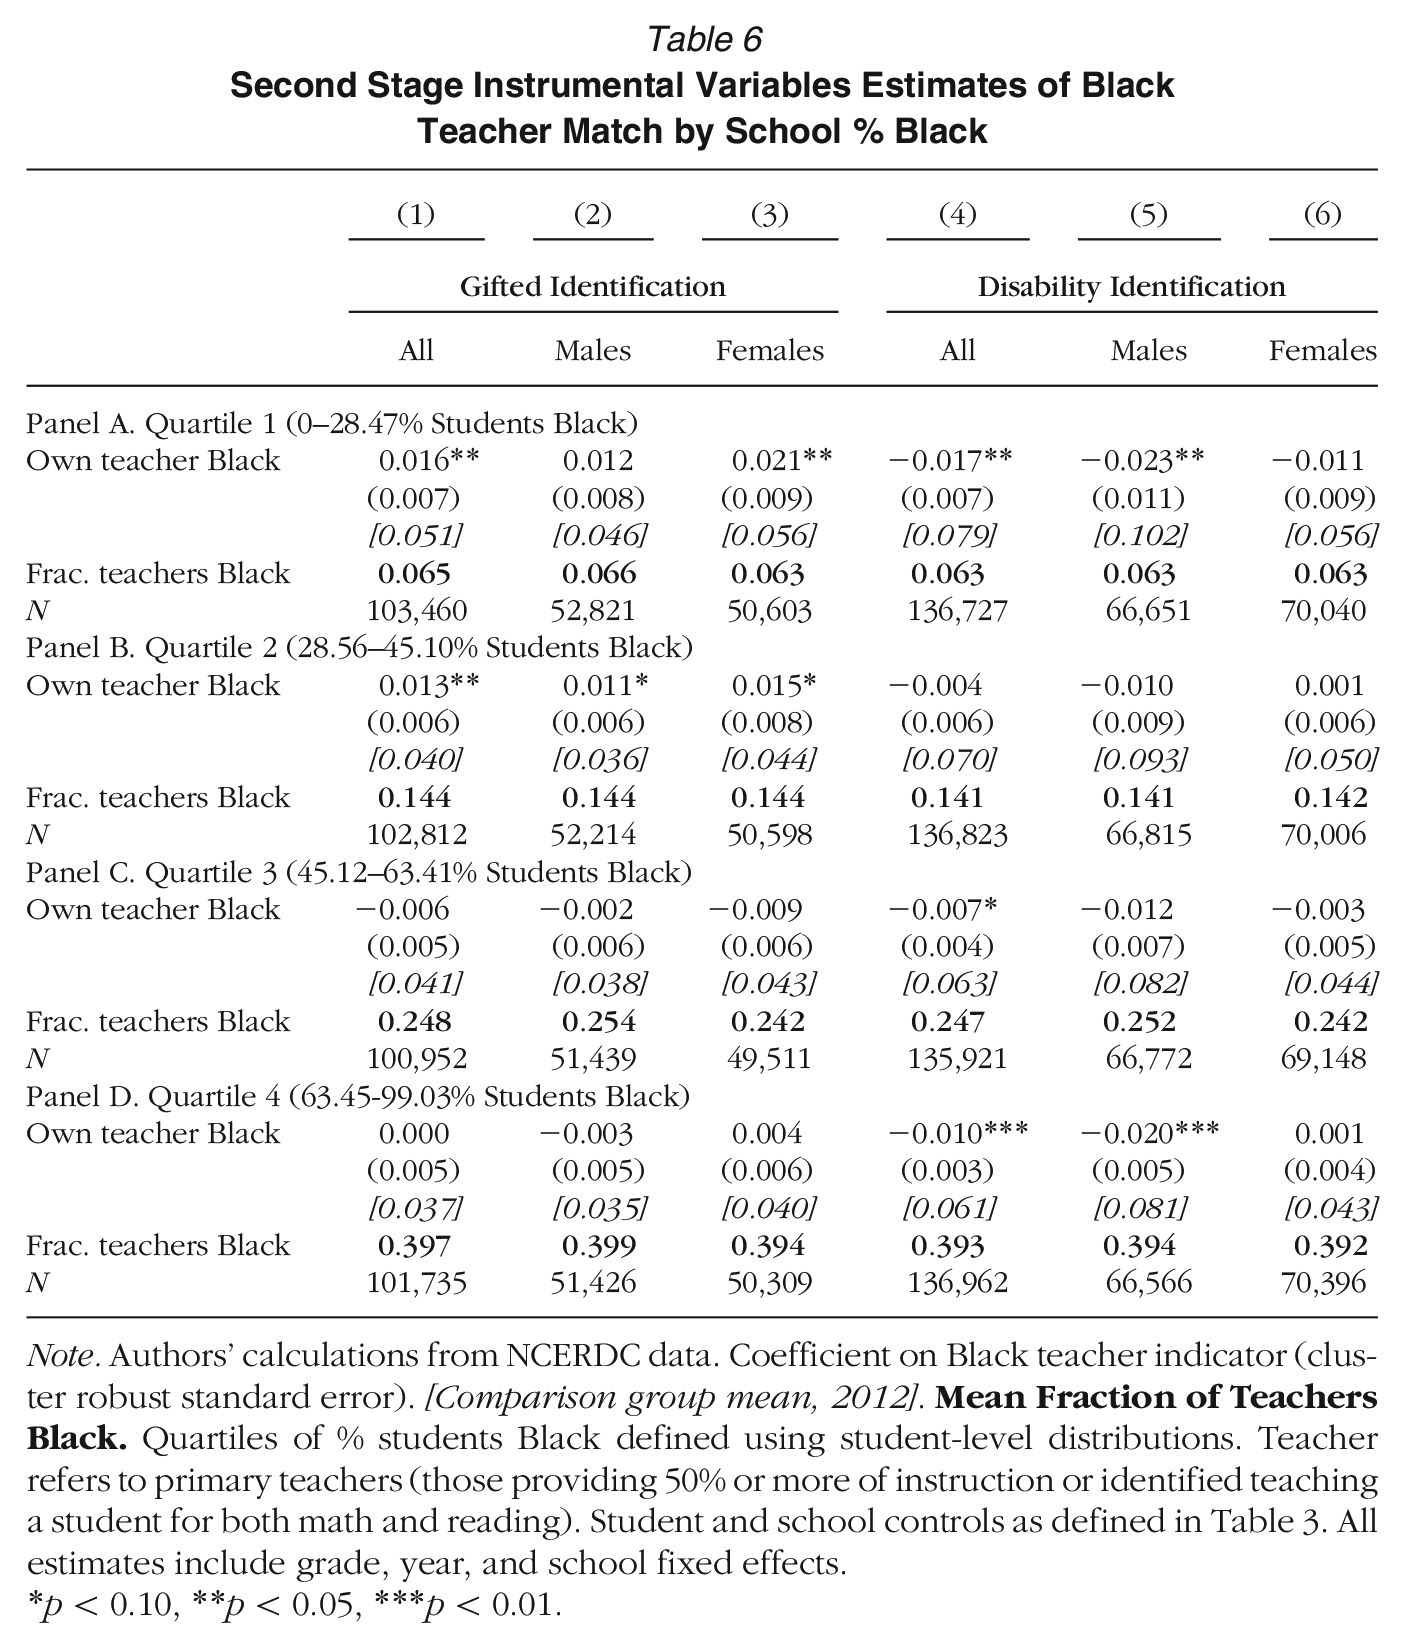
Note. Authors’ calculations from NCERDC data. Coefficient on Black teacher indicator (cluster robust standard error). [Comparison group mean, 2012].
p < 0.10, **p < 0.05, ***p < 0.01.
We did observe interesting patterns for gifted identification, however (Columns 1–3). Being matched to a Black teacher was positively related to next-year gifted identification for students in schools with lower concentrations of Black students. These results were especially strong for Black girls. This suggests that Black teachers particularly mattered for gifted identification in schools where Black children are not the dominant population. It is also notable that schools in the bottom quartile of the share of students who are Black also had teaching forces that included fewer Black faculty, as denoted in the bolded rows: roughly 7% of teachers were Black in the least-Black schools compared to 40% in the most-Black schools. Because the benefits to Black teachers with respect to gifted identification were strongest in schools with fewer Black students, and because these schools had the fewest Black teachers in general, this suggests a particular imperative to diversify teaching forces in schools with few Black students.
Impacts on Non-Black Students
The primary motivation for this paper was to examine the impact of exposure to Black teachers on Black students’ outcomes, given ongoing racial disparities in educational achievement and prior literature showing the benefit of race-matched teachers for Black students specifically. However, one may also wonder how exposure to Black teachers affects other non-Black students. On the one hand, if the observed effects on disability identification operate primarily through benefits from race match specifically—that is, if teachers were, in general, less likely to identify students from their own race/ethnic group with a disability—we may see that non-Black students matched to Black teachers have higher rates of identification. This would likely be particularly true for White students since their alternative teacher assignments would very likely be to White teachers, given the prevalence of White teachers in the labor force. By contrast, the very low number of Hispanic, Asian, or other-race teachers in North Carolina implies that students from those groups not matched to a Black teacher would much more likely be matched to a White teacher than a same-race teacher, and so their counterfactual to a Black teacher would not likely be a same-race teacher.
On the other hand, if our results were driven by a pattern in which Black teachers were less likely to suggest that students be screened for disabilities across the board, then we might see effects for students from other race/ethnic groups in the same direction as for Black students. Online Appendix Table A5 provides descriptive characteristics for White, Hispanic, and Asian students in the analytic sample, showing that White and Asian students had substantially higher rates of gifted identification than Black students, and for Asian students in particular, generally lower rates of identification with disabilities. Unsurprisingly, given geographic stratification, White, Asian, and Hispanic students were, on average, more concentrated in schools with fewer Black teachers than in our main sample.
Table 7 tests how exposure to Black teachers is related to identification for discretionary services for White, Hispanic, and Asian/Pacific Islander students. As for Black students, we found very little evidence that exposure to Black teachers affects students’ likelihood of identification for next-year gifted programs across all races. Point estimates were all nonsignificant and small in magnitude. Interestingly, our results for disability identification also followed a similar pattern as for Black students, although the negative relationship between Black teachers and identification with disabilities was only significant for White students. This suggests that the mechanism for our results may be that students matched to Black teachers, in general, had a lower likelihood of being identified with disabilities rather than the effect being specific to Black students. This finding is consistent with several studies showing benefits to Black students of Black teacher matching, while finding neutral (Gershenson et al., 2022) to positive effects for non-Black students (Cherng & Halpin, 2016), but is still notable given that other studies find that non-Black students benefit when matched to teachers of their own race (e.g., Dee, 2004; Egalite et al., 2015).
Instrumental Variables Estimates on Match to Black Teacher for Non-Black Students
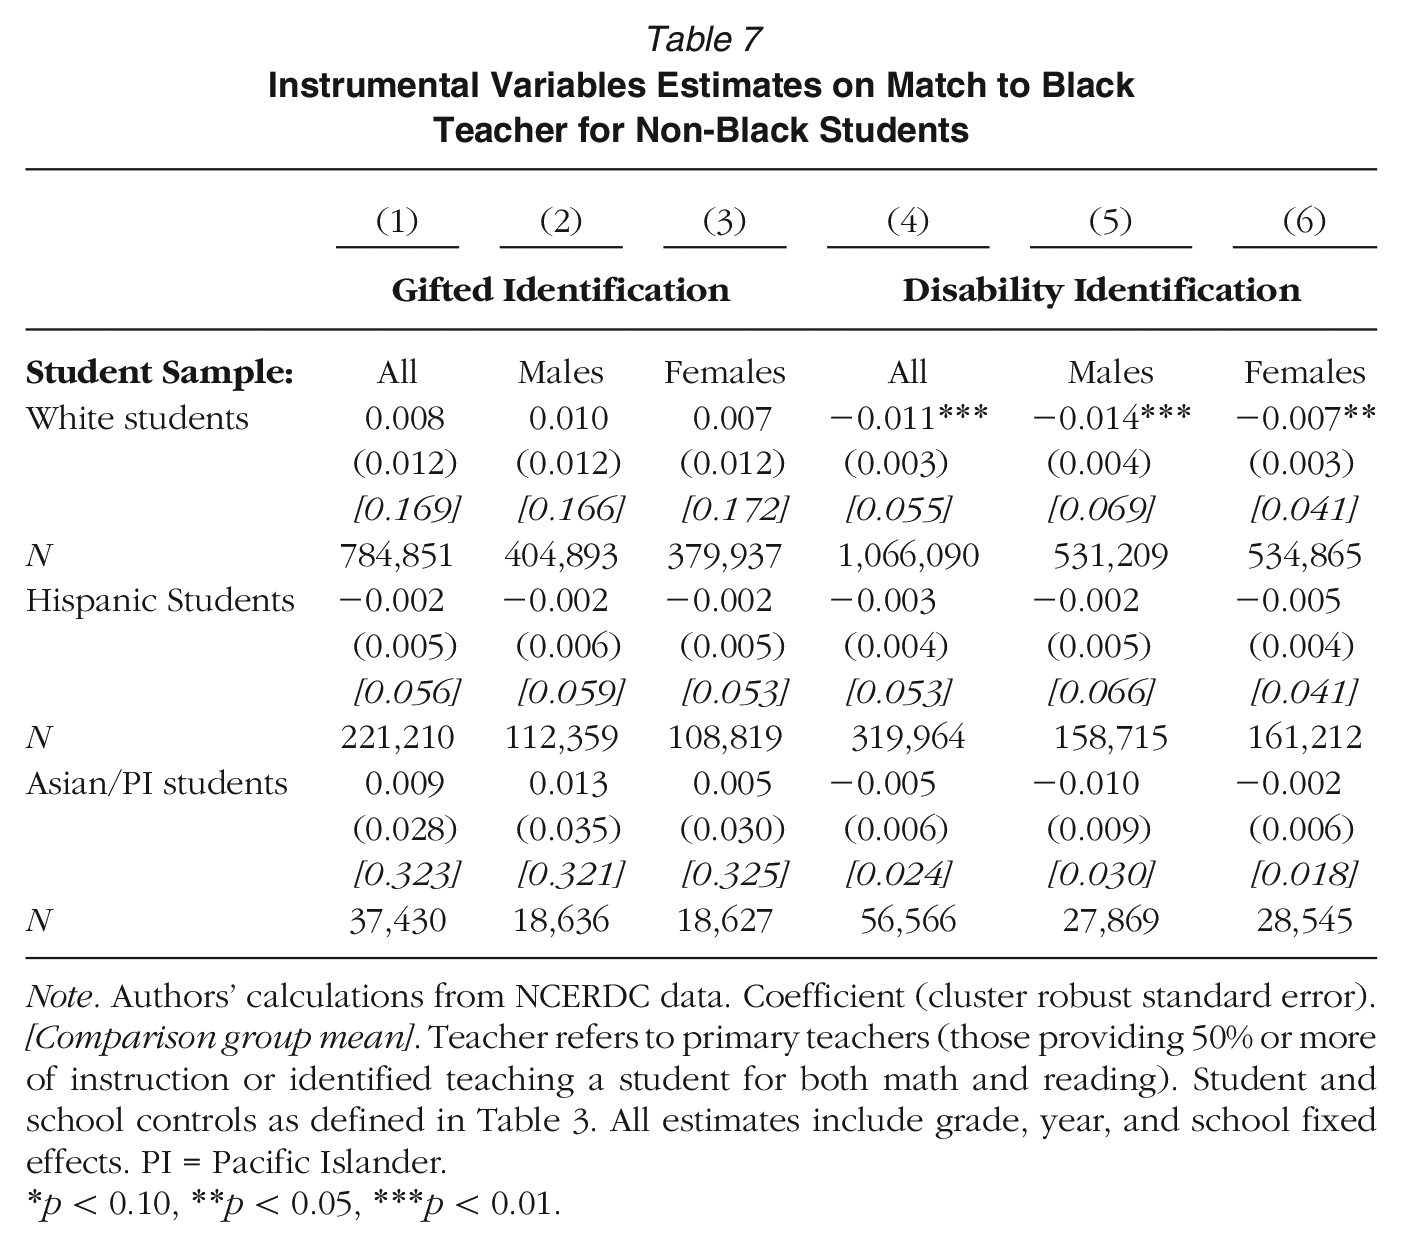
Note. Authors’ calculations from NCERDC data. Coefficient (cluster robust standard error). [Comparison group mean]. Teacher refers to primary teachers (those providing 50% or more of instruction or identified teaching a student for both math and reading). Student and school controls as defined in Table 3. All estimates include grade, year, and school fixed effects. PI = Pacific Islander.
p < 0.10, **p < 0.05, ***p < 0.01.
Discussion
Using a large administrative dataset covering six academic years, we examined the relationship between having a same-race teacher and gifted/special education identification for Black students in North Carolina. North Carolina's teacher and student racial compositions mirrored national demographic trends, with Black teachers under-represented in the workforce compared to the share of students who were Black. The estimates for giftedness were positive but not large in magnitude and generally not statistically significant. The exception was for gifted identification in grade 2 and in schools with relatively low concentrations of Black students. In these schools, being matched to Black teachers positively predicted gifted identification for Black students; these effects may also reflect the relative rarity of Black teachers in these schools.
In the disability analyses, we found that Black teachers were associated with lower rates of identification with disabilities for Black children, particularly for Black boys. Results were especially strong for economically disadvantaged boys and for categories like specific learning disabilities that have a more subjective component to diagnosis. Though we cannot speak specifically to the mechanisms, this may imply that for disabilities that are more subjective, teacher race plays a role in the outcomes for these students. This is consistent with other literature showing particular benefits of being matched to Black teachers for economically disadvantaged Black boys (e.g., Gershenson et al., 2022), including for outcomes like disciplinary referrals that rely heavily on teacher discretion (Lindsay & Hart, 2017) and for outcomes like teacher expectations (Gershenson et al., 2016), which we theorized may be a pathway through which teacher race affected identification for services. For this particular set of students, Black teachers may engage in practices that are asset-based instead of using practices that are deficit-oriented or that fail to acknowledge the complicated interconnections between race and disability status (Artiles, 2011).
Our results add important additional context to debates around whether Black students are under-identified or over-identified in special education settings. Recent studies have pointed to the importance of contextual factors such as school segregation in shaping the dynamics of racialized assignment to school settings (Elder et al., 2021; Fish, 2019a). Our study points to teacher race as a potentially important contextual factor in the identification of students for special education. Policymakers and other stakeholders may want to pursue educator diversity as one potential strategy to address over-identification of minoritized children for special education programs.
At the same time, expanding the recruitment of Black teachers is only one strategy to mitigate these differentials. Districts should, therefore, consider other promising options to improve the success of non-Black teachers with students of color. Such options may include promoting pedagogical strategies that help non-Black teachers successfully engage students of color (like leveraging students’ cultural capital; Goldenberg, 2014) and identifying and learning from teacher training contexts (such as HBCU programs) that promote success with Black students for Black and White teachers alike (Edmonds, 2022). Moreover, districts may want to clarify guidelines for teachers regarding when they should recommend screening for high-incidence disabilities to minimize the role of teacher discretion in the identification process.
Our analysis has several important limitations. As noted previously, we cannot speak to mechanisms driving our results. For instance, it is possible that exposure to Black teachers decreased identification with attention disorders for Black students because those teachers were less likely to interpret the same behaviors as inattentive compared to non-Black teachers. It is also possible that Black students responded to Black teachers by increasing their engagement in class so that their teachers were less likely to identify them with attention disorders because the students presented with different behaviors. Additional qualitative work would be useful to explore how teacher perceptions of student behaviors and referral decisions differ based on teacher race. Moreover, acknowledging that Black teachers are not a monolith but have varying attitudes and practices (Mustafaa, 2023), future work should explore specifically which practices by Black teachers explain our current results.
Another limitation is that we looked only at a single state and only in early grades; it is possible that the relationship between access to Black teachers and discretionary services varies in other contexts. We were also limited by the granularity of our data. We were not able to see who initially referred students to eventually receive disability or gifted services. Future studies that are able to capture teacher referrals more clearly would provide a welcome complement to these analyses.
Additionally, it is important to note that even if teachers commonly make initial referrals for discretionary educational services, they are not the only actors involved. Multiperson Individualized Education Plan teams consisting of at least the student's regular classroom teacher, one special education specialist, and one district representative—as well as students’ parents or guardians—meet to determine whether each student qualifies for special education services (North Carolina Department of Public Instruction, 2021). Future work should look at how the identities of some of these other actors, such as special education coordinators, play into student identification for disabilities. Additional work should also look at whether the race of special education teachers is related to the outcomes of students in special education, given that the special education teaching workforce is as skewed toward White teachers as the teaching workforce overall (U.S. Department of Education, 2020). Similarly, other adults regularly in children's classrooms—such as teaching assistants or special education coteachers helping currently identified students with disabilities—may also affect the likelihood of students’ referrals, either through bringing potential disabilities to teachers’ attention or possibly by moderating whether teachers consider student challenges significant enough to warrant referral. Future work should explore these important questions.
Our results may have ambiguous implications: we note that reductions in identification for special education services are arguably—but not unambiguously—a positive result. There is a robust discussion in the field about the meaning of the disproportionality of special education identification for students of color. For example, several authors have shown that Black children are under-identified for disabilities conditional on test scores and that school composition is a factor in such identification (Hibel et al., 2010; Morgan et al., 2017). This is an important element in the discussion around special education programs because missing out on critical services could be detrimental to students, even as identification for special education may stigmatize students (Artiles et al., 2016). However, recent quasi-experimental evidence does suggest benefits to Black students when disproportionate assignment to special education services is reduced (Ballis & Heath, 2021b) and that Black students see fewer benefits to special education in general (Schwartz et al., 2021), suggesting some benefit to Black students from avoiding identification in marginal cases.
We further interpret our results in the context of past findings that more access to Black teachers is associated with positive long-term outcomes for Black children, particularly for economically disadvantaged Black boys (see Gershenson et al., 2022). Taken together, our results showing reduced likelihood of special education identification for Black boys matched to Black teachers suggest that one possible mechanism for Black teachers’ benefits for Black boys may be through avoiding diagnosis with disabilities in cases more subject to judgment. On net, then, we tentatively interpret these results as suggesting benefits of Black teachers with respect to students’ identification for special services, though future work should continue to weigh the potential positives and negatives of these effects.
These results may have important implications for policymakers and practitioners. These findings point to one additional channel that districts with disproportionalities for Black students may consider to reduce potential over-identification for Black children. Given that past literature suggests that Black teachers may boost Black students’ academic performance and attainment, this suggests that districts’ efforts to recruit Black teachers may improve these outcomes as well as align with special education mandates.
Supplemental Material
sj-pdf-1-aer-10.3102_00028312241229413 – Supplemental material for Teacher-Student Race Match and Identification for Discretionary Educational Services
Supplemental material, sj-pdf-1-aer-10.3102_00028312241229413 for Teacher-Student Race Match and Identification for Discretionary Educational Services by Cassandra M.D. Hart and Constance A. Lindsay in American Educational Research Journal
Footnotes
Notes
C
C
References
Supplementary Material
Please find the following supplemental material available below.
For Open Access articles published under a Creative Commons License, all supplemental material carries the same license as the article it is associated with.
For non-Open Access articles published, all supplemental material carries a non-exclusive license, and permission requests for re-use of supplemental material or any part of supplemental material shall be sent directly to the copyright owner as specified in the copyright notice associated with the article.