
Abstract
Inadequate compensation is often viewed as the root of teacher workforce challenges despite teacher reports that working conditions matter more. Using an original discrete choice experiment with a national sample of 1,030 U.S. teachers, we found that support staff—special education specialists, counselors, and nurses—play an essential role in shaping teachers’ employment preferences. Teachers value access to these support staff more than they value a 10% increase to their own salary. We also assessed teachers’ preferences regarding childcare subsidies and find that teachers treat a 10% salary increase and a childcare benefit of similar value as near perfect substitutes. To test the durability of these findings, we replicated our study 2 years later and found nearly identical results.
Resolving quandaries about how to improve teacher recruitment and retention requires understanding how teachers make choices about where to work. Although a robust body of evidence suggests teachers’ working conditions strongly influence their employment preferences (Boyd et al., 2011; Johnson, 2019; Johnson & Birkeland, 2003; Johnson et al., 2012; Kraft et al., 2016; Ladd, 2011; Simon & Johnson, 2015), the notion that inadequate pay lies at the root of teacher workforce challenges is deeply entrenched. As evidence, a great deal of research and public debate focuses on increasing teacher salaries as a key lever for addressing persistent teacher workforce challenges, such as chronically understaffed schools and high teacher turnover (Carver-Thomas & Darling-Hammond, 2017; Glazerman et al., 2013; Goldhaber et al., 2011; Hanushek et al., 2004; Loeb et al., 2005; Nguyen et al., 2020; Rumberger, 1987). Direct teacher feedback that dissatisfaction with salary is rarely the reason they exit the profession (Goldring et al., 2014) has done little to abate the fixation on teacher compensation. This article takes as given that compensation matters to teachers (e.g., Hendricks, 2014; Springer et al., 2016) but explores an additional set of school features that may matter just as much or more.
The foundation for this work is a growing literature on teachers’ preferences (Alva et al., 2021; Fagernäs & Pelkonen, 2012; Fuchsman et al., 2020; Horng, 2009; Johnston, 2020; Viano et al., 2020). A major contribution of this scholarship is the insight that teachers do not switch schools for the opportunity to work with more privileged students, as early research on teacher mobility suggested (e.g., Clotfelter et al., 2006; Hanushek et al., 2004; Lankford et al., 2002); rather, they more often move to access better working conditions, such as principal support (Horng, 2009; Johnston, 2020; Viano et al., 2020). These findings are consistent with research documenting the outsized role school leaders play in shaping teachers’ working conditions (Ladd, 2011) and teachers’ employment decisions (Boyd et al., 2011). Additional research links the quality of teacher-teacher relationships to teacher mobility (Kraft et al., 2016; Miller et al., 2020; Miller & Youngs, 2021; Redding & Nguyen, 2020; Smith & Ingersoll, 2004), further underscoring the importance of organizational context to teachers’ satisfaction at work.
We build on the evidence that working conditions are central to teachers’ employment preferences and ask three research questions. First, in addition to school leaders, what school personnel play a significant role in shaping teachers’ preferences about where they want to work? Second, how do teachers’ preferences regarding who they work with compare to their preferences regarding how they are compensated? Third, does the prospect of working at a school that provides childcare subsidies influence teachers’ preferences regarding where they want to work?
The job features we focus on pertain to personnel policy—the choices system leaders make about how to manage human resources. Although personnel costs are the single largest line item in a school budget, accounting for 80% of expenditures in the average public school (National Center for Education Statistics [NCES], 2020), we know very little about the types of personnel investments that are meaningful from teachers’ perspectives. Moreover, even the best-funded districts in the country are unlikely to be able to offer teachers the full suite of supports they might desire. It is therefore important to understand how teachers make trade-offs across different types of investments.
This study estimates teachers’ employment preferences using a discrete choice survey experiment with a national sample of teachers. Specifically, we presented teachers with pairs of hypothetical teaching jobs and asked them which school in the pair they preferred. We defined each school according to a set of features that map back to the three most cited reasons teachers leave schools: working conditions, family/personal reasons, and pay (Podolsky et al., 2016). The specific attributes were childcare benefits, class size, salary, and four key teacher support roles: instructional coaches, nurses, school counselors, and special education specialists. The values assigned to each of the features were randomly assigned to estimate the causal effect of each job feature on the probability a teacher wanted to work at a given hypothetical school. We then used these estimates to address the key policymaker problem: Faced with a choice between increasing teachers’ salaries or investing in any of the six alternatives, which should they choose?
We conducted our original survey experiment in late 2020 (Experiment 1). For additional confirmation that the results are durable, replicable, and robust to the inclusion of additional school-level features, we conducted a follow-up study in late 2022. Here we included an exact replica of the original experiment (Experiment 2.1) and an additional experiment that expanded the set of school features to include more detail on the school context (Experiment 2.2).
Across all three experiments, we identified four school features that teachers valued at least as much as or more than a 10% increase in salary— working at a school that provided (a) a full-time nurse, (b) a full-time counselor, (c) a full-time special education paraprofessional, and (d) a full-time special education co-teacher. Additionally, we found that teachers with children treat a salary increase and a childcare benefit of similar value as near perfect substitutes. Finally, we found that class size and instructional coaching had more modest effects on teachers’ employment preferences.
This article contributes to an ongoing debate on school finance and personnel that highlights both the substantial expense of noninstructional support staff (e.g., Roza, 2010, 2020) and the critical services these staff provide to students and teachers alike (e.g., Whitaker et al., 2019). On the one hand, investments in support staff are investments in the teaching workforce insofar as noninstructional staff relieve teachers of peripheral responsibilities and enable them to prioritize core instructional tasks. On the other hand, funds dedicated to noninstructional staff could otherwise be allocated to increasing teacher compensation either through salary or other pecuniary benefits, such as childcare subsidies. Absent from this debate is systematic information on how teachers consider these trade-offs and what they would or would not be willing to forgo in direct personal benefits to work at a school that employs various support staff.
Additionally, this study is the first to our knowledge to examine teachers’ preferences regarding childcare benefits. Inattention to the absence of childcare assistance in schools in research and policy may be a missed opportunity—teaching is a female-dominated profession (NCES, 2020), and a robust body of evidence suggests childcare benefits increase women's participation in the labor market (e.g., Brodeur & Connolly, 2013; Gelbach, 2002; Morrissey, 2017).
Context
The personnel policy decisions we examined in our core experiment (Experiment 1) share three common characteristics. First, each represents a specific choice that system leaders must make about how to manage human resources in schools. Second, each is associated with a knowable cost and can therefore be incorporated into a cost framework. Third, building on research by Viano et al. (2020), each corresponds to a “malleable” school feature rather than a fixed feature, such as the school's location or the students it serves. Nevertheless, as a robustness check, we also conducted a follow-up study (Experiment 2.2) that considered whether expanding the list of focal school features to include administrative support, student discipline policy, and student population considerations (i.e., income, race, prior achievement) affects teachers’ preferences for childcare benefits and school support personnel.
Our study does not (and could not) cover an exhaustive list of policy choices that satisfy these criteria because having too many attributes can create a heavy cognitive load for respondents and cause them to satisfice (Krosnick, 1999). We include salary to facilitate our cost analyses and class size to benchmark our work to the existing literature on teachers’ preferences. We exclude, for example, tenure policies, performance incentives, health insurance, and retirement benefits because prior work has carefully attended to the relevance of these personnel policies to teachers’ employment preferences (e.g., Barrett et al., 2021; Johnston, 2020; Viano et al., 2020). In comparison, far too little attention has been paid to teachers’ preferences for school support personnel and childcare benefits; thus, they are our focus here.
Instructional Coaches
Prior work suggests that teachers value the opportunity to work in schools that foster professional growth (Johnson, 2006). Employing an instructional coach to work one-on-one with teachers is one option schools have to support teachers’ development. Smith and Ingersoll (2004) showed that new teacher retention improves when teachers are assigned a mentor, and a meta-analysis by Kraft et al. (2018) suggested impressive gains in student achievement when teachers are provided with this type of individualized support. However, instructional coaching—particularly consistent, one-on-one coaching—is not yet standard in most American public schools. At least one third of teachers work in schools without a single instructional coach on staff (Institute of Education Sciences, 2017). 1 And although it is true that instructional coaches are concentrated in schools that struggle to attract and retain teachers (Domina et al., 2015), it is not clear whether there is strong demand among teachers for this type of support or whether teachers feel scarce resources should be allocated elsewhere. Our study helps address these open questions.
Personnel Support for Students With Disabilities
The two most common types of in-class special education support for general education teachers are special education co-teachers and paraprofessional aides. Over the past decade, federal requirements to include students with disabilities in the general classroom have led to a marked change in the composition of these classrooms (Gilmour, 2018). As of 2020, 7.2 million public students (15%) have been identified as needing special education services under the Individuals with Disabilities Education Act; this is likely an underestimate because not all children with disabilities have been formally identified (National Center for Learning Disabilities, 2017). Of the students who have been formally identified as needing special education services, 95% attend regular public schools, and 66% spend the majority of the school day in a general education classroom (NCES, 2022b).
Although special education staffing is based on student need, the large numbers of students requiring services coupled with rising rates of inclusion have not been met with sufficient increases in funding to provide special education services (Blad, 2020) or improvements in academic achievement for these students (National Assessment of Educational Progress, 2015); this suggests teachers may be struggling to support their learning. In other words, many teachers are acutely aware that they need to support students with disabilities, yet they lack the support to effectively do so. Altogether, these signs point to an unmet need for support for both students with disabilities and their general classroom teachers. Moreover, they underscore the potential importance of special education staffing to teachers’ employment preferences.
At present, there are no data available on the distribution of special education co-teachers across the United States (Jones & Winters, 2022). However, there is a small body of research on teachers’ perceptions of co-teaching, which are largely favorable because co-teaching allows students to receive more individualized attention (McDuffie et al., 2009; Trent, 1998; Walther-Thomas, 1996).
Recent research by Bisht et al. (2021) helps close this data quality gap for paraprofessionals, which represent the fastest growing sector in the U.S. education workforce. The authors found that the average U.S. district employs 19 paraeducators per every 1,000 students and that the strongest predictor of the number of paraeducators per district is the number of students with disabilities within that district. Although analogous statistics on the co-teaching workforce are not available, we assume special education co-teachers are far less common than special education paraprofessionals given that the cost to hire a co-teacher is more than double the cost to hire a paraprofessional (see Table 1).
Values and Unit Costs of Attributes Included in 2020 Survey Experiment
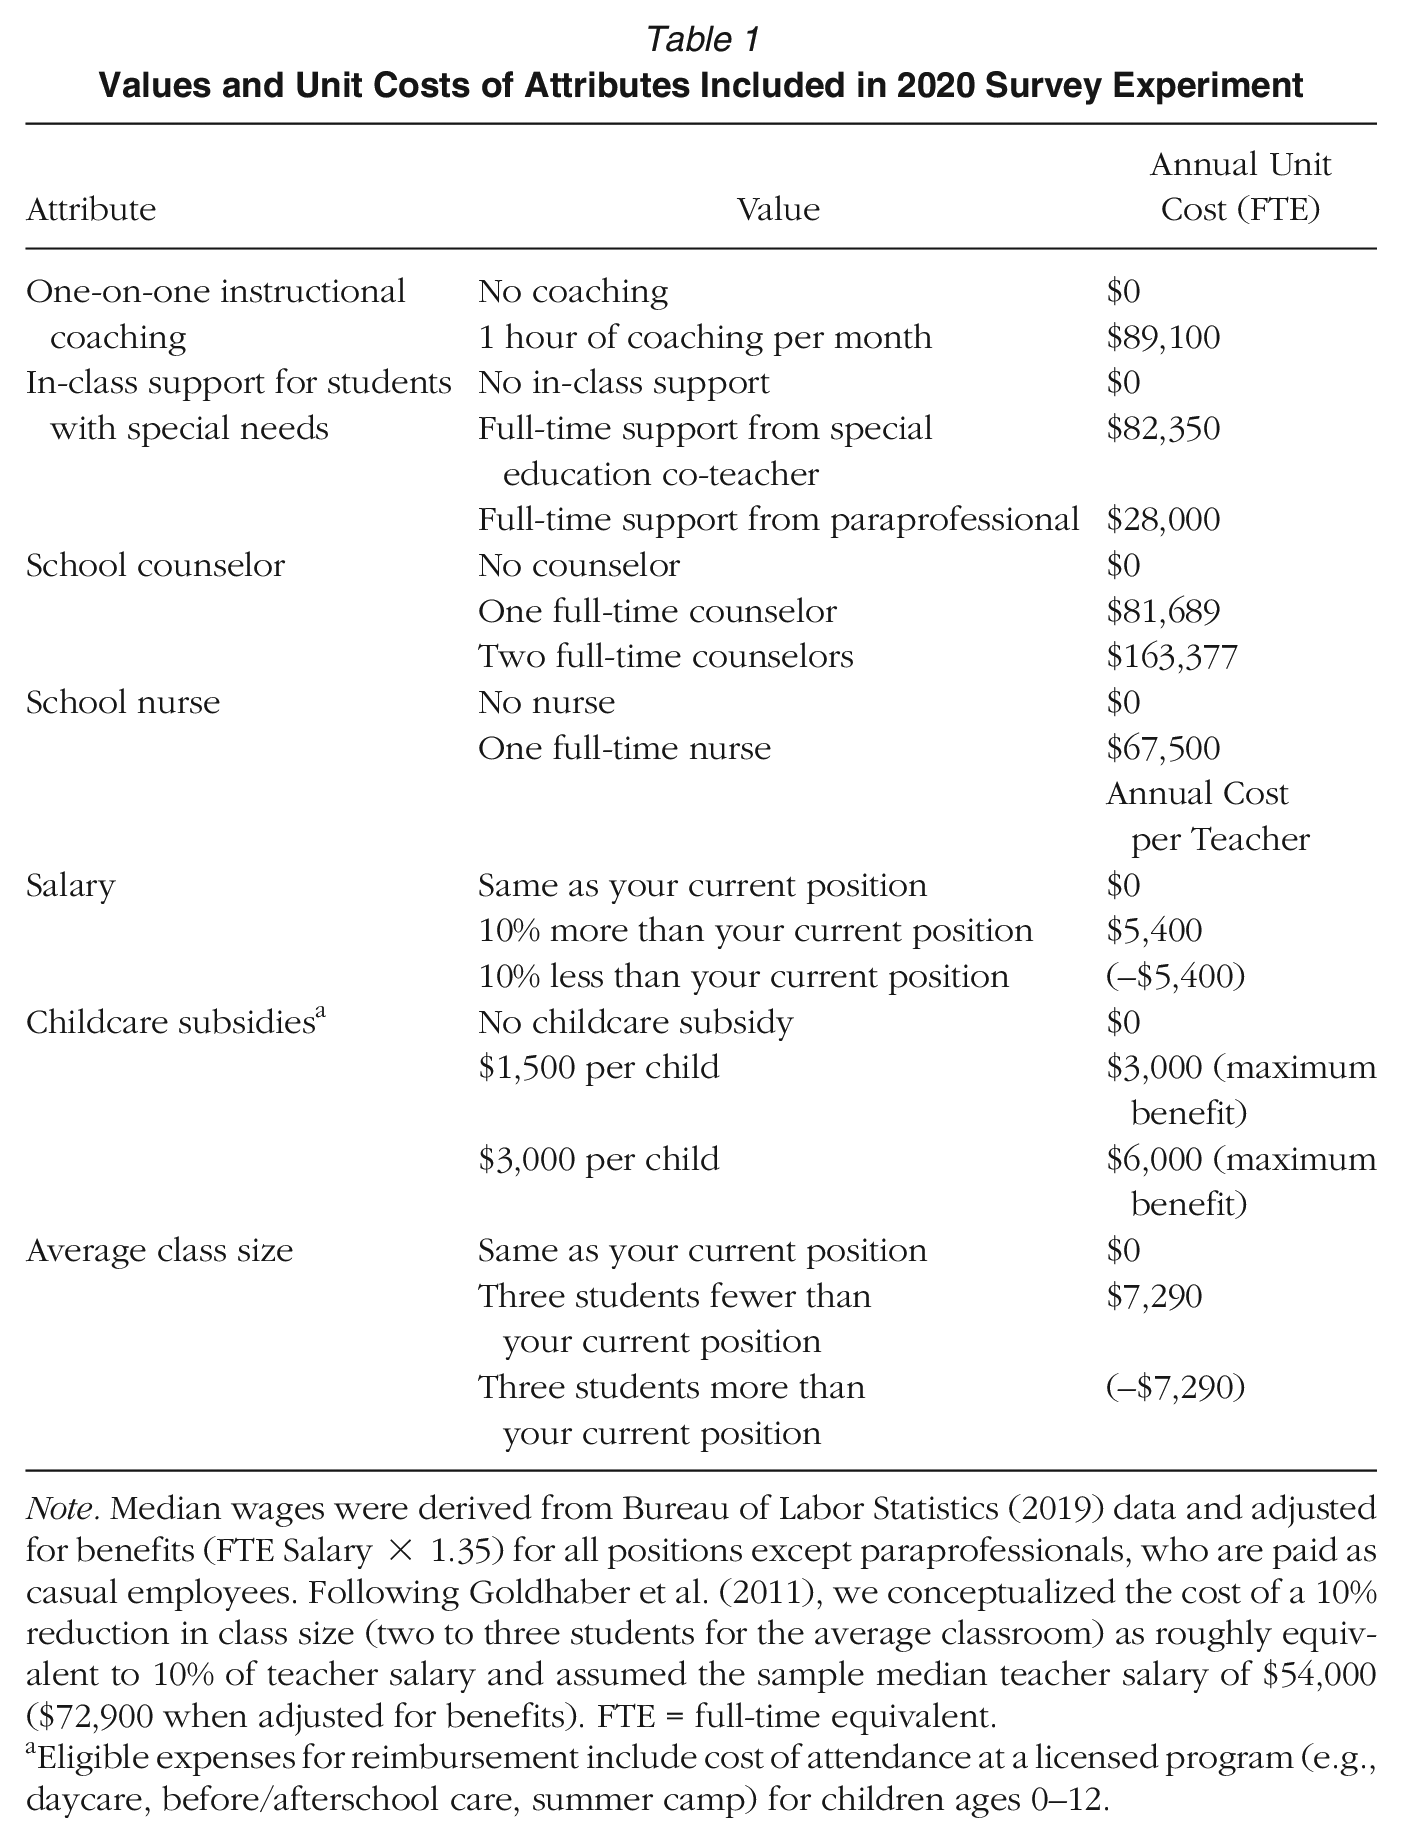
Note. Median wages were derived from Bureau of Labor Statistics (2019) data and adjusted for benefits (FTE Salary × 1.35) for all positions except paraprofessionals, who are paid as casual employees. Following Goldhaber et al. (2011), we conceptualized the cost of a 10% reduction in class size (two to three students for the average classroom) as roughly equivalent to 10% of teacher salary and assumed the sample median teacher salary of $54,000 ($72,900 when adjusted for benefits). FTE = full-time equivalent.
Eligible expenses for reimbursement include cost of attendance at a licensed program (e.g., daycare, before/afterschool care, summer camp) for children ages 0–12.
School Counselors
The best available data on the provision of counselors comes from the Civil Rights Data Collection (US Department of Education, 2018). These data suggests 65% of U.S. elementary schools, 71% of middle schools, and 79% of high schools have a full-time equivalent (FTE) school counselor. Gagnon and Mattingly (2016) further studied the distribution of counselors in the United States and found that 11% of school districts do not employ a single school counselor and that only 20% meet the recommended student-counselor ratio of 250:1. The authors also noted that counselor staffing issues are near universal, even in well-resourced schools serving affluent student populations. This is consistent with data from the U.S. Bureau of Labor Statistics (2019) projecting 32,000 openings for school counselors each year across 98,000 American public schools.
Schools that do adequately staff counselors may be particularly attractive to teachers. Research on teachers’ opinions of school counselors suggests teachers value counselors’ contributions to the school (Gibson, 1990), which range from college and career counseling (American School Counselor Association, 2019) to supporting the whole-school implementation of reform initiatives (Hines et al., 2020) to supporting students’ mental health through local and global tragedies (e.g., Pincus et al., 2020). Finally, Mulhern (2020) presented compelling, quasi-experimental evidence that effective high school counselors increase educational attainment. This evidence is consistent with teachers’ perceptions that counselors are valuable.
School Nurses
We also turned to the CRDC data for information on the distribution of school nurses and found that 67% of elementary schools, 63% of middle schools, and 57% of high schools employ a FTE nurse (US Department of Education, 2018). Further information available via the American Medical Association suggests that 45% of schools have an on-site nurse, 30% have a traveling or part-time nurse, and 25% have no nurse (Wang et al., 2014).
The outlook that an estimated one in four schools have no nurse on staff is troubling. The American Academy of Pediatrics (AAP) formally recommends one full-time nurse in every school (Council on School Health, 2016), and the evidence that is available on how teachers view school nurses, albeit limited, suggests teachers are supportive of this assessment and value the contributions of school nurses. For example, Biag et al. (2015) found that teachers believe nurses are vital because they address and mitigate health barriers that interfere with student learning. An estimated 14 million students (25% of the U.S. student population) suffer from chronic health conditions like asthma and type 1 diabetes, many of whom require daily visits to the school nurse (American Academy of Pediatrics, 2021). Nurses play a critical role in helping students manage these health conditions so they arrive to class ready to learn (Bergren, 2013). Finally, teachers’ sentiment that school nurses provide critical supports that promote both health and learning are consistent with evidence from North Carolina linking improved health and educational outcomes to lower student-to-nurse ratios (Best et al., 2021).
Childcare Benefits
To date, research on teachers’ preferences has largely overlooked the question of whether offering teachers childcare benefits would be a fruitful strategy to recruit or retain teachers. One reason this topic has yet to be carefully examined is that it is extraordinarily rare for school districts to offer childcare benefits to teachers (Schimke, 2018; Sparks, 2018). The lack of attention to the absence of childcare assistance in schools may be a missed opportunity—a robust body of evidence suggests childcare benefits increase women's participation in the labor market (e.g., Brodeur & Connolly, 2013; Gelbach, 2002; Morrissey, 2017), and teaching is a female-dominated profession (NCES, 2020). In fact, the challenge of juggling family and professional responsibilities without institutionalized, family-friendly workplace supports has long been a top reason women exit the teaching profession (Stinebrickner, 2002). We therefore capitalize on the opportunity to present hypothetical teaching jobs in this study to “introduce” this benefit to teachers and report on the response.
Data
Procedures
We preregistered this study with the American Economic Association's registry for randomized control trials. We collected data over a 2-month period (November 2020 to January 2021); we refer to this as our “2020 survey.” Eligible participants received an email invitation with a link to the survey, which took participants approximately 15 minutes to complete. For a complete list of survey items, please see Supplemental Appendix B, available in the online version of the journal.
In each choice task, we presented teachers with the following prompt: “If two schools were otherwise identical in every other way—same building, same principal, same teaching assignment, same students—which school would you prefer?” Teachers then reviewed the two school profiles and indicated their preferred choice. They repeated this choice exercise five times; altogether, teachers rated 10,300 unique school profiles (for a sample choice task, see Appendix C, available in the online version of the journal). Because each successive choice task reduces measurement error, we included the maximum number of choice tasks while keeping the total survey length under 15 minutes. Research by Bansak et al. (2018) showed that on surveys like ours, with relatively few choice tasks, the risk that respondent decision fatigue will affect response quality is low.
Each of the two school profiles in a choice task was defined by the same seven attributes. In selecting the number of attributes, we aimed to provide sufficient coverage such that teachers felt they had enough information to make a decision while taking care not to overwhelm them with excess details. The rule of thumb from the market research literature is to keep the number of attributes fewer than 10 to prevent respondent fatigue (Malhotra, 1982). We narrowed it further, to seven features, after cognitive testing our survey with a pilot sample of teachers.
To set the values of each attribute, we first defined a baseline or comparison condition. For the salary and class size attributes, the baseline condition was the status quo (i.e., “same as your current position”). For all other attributes, the baseline condition was the absence of the workplace support (i.e., “no nurse,”“no childcare benefits”). We then specified the treatment conditions to maximize the treatment–comparison contrast while remaining realistic and pragmatic. For example, we defined the salary treatment to be a 10% increase, which is a substantively meaningful increase in pay but not so large as to be inconceivable. 2 As two further examples, we defined the counselor choice set to vary from zero to one to two counselors and the nurse choice set to vary from zero to one nurse to most closely resemble the distribution of full-time counselors and nurses across American schools, detailed in the previous section. We did not include part-time staffing models in any choice set because designing conjoint experiments requires making difficult trade-offs, and each additional attribute value reduces statistical power. Moreover, the experiment is designed to address a first-order question (i.e., Does it matter to teachers if a school has an unfilled nursing position?) rather than more nuanced questions regarding satisfactory provision of staff (i.e., Is a part-time nurse sufficient?). Table 1 lists the full set of discrete policy choices we examined and their unit cost. 3
Following Goldhaber et al. (2011), we conceptualized the cost of a 10% reduction in class size (two to three students for the average classroom) as roughly equivalent to 10% of teacher salary. Although the general idea is that reducing class sizes by 10% would require hiring 10% more teachers, we acknowledge that calculating the “true” cost of reducing class size depends on a variety of local factors. Given the geographic diversity of our sample, we adopted this approximate cost strategy for illustrative purposes and simplicity.
Sample
We contracted Lucid Marketplace, an online survey sampling platform, to recruit and survey a national sample of 1,030 U.S. K–12 teachers (for details regarding Lucid Marketplace, see Appendix D in the online version of the journal). Respondents were targeted to create a sample that resembles the national teaching force with respect to grade-level assignment and teacher gender and race. Based on national teacher workforce numbers, we had a level quota (50% elementary and 50% secondary school teachers), a gender quota (77% female), and a race quota (80% White). We further screened for occupation, excluding any individuals not currently working as teachers.
To ensure a high-quality online panel of teachers, we deployed four attention checks in our survey to flag inattentive respondents, and we included a Captcha verification question to distinguish between human respondents and bots. We excluded anyone who did not pass all four attention checks and the Captcha verification question (for question wording, see Appendix B in the online version of the journal). Overall, 4,974 individuals passed the screening questions and became survey entrants. Of those, 1,030 respondents (20.71% of survey entrants) met our sample inclusion criteria.
Much like the national teacher workforce, our sample was 75% female, 81% White, and included a fairly even share of primary and secondary teachers. The majority (85%) were working in public schools, and the modal teacher held 10 or more years of experience (Table 2). Compared to the national sample of public school teachers, our sample skewed slightly less experienced and underrepresented teachers from rural areas. We did not include sampling weights because we leveraged a high-quality online sample of verified teachers in which all respondents passed a range of attention checks, used an experimental design, and had minimal theoretical reasons for large treatment heterogeneity (Coppock et al., 2018; Miratrix et al., 2018); however, including sampling weights does not substantively alter our research findings.
Characteristics of Study Samples and U.S. Teacher Workforce
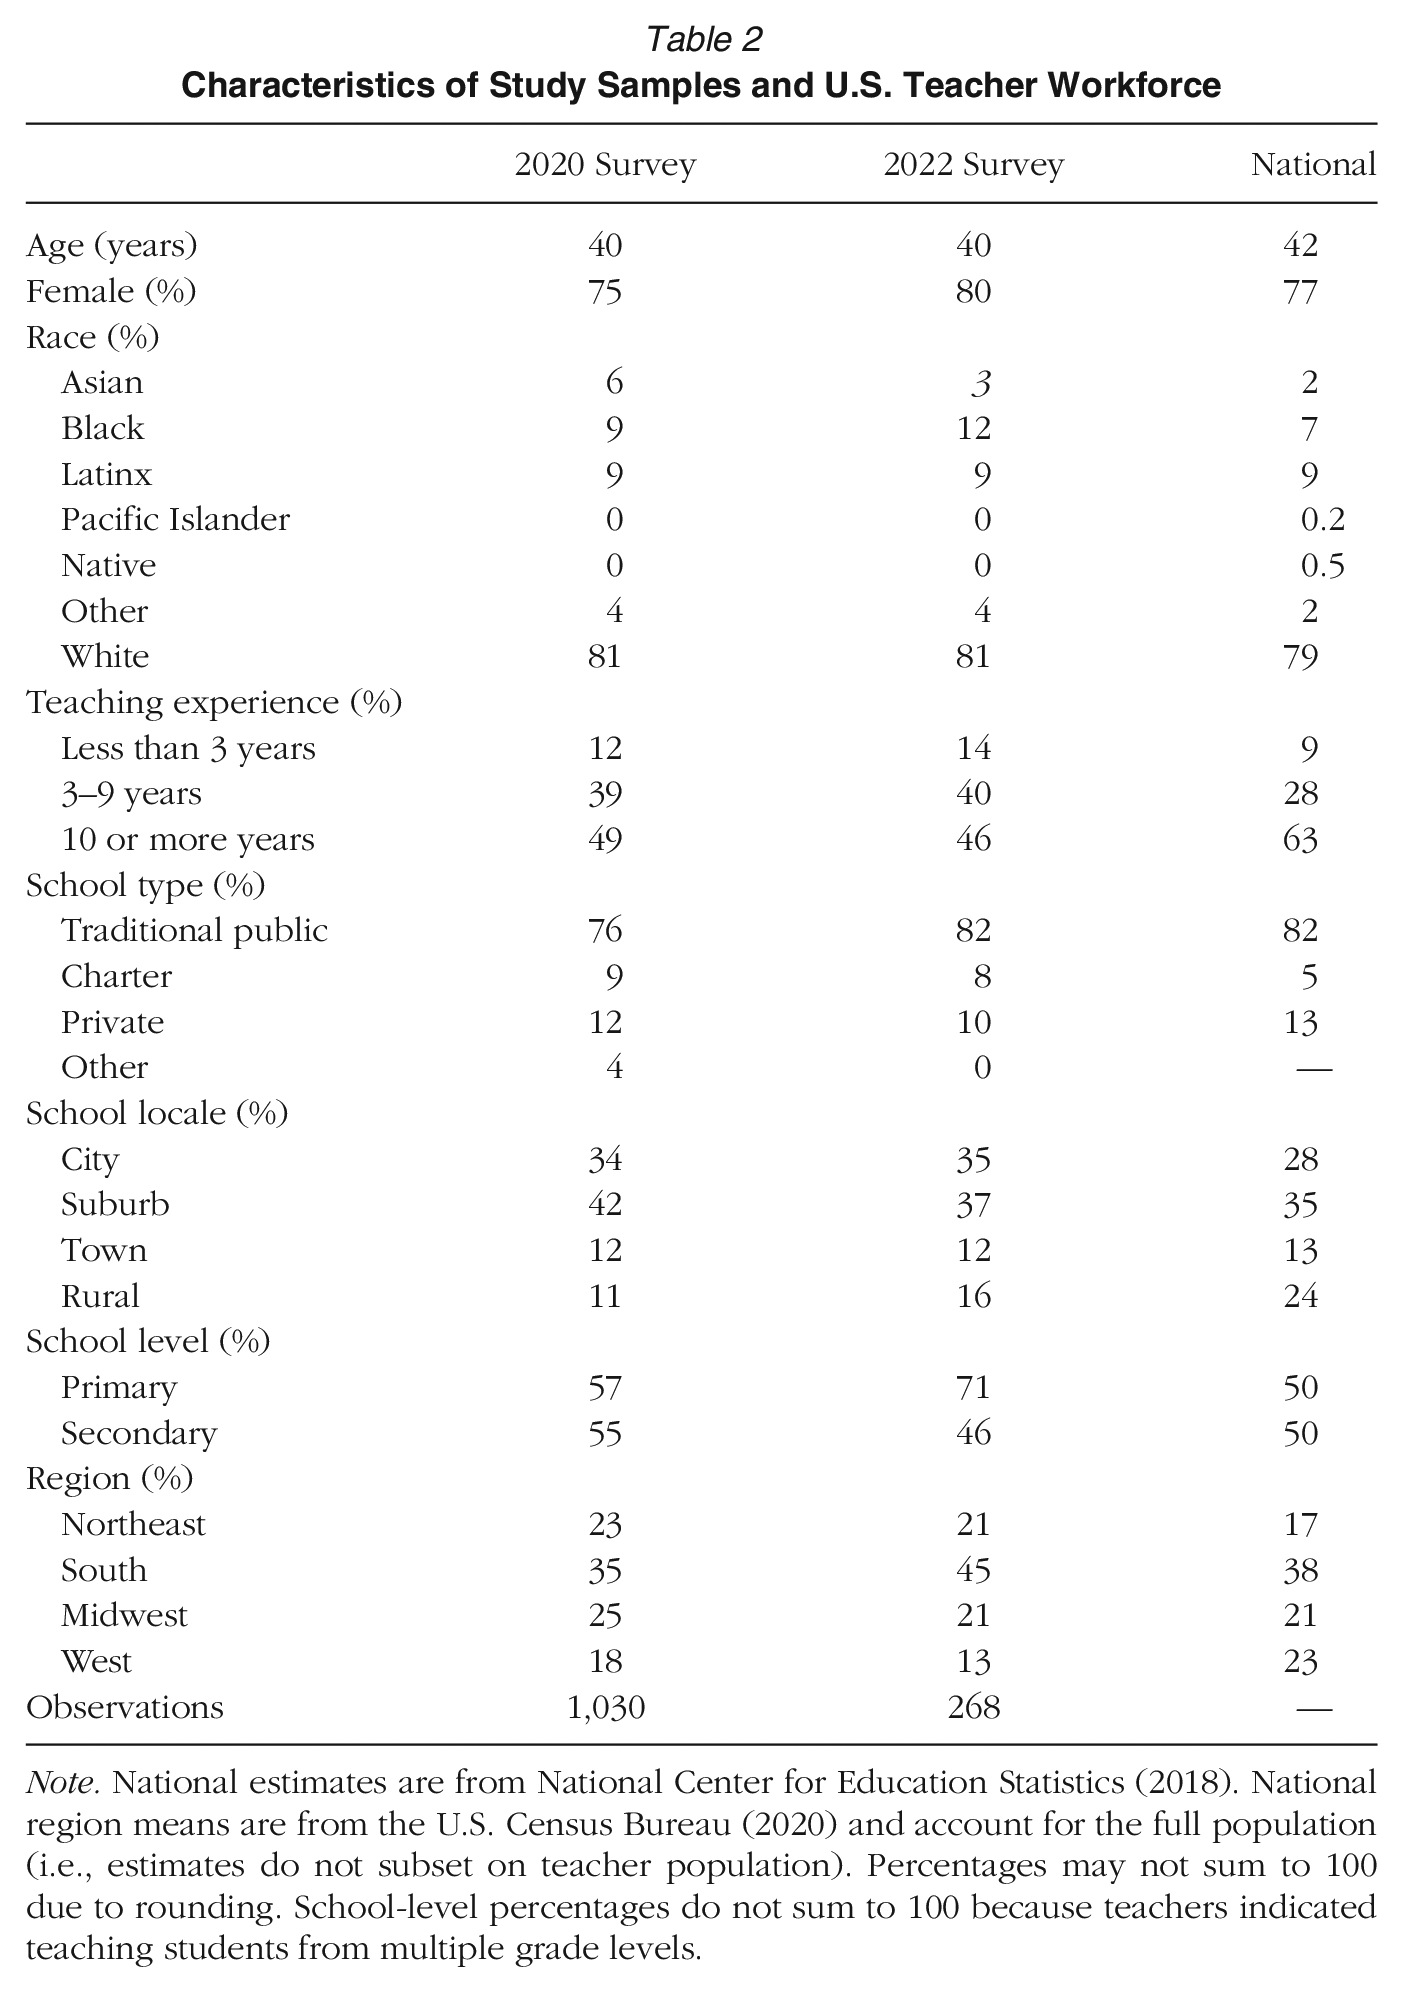
Note. National estimates are from National Center for Education Statistics (2018). National region means are from the U.S. Census Bureau (2020) and account for the full population (i.e., estimates do not subset on teacher population). Percentages may not sum to 100 due to rounding. School-level percentages do not sum to 100 because teachers indicated teaching students from multiple grade levels.
Identification and Model
A core challenge to understanding how teachers decide where to work using observational data is that schools differ along many dimensions. A teacher might find one school appealing for the promised salary and instructional coaching and another appealing for the small class sizes and special education support. Even when we can observe the schools in a teacher's choice set—which is rare—it is ultimately difficult to say with confidence which features of the preferred school ultimately tip the scale. Our choice experiment overcomes this limitation by presenting teachers with hypothetical school profiles with randomly assigned school features.
As Hainmueller et al. (2014) detailed, this fully randomized, discrete choice design (i.e., conjoint experiment) affords several advantages. First, by introducing random variation in school features, we broke the link between school characteristics and unobservable factors that correlate with teachers’ employment preferences. This is an important advantage over observational studies because favorable job features, such as higher pay and better working conditions, tend to bundle together (e.g., Ladd, 2011), making it difficult to disentangle teachers’ preferences. If the design was not fully randomized, and a researcher, for example, set the attribute values presented in each profile, then teachers’ preferences for one attribute value could be influenced by that attribute's pairing with another attribute value in the same profile. Randomizing every attribute for every school safeguards against this risk because it breaks the association between each attribute in a profile and every other attribute in that same profile.
Second, by asking teachers to hold constant in their minds all unstated features of the schools in the pair (the principal, the students, the school location), we further reduced the risk that omitted variables would account for the relationship between a specific school feature and a teacher's decision about whether to work at that school. Third, we simultaneously estimated treatment effects for each of the policy choices examined in the study—a strong efficiency advantage over the modal experimental or quasi-experimental study that focuses on a single treatment at a time. Fourth, we reduced the risk of social desirability bias because discrete choice designs provide survey respondents with multiple reasons to justify any particular choice.
Estimation
We leveraged this design to estimate two quantities of interest. First, we estimated the probability a teacher would want to work at a school when the school offered a specific benefit (e.g., one full-time nurse) relative to a school without that benefit (e.g., no full-time nurse), holding fixed all other school characteristics. Second, we estimated teachers’ willingness to pay for each specific benefit. We discuss each of these estimates in turn.
We estimated the causal effect of each school attribute on the probability a respondent preferred a school profile using simple ordinary least squares regression. Specifically, we regressed the binary choice outcome on a vector of indicator variables for each school attribute using the following model:
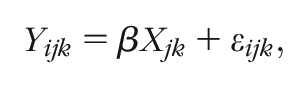
where teachers are indexed with i, profiles with j, and tasks with k. The choice outcome variable,
Because the attribute values were randomly assigned to profiles and profiles were randomly assigned to teachers, the vector of coefficients
Standard errors are clustered at the teacher level to account for the stability in teachers’ preferences across choice tasks. We did not include choice set fixed effects in our model because, unlike in observational settings, where schools in a teacher's choice set inherently contain information about their preferences, randomization guarantees school profiles within a given task are statistically independent. Thus, choice set fixed effects were not warranted.
To contextualize our results, we then converted the AMCEs described above to salary equivalents, also called willingness-to-pay (WTP) estimates, by dividing the coefficient on each attribute by the coefficient on a 10% salary increase (for a similar methodological approach, see Fuchsman et al., 2020; Johnston, 2020). These salary equivalents provide insights into the estimated amount of additional income teachers would be willing to forgo to secure a specific job benefit. The general idea is that to arrive at a decision regarding two schools that vary along multiple dimensions, teachers have to consider their preferences on salary and each of the other attributes presented in the task and how willing they would be to trade salary for other favorable attributes (Bansak et al., 2021).
We see clear evidence of these trade-offs in the data. For instance, over one third of the school profiles featuring a 10% decrease in salary were selected as preferred, suggesting teachers were willing to trade salary for the right set of workplace supports (see Appendix Figure A1, available in the online version of the journal). We leveraged this feature of the discrete choice survey design to represent the strength of teachers’ preferences for each job feature in terms of their preferences for earning more in salary (i.e., salary equivalents).
Representing the AMCEs in dollar terms contextualizes the results in a way that enables a discussion of costs and benefits. Namely, we highlight features where the amount teachers are willing to forgo in additional salary to receive the benefit exceeds the per-teacher cost of the investment. In this exercise, we assume the cost of the investment would be evenly distributed across teachers. We outline additional assumptions underpinning these results in the next section.
Assumptions
Interpreting our estimates as teachers’ WTP requires the assumption that teachers’ preferences for salary increases are linear from 0% to approximately 21%, the largest WTP estimate in the study. We can use the survey data to partially explore the plausibility of this assumption. The data contain estimates of teachers’ preferences over three discrete salary propositions: a 10% increase in salary, a 10% decrease in salary, and no change. A formal test of linearity indeed reveals evidence of loss aversion, and we reject the null hypothesis that teachers’ salary preferences are linear along the interval from −10 to 10 (β = −1.41, SE = 0.197). Crucially, however, the WTP interpretation assumes linearity only along the positive interval from 0% to 21%. Thus, teachers’ understandable aversion to salary loss does not violate this assumption, nor would potential asymmetries in teachers’ preferences for extremely large (in most cases, unrealistic) salary increases.
Causal interpretation of the results also requires the assumption that teachers’ preferences are independent of the specific features assigned to the hypothetical schools. This assumption should hold, given that features were randomly assigned to school profiles and school profiles were randomly assigned to teachers. Accordingly, a series of omnibus F tests suggests no evidence of a systematic relationship between school features and teacher characteristics such as age, gender, race, or experience (Table 3).
Relationship Between Attribute Values and Teacher Characteristics (Omnibus F Test)
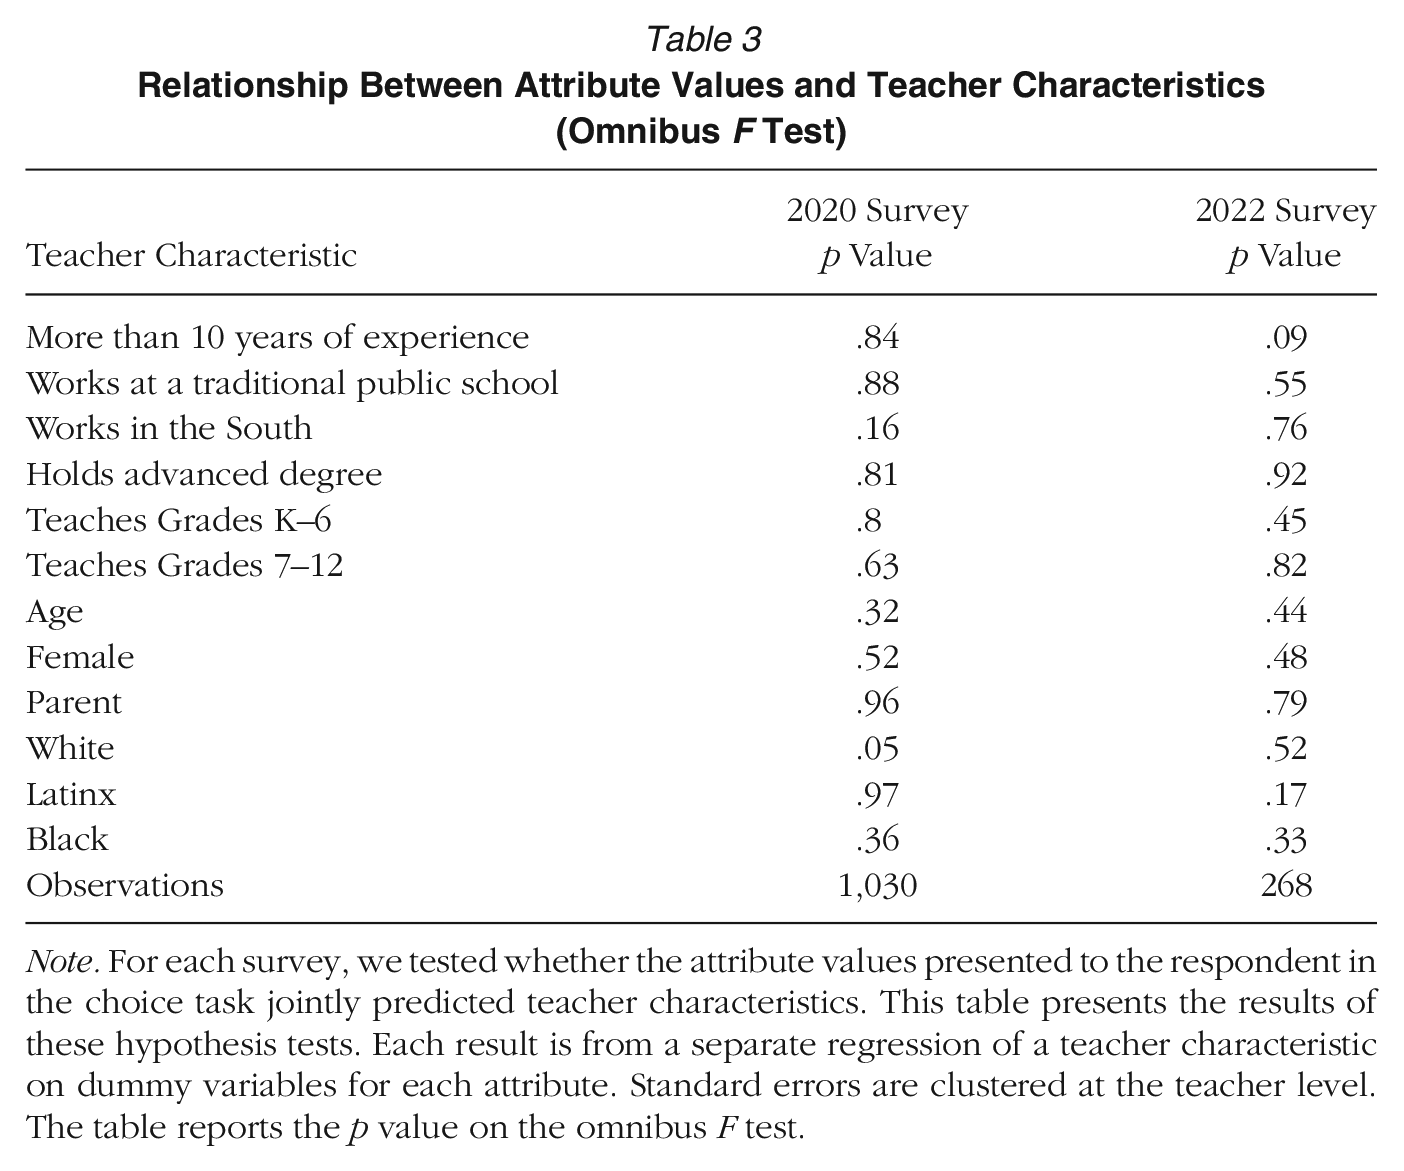
Note. For each survey, we tested whether the attribute values presented to the respondent in the choice task jointly predicted teacher characteristics. This table presents the results of these hypothesis tests. Each result is from a separate regression of a teacher characteristic on dummy variables for each attribute. Standard errors are clustered at the teacher level. The table reports the p value on the omnibus F test.
Causal interpretation of the results also hinges on a third assumption— that of information equivalence (Dafoe et al., 2018). That is, we must assume that teachers did not update their beliefs about the background characteristics of a particular school within a pair upon reading the description of the school profile. The potential threat is that teachers may have inferred additional characteristics about the schools presented in the choice task despite instructions to assume the schools in the pair are otherwise identical. To reduce this risk, before every choice task, we reemphasized to teachers that the schools in the pair were located in the same building, served the same students, and were led by the same principal. Nevertheless, we cannot reject the possibility that teachers may have mentally associated the included features of the school with other unincluded characteristics that may be correlated, at least in their experiences. In this regard, the experimental design does not entirely overcome the risk of omitted variable bias. Encouragingly, however, Dafoe et al. (2018) showed that specifying the background variables (as we did in Experiment 1 and to an even greater extent, in Experiment 2.2) lessens this risk substantially.
Results
We identified four investments that teachers valued at least as much as or more than a 10% increase in salary: funding for a full-time nurse, a counselor, a special education paraprofessional, and a special education co-teacher. We also identified two investments that teachers valued less than a 10% salary increase: funding for a three-student reduction in class size and 1 hour of instructional coaching per month. We additionally found that teachers’ preferences for childcare benefits hinged on two predictable factors: (a) whether the teacher currently had children and (b) the size of the childcare benefit. Teachers currently with dependents under 12 valued a $3,000 childcare benefit (with a $6,000 annual cap) similarly to a 10% increase in salary but strictly preferred a 10% increase in salary to a more modest childcare benefit of $1,500 per child.
Figure 1 provides a visual summary of teacher preferences over the specific attributes presented in the choice tasks. The plot presents the overall average effect of each attribute on teachers’ hypothetical job choices relative to a reference category, accounting for all other stated features of the school. For example, presenting a hypothetical school with a 10% salary increase rather than no change in salary, ceteris paribus, increased the probability a teacher chose that school by 12 percentage points. Additionally, all other things being equal, presenting a hypothetical school as providing full-time, in-class support from a special education co-teacher rather than providing no in-class special education support increased the probability a teacher chose that school by 25 percentage points. Estimates of the overall effect of each attribute are in reference to a specific baseline value (e.g., no salary increase, no in-class special education support), which we display along the x-intercept of each rectangular panel in Figure 1. We also report marginal means in Appendix Figure A1, available in the online version of the journal, which are simple descriptive statistics and indicate the level of favorability toward profiles that have a particular conjoint profile feature, ignoring all other features.
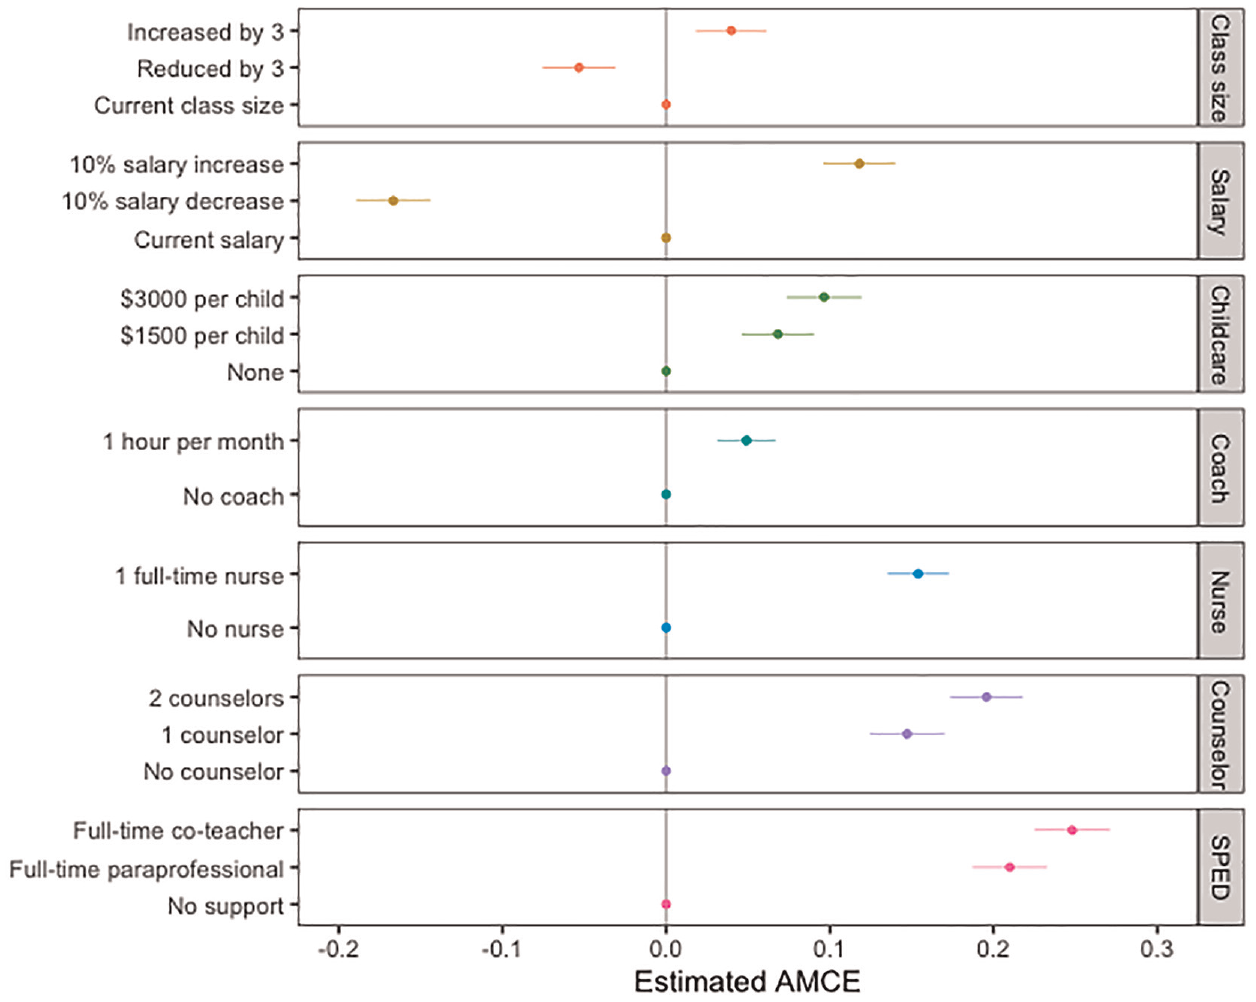
Effects of school attributes on teachers’ employment preferences (2020 survey).
Table 4 presents the main results, including the WTP estimates in terms of a percentage increase in salary; the estimated WTP in dollar terms, or salary equivalents, assuming a teacher salary of $54,000 a year, which was the estimated median salary of teachers in the sample for all three experiments; the average unit cost of each investment per teacher; and the lower and upper bound cost estimates. For school counselors and nurses, where per-teacher costs vary dramatically by school size, we present a range of cost estimates pertaining to the national average number of teachers per school, which was 33 (NCES, 2020); half the national average (“small schools”); and twice the national average (“large schools”). For all other attributes, where per-teacher costs hinge primarily on local market wages, we approximate lower and upper bound costs using salary data for school personnel in Mississippi and New York City, respectively.
Willingness-to-Pay (WTP) Estimates
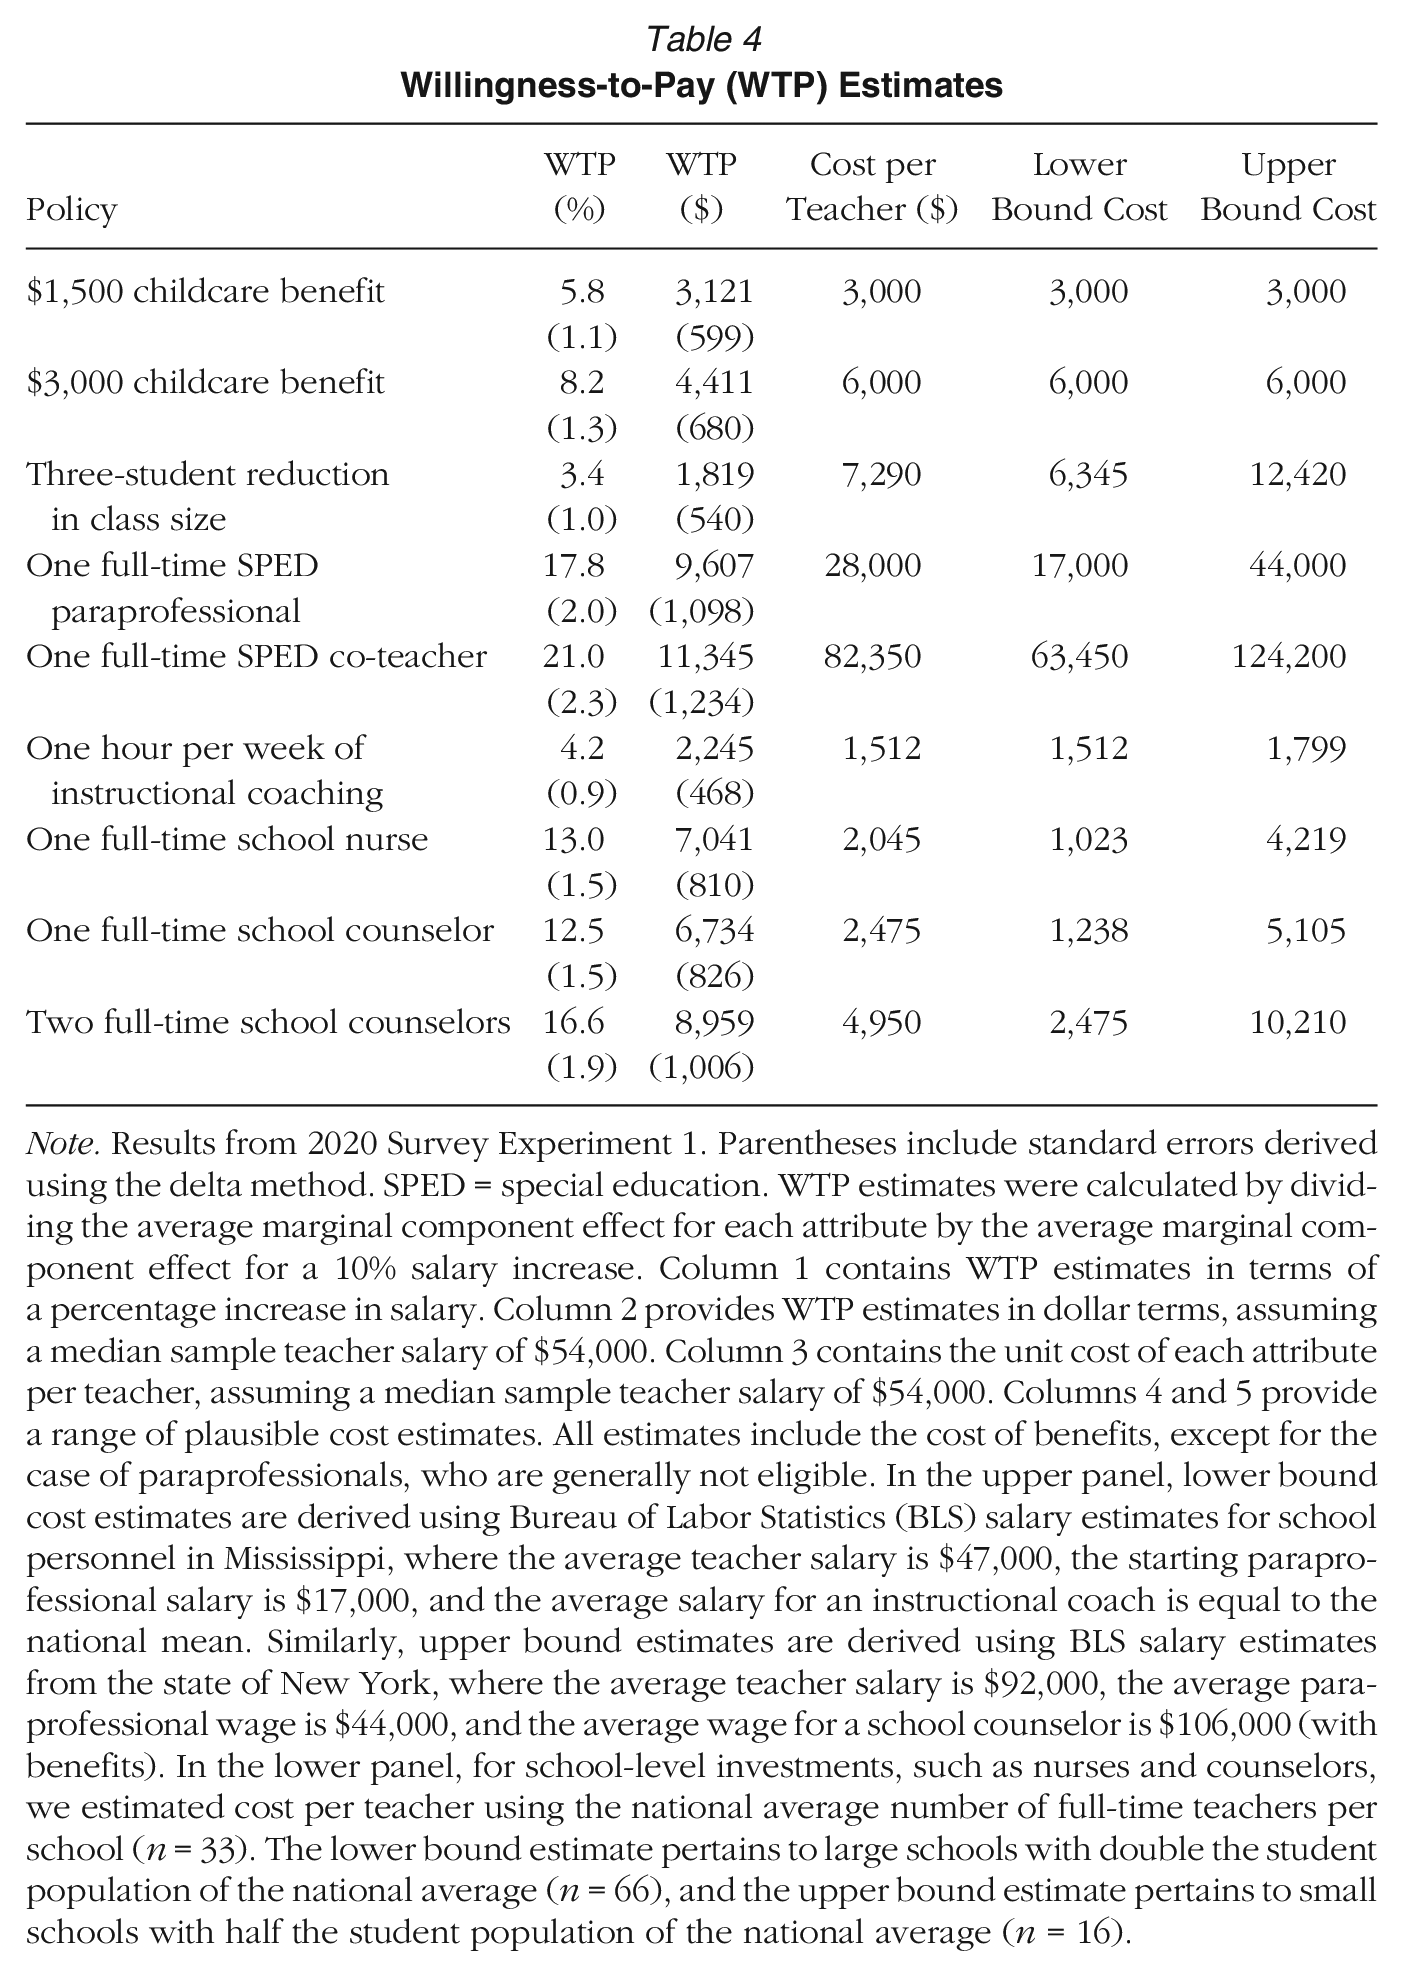
Note. Results from 2020 Survey Experiment 1. Parentheses include standard errors derived using the delta method. SPED = special education. WTP estimates were calculated by dividing the average marginal component effect for each attribute by the average marginal component effect for a 10% salary increase. Column 1 contains WTP estimates in terms of a percentage increase in salary. Column 2 provides WTP estimates in dollar terms, assuming a median sample teacher salary of $54,000. Column 3 contains the unit cost of each attribute per teacher, assuming a median sample teacher salary of $54,000. Columns 4 and 5 provide a range of plausible cost estimates. All estimates include the cost of benefits, except for the case of paraprofessionals, who are generally not eligible. In the upper panel, lower bound cost estimates are derived using Bureau of Labor Statistics (BLS) salary estimates for school personnel in Mississippi, where the average teacher salary is $47,000, the starting paraprofessional salary is $17,000, and the average salary for an instructional coach is equal to the national mean. Similarly, upper bound estimates are derived using BLS salary estimates from the state of New York, where the average teacher salary is $92,000, the average paraprofessional wage is $44,000, and the average wage for a school counselor is $106,000 (with benefits). In the lower panel, for school-level investments, such as nurses and counselors, we estimated cost per teacher using the national average number of full-time teachers per school (n = 33). The lower bound estimate pertains to large schools with double the student population of the national average (n = 66), and the upper bound estimate pertains to small schools with half the student population of the national average (n = 16).
School Nurses
Evidence from this experiment indicates that teachers prefer to work at a school with a nurse on staff. On average, we estimate that teachers were willing to trade off a 13% increase in salary ($7,041) to work at a school with a nurse—almost 3 times the per-teacher cost of employing a full-time nurse. Although these estimates, and those that follow, pertain to the average teacher in our sample, the substantive conclusion that teachers value nurses above and beyond what they cost to provide holds under a wide range of plausible alternative assumptions (see Table 4 for upper and lower bound cost estimates for all study attributes).
Counselors
Much like school nurses, teachers strongly value school counselors and are willing to trade off additional income to work at a school with one. We estimate that working at a school with one full-time counselor was worth $6,734 in salary equivalents to teachers, more than double the per-teacher cost of employing a school counselor at a school of average size. Similarly, we estimate that working at a school that employs two full-time counselors was worth $8,959 in salary equivalents to teachers, which is almost 1.8 times the per-teacher cost of hiring two counselors at a school of average size. Notably, the cost advantage scales with the size of the school. These results point to nonlinearities in teachers’ preferences. The value teachers placed on working at a school with two counselors was less than double that of a school with just one counselor, suggesting the marginal utility of the provision of school counselors tapers off as the number of counselors increases.
Special Education Support
Of all the investments we studied, teachers expressed the highest WTP for special education staffing support. The average teacher indicated a willingness to trade a 17.8% increase in additional salary ($9,607) for full-time support from a special education paraprofessional and a 21.0% increase in salary ($11,345) for full-time support from a special education co-teacher. However, providing this level of support is expensive, with average costs ranging from approximately $28,000 per year for a full-time paraprofessional aide to $82,350 per year for a full-time co-teacher with benefits. That said, system-level decisions to hire special education specialists depend first and foremost on student need. These results highlight strong positive externalities for teachers where these investments are made.
Childcare Benefits
The average teacher indicated they would be willing to trade off a 5.8% increase in salary ($3,121) for a $1,500 per-child benefit and an 8.2% increase in salary ($4,411) for a $3,000 per-child benefit. Table 5 presents the childcare results separately by eligibility status, where eligible teachers are those with at least one child under 12. Intuitively, the size of the childcare benefit was meaningful to eligible teachers but irrelevant to ineligible teachers. Eligible teachers would be willing to trade off a 5.8% increase in salary ($3,148) for a $1,500 per-child benefit and an 11.0% increase in salary ($5,924) for a $3,000 per-child benefit (Table 5).
Heterogeneity in Preferences for Childcare Subsidies, by Dependent Status
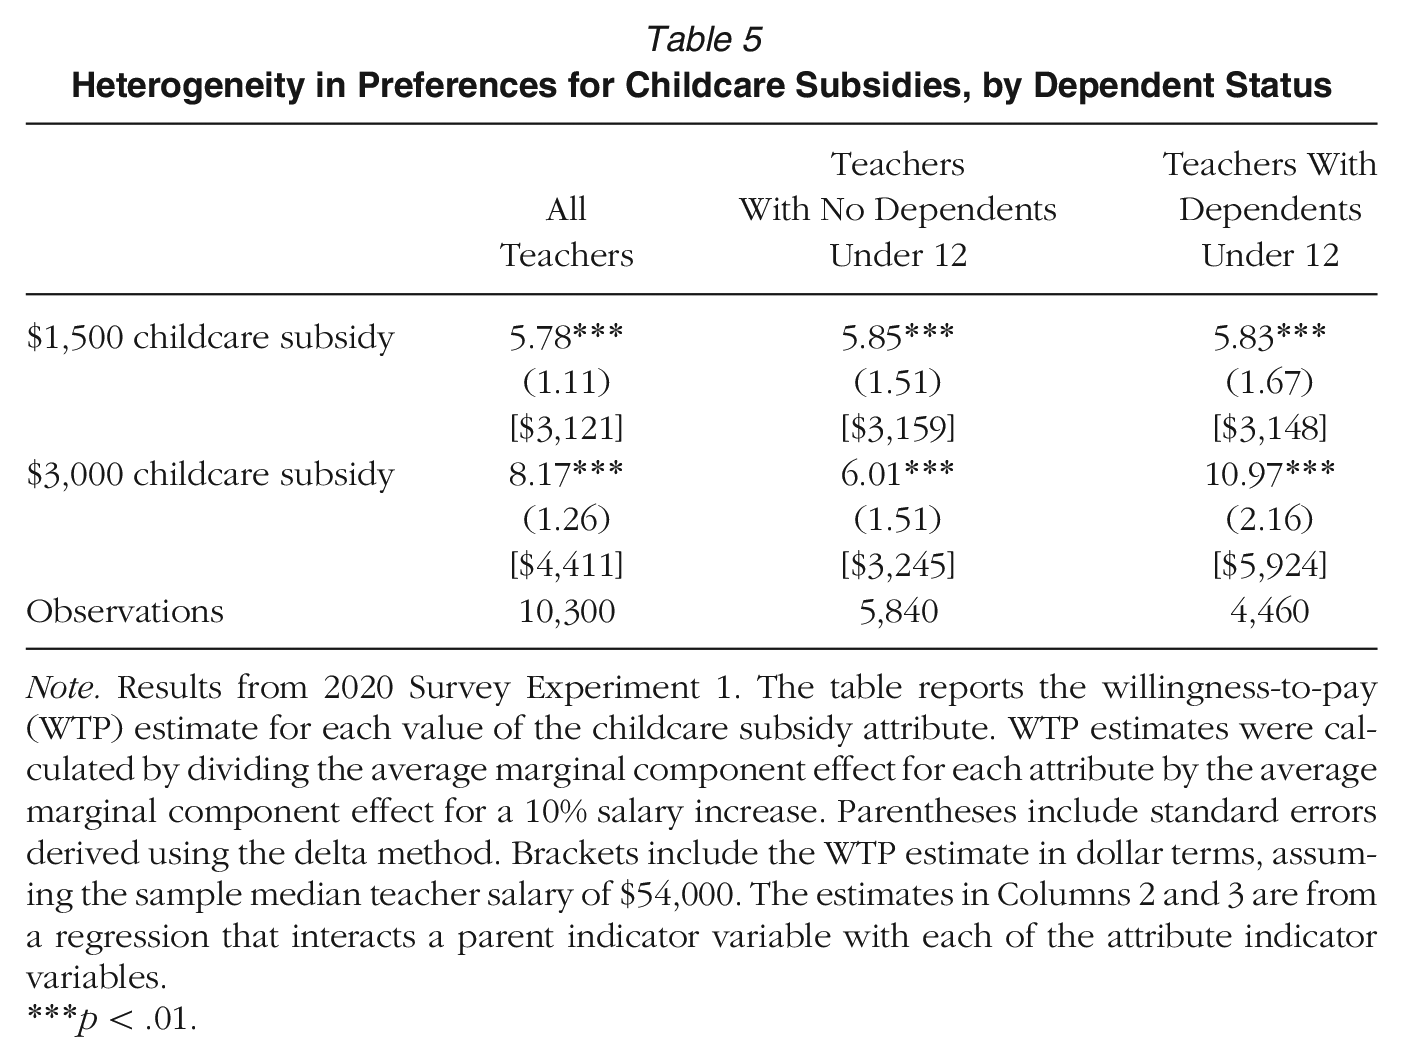
Note. Results from 2020 Survey Experiment 1. The table reports the willingness-to-pay (WTP) estimate for each value of the childcare subsidy attribute. WTP estimates were calculated by dividing the average marginal component effect for each attribute by the average marginal component effect for a 10% salary increase. Parentheses include standard errors derived using the delta method. Brackets include the WTP estimate in dollar terms, assuming the sample median teacher salary of $54,000. The estimates in Columns 2 and 3 are from a regression that interacts a parent indicator variable with each of the attribute indicator variables.
p < .01.
Meanwhile, the demand for childcare benefits among ineligible teachers is inelastic to price (Table 5). Ineligible teachers indicated they would be willing to trade off approximately 6% in additional salary to work at a school that offered either the $1,500 per-child benefit or the $3,000 per-child benefit. However, these results suggest that even teachers who would not immediately benefit (directly) from the subsidy still valued it.
As a final point, for a teacher with two children under the age of 12, the costs to provide the small and large benefits ($3,000 and $6,000, respectively) were remarkably consistent with our estimates of how much teachers valued these benefits in dollar terms (Table 5). This strong alignment provides reassuring evidence that teachers responded rationally to the choice tasks while also lending face validity to the WTP calculations.
Instructional Coaches
On the whole, teachers appeared to strictly prefer investments in counselors, nurses, and special education specialists to investments in instructional coaching. However, although the offer of coaching did not appear to strongly influence teachers’ employment preferences, the value teachers placed on coaching exceeded the cost. In particular, we estimate that coaches are worth about $2,245 in salary equivalents to teachers, which is 1.5 times what our back-of-the-envelope calculations suggest is the approximate per-teacher cost of instructional coaching. 4
Class Size
Although we observed that teachers generally preferred smaller classes to larger classes, among all of the school features we studied, teachers showed the lowest WTP for smaller class sizes. Teachers valued a three-student reduction in class size on par with a 3.4% increase in pay, or $1,819 in salary equivalents. These class-size effects are consistent with prior studies indicating that teachers generally prefer receiving more pay to teaching smaller classes, particularly when the proposed class-size reductions are modest (Goldhaber et al., 2011; Johnston, 2020; Viano et al., 2020).
Heterogeneity in Teacher Preferences
Appendix Figure A2, available in the online version of the journal, presents preferences separately for primary (Grades K–6) and secondary (Grades 7–12) teachers. Per Leeper et al. (2020), all subgroup comparisons consider marginal means rather than ACMEs because comparing AMCEs by subgroup can be misleading because regression interactions are sensitive to the reference category used in the analysis. Marginal means are descriptive statistics that indicate the proportion of profiles containing a particular attribute value that teachers selected as preferred.
Although teacher preferences appear fairly consistent across grade spans, we observed a few modest (and statistically insignificant) differences in the strength of their preferences. In particular, elementary school teachers appeared to hold slightly stronger preferences for working at a school with a full-time nurse and to care more about class size and instructional coaching. Meanwhile, secondary teachers were somewhat more averse to taking a reduction in salary and held slightly stronger preferences for working at a school that employed school counselors.
Appendix Figures A3 through A6, available in the online version of the journal, provide further breakdowns of teacher preferences by school type, school region, teacher experience, and teacher age. First, we ran a specification check by school type (Appendix Figure A3) and showed that preferences in our sample were consistent across public and private school teachers. Second, we attended to whether teachers’ preferences for a 10% increase in salary varied by subgroup. We found suggestive evidence that preferences for a 10% salary increase are stronger among teachers with more experience, which is intuitive because a higher base salary translates to a larger 10% raise. However, the reverse logic could also be true. For instance, we see rural teachers find the prospect of a 10% increase in salary particularly compelling, perhaps because teachers working in rural areas are more likely to be underpaid at baseline.
With respect to teachers’ preferences for the other attributes under study, we found that novice teachers are more favorable of smaller classes than more experienced teachers and are especially favorable of school support staff, evidence consistent with the notion that early career teachers require more support. We arrived at these conclusions by observing the probability a novice teacher preferred a school feature (e.g., one nurse) relative to the baseline value for novice teachers for that feature (e.g., no nurse). Finally, we observed that teachers in rural areas are less favorable of special education paraprofessionals and less enthusiastic about working at a school with two counselors.
Treatment–Treatment Interactions
Appendix Tables A2 and A3, available in the online version of the journal, list the 10 most preferred and least preferred school profiles, respectively. The 10 most attractive school profiles all had at least one counselor on staff and some combination of two out of three additional supports (nurse, instructional coach, or special education support). Also of note, but perhaps not surprising, none of the top 10 most attractive profiles featured a salary decrease. Meanwhile, each of the 10 least attractive school profiles featured a 10% decrease in salary and no counselor on staff. The least preferred profiles, in particular, suggest that some combination of adverse school features may be dealbreakers for teachers even if the school provides a particular amenity like a nurse, special education specialist, or instructional coach.
This prompts additional questions about whether certain combinations of attributes are particularly appealing or unappealing to teachers. To address this question, we estimated average marginal interaction effects (AMIEs), an estimand proposed by Egami and Imai (2019) that captures the causal interaction between two or more treatments in a conjoint experiment. A nice feature of the AMIE is that the estimated effects are invariant to the specified baseline category; this is an advantage in empirical settings without a natural control or comparison group, like this one. We report the results of this analysis in Appendix Table A4, available in the online version of the journal.
Because of the large number of possible treatment–treatment interactions, we used a data-driven selection process (i.e., LASSO regression) to reduce false discovery rates. We identified just two significant treatment interactions: Nurse × Salary and Nurse × Counselor. However, these interaction effects had a fairly narrow estimated range of 2 to 3 percentage points. We take the absence of strong interaction effects as evidence consistent with what we would expect to observe if teachers adopted a holistic approach to selecting their preferred school rather than basing their choices on a small handful of attributes.
Validity and Generalizability
Internal Validity
Our analysis pooled together data for every school profile teachers rated. We implicitly treated each as an independent observation, assuming that teachers’ preferences were not influenced by the order in which the profiles were presented within a task, the order the attributes were presented within a task, or the order of the tasks themselves (Hainmueller et al., 2014). We discuss each of these assumptions in turn.
No Task-Order Effects
We assumed that for any possible combination of school profiles, a teacher would always prefer the same profile in the pair irrespective of the order in which the task was presented. There are at least two scenarios that would violate this assumption. One possibility is that teachers would view a particular attribute value in a task that would then change their decision-making process for all subsequent tasks. To identify possible task-order effects, we estimated AMCEs separately by task and then examined confidence intervals for each attribute value across tasks. Figure A7, available in the online version of the journal, shows that the pattern of results was remarkably similar across tasks, allaying concerns that teachers’ preferences were influenced by task order. Another possibility is that teachers would experience decision fatigue as they progressed through the tasks and grow increasingly inattentive. Encouragingly, Bansak et al. (2018) studied this possibility and showed that the risk of survey satisficing due to respondent decision fatigue was minimal on surveys that included many more choice tasks than the current survey.
No Profile-Order Effects
We also assumed that for any teacher and task, a teacher would always prefer the same profile irrespective of the order in which the pair was presented (first or second). To examine whether teachers were influenced by profile order, we estimated AMCEs separately by profile. As shown in Figure A8, available in the online version of the journal, the sign, magnitude, and statistical significance of each attribute value was consistent across profiles, supporting the assumption that profile order is ignorable.
No Attribute-Order Effects
To minimize the risk for attribute order effects, we rerandomized attribute order for every teacher and every task. Thus, the assumption that the order of the attributes within a task was unrelated to teachers’ preferences is plausible. To test this assumption, we estimated AMCEs for each attribute by row. For brevity, Figure A9, available in the online version of the journal, displays only a subset of these results. Overall, we found no evidence of a systematic relationship between teachers’ preferences and the order with which attributes were presented on a profile.
External Validity
An implicit assumption of our design is that the choices teachers make in an online experimental setting offer good approximations of teachers’ actual choices in real-world settings.
Although we cannot test this assumption directly, the broader research literature on choice experiments suggests a strong link between stated and revealed preferences. Viano et al. (2020), for example, undertook a validation exercise by pairing experimental data from a choice experiment like ours with administrative data on teachers’ actual employment histories. They found that teachers’ expressed preferences were strong predictors of their employment choices. Discrete choice experiments deployed in other public policy areas of health care (Quaife et al., 2018; Telser & Zweifel, 2007), immigration (Hainmueller et al., 2015), and transportation (Louviere & Woodworth, 1983) showed similarly strong links between individuals’ stated preferences on choice experiments and their revealed preferences in the authentic settings of interest. Additionally, Hainmueller et al. (2015) found that paired conjoint designs, which is the design we employed, performs the best at estimating preferences that match real-world behavior.
Although this literature establishes that it is possible to estimate real-world preferences using a discrete choice design, the degree to which any given experiment succeeds in this effort hinges crucially on the study details. Thus, we discuss four features of our discrete choice experiment that may influence generalizability: the relevance of the study attributes, the realism of the choice tasks (i.e., face validity), the sample of participants, and the timing of the study. For each, we describe the steps we took to address each potential threat.
Relevance of Focal Attributes
As an initial check to assess the validity of our finding that teachers place a high premium on school support personnel, we leveraged a series of items on the survey that asked teachers how valuable they found various support staff. In line with the experimental evidence highlighting the value that teachers place on nurses, counselors, and special education paraprofessionals and co-teachers, an overwhelming majority of teachers rated nurses (88%), counselors (89%), special education paraprofessionals (92%), and special education co-teachers (93%) as “beneficial” or “very beneficial” (see Appendix Table A1, available in the online version of the journal). These descriptive findings support our central claim regarding the importance of these support staff to teachers.
Face Validity
One important consideration for the external validity of a discrete choice experiment is the distribution of the attributes across tasks (de la Cuesta et al., 2022). As in most discrete choice experiments, we employed a uniform distribution, and thus the AMCEs we estimated implicitly assigned equal weights to each school profile. If, in practice, teachers systematically found some of the randomly generated school profiles more realistic than others, then the uniform weighting would be a suboptimal choice.
Considering this possibility, we selected the attributes and the range of values assigned to the attributes such that no possible combination of attributes would feel far-fetched enough that teachers would discredit the realism of the experiment. A counterexample would be a school offering a 30% increase in salary or a school with six counselors on staff. To assess whether we succeeded in creating feasible school profiles, we workshopped our attributes and values with a sample of 10 teachers across all four major U.S. census regions (Northeast, Midwest, South, West) until we reached consensus that the profiles felt like realistic choices in all locales.
The one major exception to this was our decision to include the childcare subsidy attribute. Given the rarity of childcare benefits in schools, it is possible that teachers found the prospect of them becoming available unrealistic. To test whether this influenced their preferences, we subset our sample on the one third of school profiles that offered no childcare benefits (n = 3,410) and reestimated AMCEs for this group. As shown in Figure A10, available in the online version of the journal, although estimated less precisely, the AMCEs were consistent with those in the full sample, allaying concerns that this design choice influenced teachers’ decision-making processes.
Study Participants
Also noteworthy is that our sample comprises only teachers who were online and part of a survey panel. Although teachers are unlikely to be part of the small minority of U.S. residents who are offline, many may not participate in online surveys. This limitation is only a problem to the extent that the preferences of teachers who participate in online research differ from the preferences of teachers who either choose not to participate in online research or are unaware of such opportunities. There is no obvious theoretical reason to believe that teacher preferences are heterogeneous by Internet access and/or willingness to participate in surveys. Indeed, our results are consistent with those reported by Johnston (2020), who deployed a choice experiment with a large urban school district in Texas and achieved an impressive response rate of 98%. Both the present study and Johnston's research estimated teachers’ WTP for class-size reductions, and the results are nearly identical. We take the stability of the class-size results across both time and place as encouraging evidence that the results of our experiment are unlikely to be substantially biased due to our subject pool being an online survey panel.
Study Timing
As mentioned, we collected our core data from late November 2020 to January 2021, a period marked by the COVID-19 pandemic. The ideal way to test whether the pandemic influenced teachers’ preferences would have been to run the experiment before the pandemic and after the pandemic and then compare the results (Peyton et al., 2022). We approximated this approach as follows: After completing the last task of the choice experiment, we presented teachers with an exact replica of their final choice task. We then explicitly primed them to think back to before the pandemic and indicate whether their preferred school would have been different. Encouragingly, 90% of teachers indicated their choices would have been stable across the two time periods, assuaging concerns that the pandemic influenced responses.
Follow-Up Study
As an additional robustness check of our findings, we conducted a second study in November 2022. We again contracted Lucid Marketplace to recruit and survey a national sample of K–12 teachers for two purposes: (a) to assess whether our study replicated when data collection was not done at the height of the COVID-19 pandemic and (b) to assess whether our study replicated when the attribute set was expanded to include details on the student population, school leadership, school behavioral climate, and safety. Hereafter, we refer to this survey as our “2022 survey,” where we deployed Experiment 2.1, an exact replication of Experiment 1, and Experiment 2.2, a modified version of Experiment 1 with an expanded attribute set (see Table 6).
Values of Additional Attributes Included in 2022 Survey Experiment 2.2
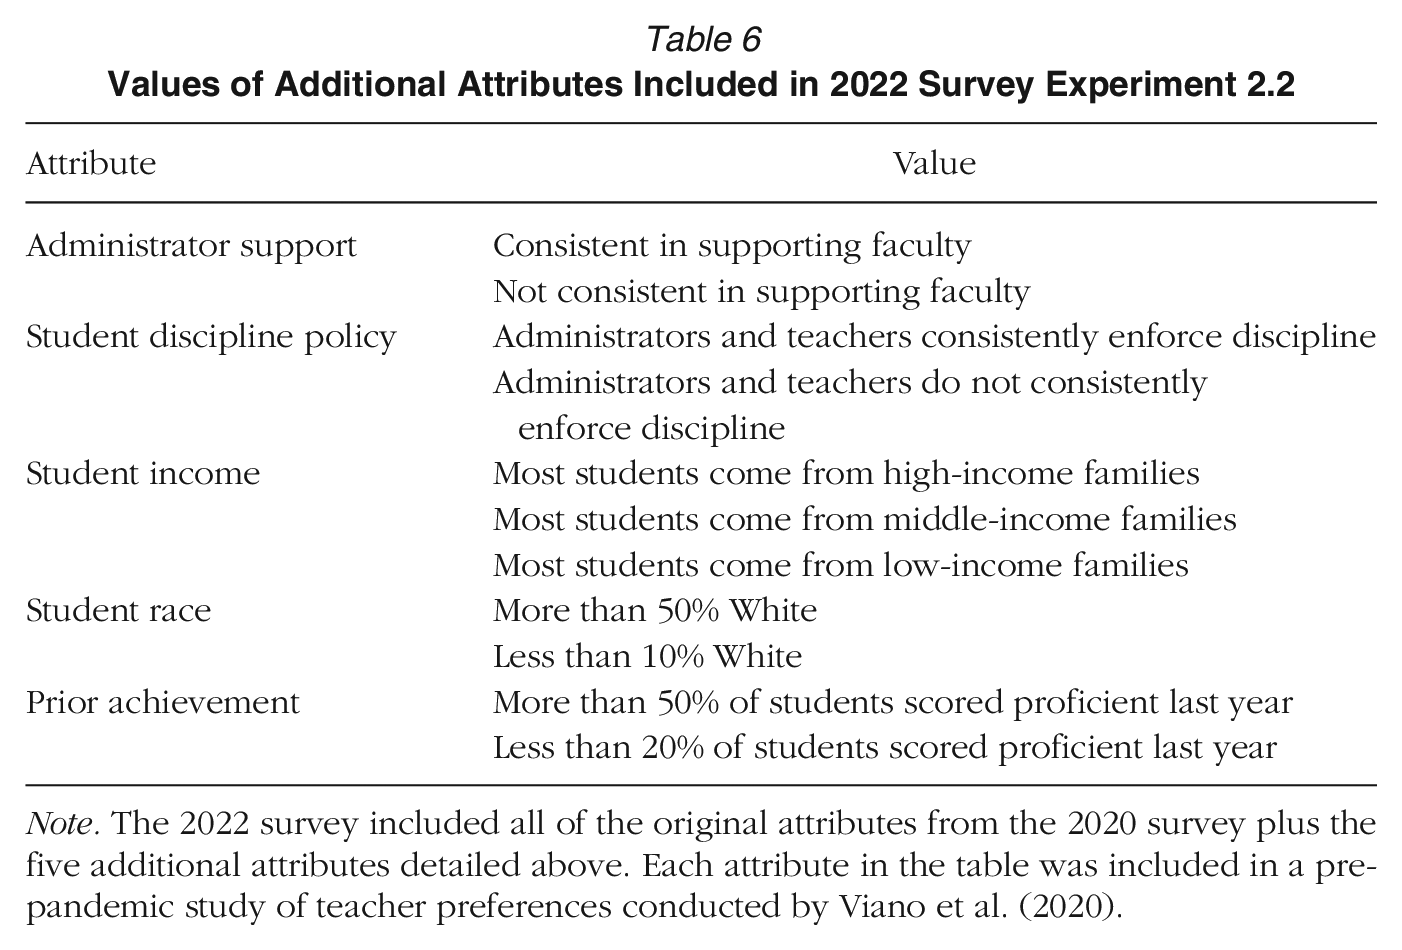
Note. The 2022 survey included all of the original attributes from the 2020 survey plus the five additional attributes detailed above. Each attribute in the table was included in a prepandemic study of teacher preferences conducted by Viano et al. (2020).
In the 2022 survey, there were 989 survey entrants, 268 (27.09%) of whom satisfied the same set of inclusion criteria employed in the 2020 survey. Again, the 2022 sample was mostly female (80%) and White (81%) and included a fairly even share of primary and secondary teachers. The vast majority (82%) were working in traditional public schools (Table 2). Compared to the national sample of public school teachers, our 2022 sample skewed slightly less experienced and overrepresented teachers from the South and teachers serving primary students.
Figure 2 presents the results. Notably, we see that our conclusions regarding the importance of school staffing personnel remain the same when the experiment was repeated 2 years later (Experiment 2.1) and when the experiment was modified to include additional school features (Experiment 2.2). Specifically, the rank order of attribute “importance” remains consistent across all three experiments, with the only exception being that teachers showed slightly stronger preferences for school counselors in Experiment 2.1. Moreover, the results of Experiment 2.2 reveal that counselors, nurses, and special education specialists are just as important to teachers as features already well understood to impact teacher retention, such as a consistent approach to addressing student discipline and having an administration that provides faculty with consistent support. We therefore conclude that the 2020 study results were not idiosyncratic to preferences at the height of the pandemic when school closures were commonplace and establish that the presence (absence) of school support staff are as relevant to teachers’ employment preferences as other school features widely accepted as important to teacher retention (e.g., school leadership, student discipline).
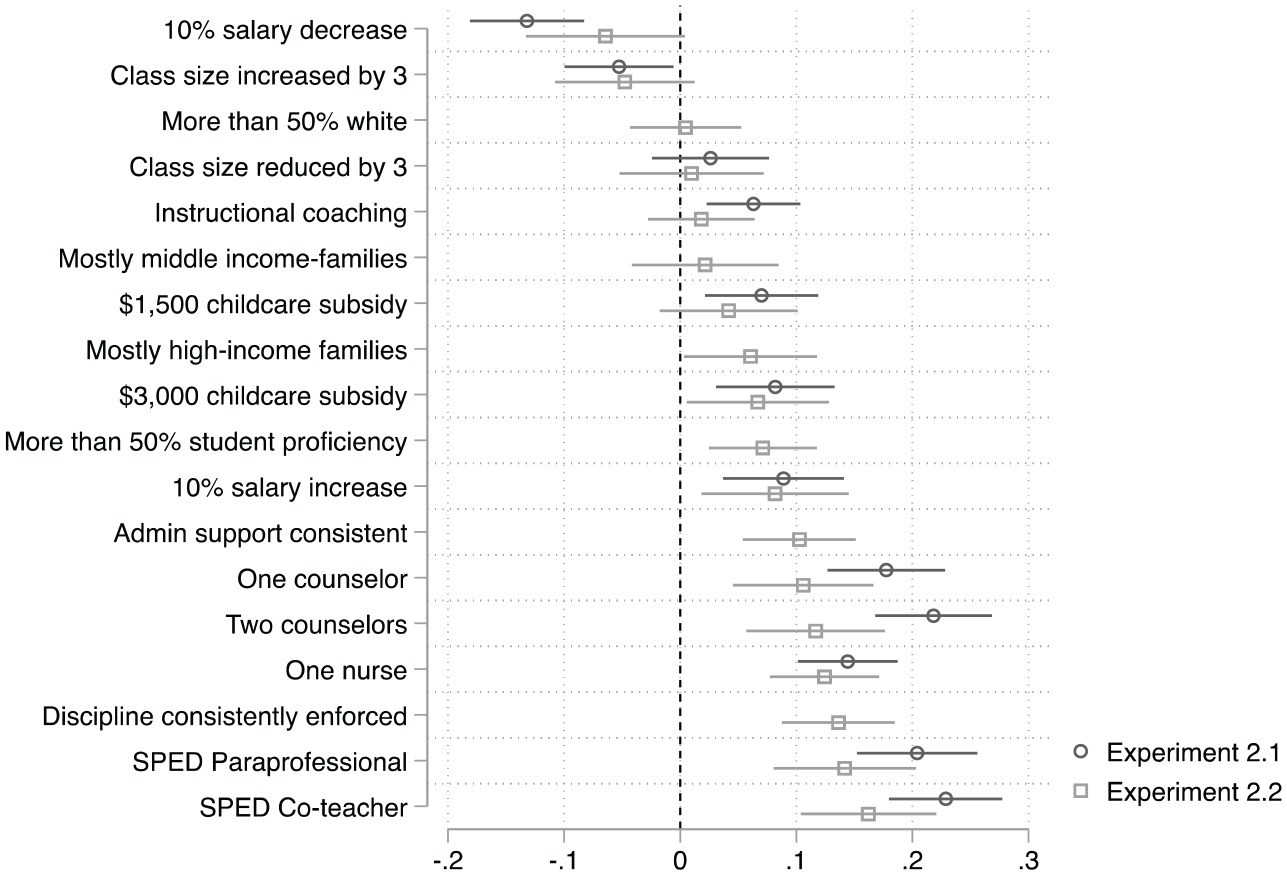
Effects of school attributes on teachers’ employment preferences (2022 follow-up survey).
Discussion
Our analyses yielded three central findings. First, investments in counselors and nurses are very important to teachers. We show that the value teachers place on working at a school with a nurse and a school counselor exceeds the per-teacher cost of providing these supports under a range of different costing assumptions (see Table 4). These are policy-relevant results considering that as of 2019, 5 million U.S. students attended a school lacking either a counselor, a nurse, or both (Whitaker et al., 2019). Prioritizing funding toward addressing these staffing shortages would both increase essential services for students and, according to this study, improve the likelihood a teacher would want to work at one of these schools.
Second, of all the policy options we examined, investments in full-time, in-class special education support were most appealing to teachers. Teachers’ relatively high WTP for special education support suggests schools’ decisions on how to allocate resources toward special education staffing have important implications not just for students but for general educators as well. This evidence is consistent with research by Gilmour and Wehby (2020) showing teacher turnover increases when teachers are assigned more students with disabilities. Our results suggest that increasing investments in special education specialists may be a viable, albeit expensive, option for improving teacher satisfaction. These findings also imply that teachers do not appear to hold strong preferences over whether their in-class special education support comes from a paraprofessional or from a co-teacher. This is important given that the cost of hiring a paraprofessional is less than half the cost of hiring a co-teacher (Table 1). Recent research from North Carolina suggests teaching assistants improve student outcomes (Hemelt et al., 2021), further strengthening the case for investing in paraprofessionals.
Third, we found that teachers with at least one child under 12 would be willing to substitute a 10% increase in salary for a $3,000 per-child benefit. For a hypothetical teacher making $60,000 with two children under 12, the average cost to provide either the 10% raise or the childcare benefit would be about $6,000 per year. However, providing childcare benefits is far less expensive than increasing salary in the long run because (a) districts can cap the benefit at a fixed amount (we imposed a ceiling at $6,000 in our design), (b) only a subset of the teaching workforce is eligible, and (c) the benefits expire as teachers’ children age out.
Notably, teachers ineligible for a childcare benefit found working at a hypothetical school that offered childcare benefits more attractive than one that did not. One possible explanation is that family-friendly policies serve as a positive signal of workplace quality. Another is that aspiring parents are anticipating future benefits. Outside of this study, we know very little about teachers’ preferences for childcare support because very few schools across the United States offer these benefits. This study points to the value that childcare benefits may have in shaping teachers’ working conditions and employment preferences and the need to study whether the schools and districts that are starting to develop policies to provide childcare support for teachers are more successfully recruiting and retaining their teachers. Additional research is also needed to assess how the provision of childcare benefits could be affected by the supply of childcare workers. The childcare industry is falling behind as a competitive employer, and there is a nationwide shortage of childcare providers (McLean et al., 2021). The potential benefit of a childcare subsidy may be undercut if there are contractions in childcare employment, which can increase the cost of childcare for parents.
Limitations
A key limitation of this research is that treatment effects are defined in reference to a specific baseline category. This nuance is important for considering policy implications. For example, although the data clearly suggest that having full-time special education support instead of no special education support influences teachers’ preferences more strongly than the prospect of a 10% raise or no raise, it does not necessarily follow that we should expect to observe the same pattern of preferences if we set the baseline level of special education support at half or quarter time. Intuitively, it could be that teachers are very averse to no support from a special education specialist but find part-time support sufficient. Although this level of nuance was beyond the scope of the current study, it provides a ripe area for future research given how important special education staffing models appear to be to teachers’ employment preferences.
It is also important to underscore that our sample is limited to the existing teacher workforce, not the prospective pool of teacher candidates. As such, our results are most relevant to understanding patterns in teacher sorting across schools, not to explaining teachers’ decisions to teach or pursue other career opportunities in the first place. Along similar lines, because the teacher hiring process is often “information-poor” (Liu & Johnson, 2006) and because teachers may be promised supports during the hiring process that they do not in turn receive (perhaps due to turnover of key personnel), our findings may be more revealing of why teachers leave a school than why they initially sign on to teach at that school. At minimum, however, these results suggest that schools staffed with counselors, nurses, and special education specialists should highlight these favorable working conditions during the teacher recruitment process.
Finally, our discussion of costs and benefits focuses only on benefits to teachers and ignores recruiting costs, which can be substantial (Barnes et al., 2007). Moreover, although we take confidence in the observation that the estimated benefit to teachers exceeds the per-teacher cost under a range of different costing assumptions (see Table 4), we emphasize that there are many other legal, moral, and practical justifications for investing in school support staff (especially in the case of special education) irrespective of what consequences these investments have on teachers.
Implications
The above limitations notwithstanding, a key implication of our research is that policies that exclusively focus on pecuniary benefits or class sizes as levers for influencing teachers’ choices of where to work may be poorly aligned with teachers’ preferences. This study highlights that although increased salaries and smaller class sizes are important, more than a modest increase in pay and a small reduction in class size, teachers want to work where they will have the support of full-time counselors, nurses, and special education specialists. These are noteworthy findings precisely because these are not the policy levers typically featured in most debates on how to strengthen the teacher profession nor the typical focus of negotiations with teachers’ unions (e.g., Strunk et al., 2018). Unions themselves may grapple with difficult trade-offs regarding how best to advocate for teachers, balancing teachers’ true preferences with the probability of successfully negotiating a particular outcome; this article nevertheless offers information unions can use in their negotiations on behalf of teachers.
Additionally, this research highlights that the returns to investments in student support professionals extend beyond students as the direct beneficiaries and spill over to teachers as well.
One potential explanation for this finding is that student support professionals can help teachers manage the stresses of teaching, which have only intensified in the wake of the COVID-19 pandemic (Steiner & Woo, 2021). Indeed, over half of teachers in our sample (54%) reported their work was emotionally exhausting to a high or very high degree, and 48% reported feeling burned out because of their work to a high or very high degree (Table A5, available in the online version of the journal). Meanwhile, only a small minority of teachers (29%) reported feeling like they had the support they needed at school. Schools can alleviate some of this tension by ensuring that the enormous responsibility of caring for students is shared broadly across a team of individuals rather than falling squarely on the shoulders of teachers alone. This shared sense of responsibility and collegiality may go a long way toward reducing work-related stress.
Finally, this research underscores the importance of addressing severe shortages of qualified school support staff. In a 2022 nationally representative federal survey, 60% of principals indicated they were struggling to fill nonteaching positions, whereas 48% of principals were hard-pressed to fill vacant teaching positions (NCES, 2022b). School leaders underscored the worst shortages were for special education and mental health specialists. As such, bringing more counselors, nurses, and special education specialists to schools is not simply a question of available resources or the preferences of school and district leaders. Although it goes without question that students need specialized supports at school that nurses, counselors, and special education specialists provide, our findings suggest teachers need and value these supports, too. That support staff shortages may also aggravate teacher shortages is a novel contribution of this research and underscores the critical need to increase the supply of individuals who can serve in these roles.
Supplemental Material
sj-pdf-1-aer-10.3102_00028312231208956 – Supplemental material for Investing in the Teacher Workforce: Experimental Evidence on Teachers’ Preferences
Supplemental material, sj-pdf-1-aer-10.3102_00028312231208956 for Investing in the Teacher Workforce: Experimental Evidence on Teachers’ Preferences by Virginia S. Lovison and Cecilia Hyunjung Mo in American Educational Research Journal
Footnotes
Notes
V
C
References
Supplementary Material
Please find the following supplemental material available below.
For Open Access articles published under a Creative Commons License, all supplemental material carries the same license as the article it is associated with.
For non-Open Access articles published, all supplemental material carries a non-exclusive license, and permission requests for re-use of supplemental material or any part of supplemental material shall be sent directly to the copyright owner as specified in the copyright notice associated with the article.