
Abstract
Pundits, politicians, and academics have long worried about potentially low rates of civic participation among STEM-oriented students. Does studying STEM actually decrease the odds that young people will be actively involved in democracy? To answer this question, we created a dataset of over 23 million students in the United States, matched to national validated voting records. This novel dataset is the largest known individual-level dataset in the United States, connecting high school and college students to voting outcomes. It also contains a rich set of demographic and academic variables, to account for many of the common issues related to students’ selection into STEM coursework. We consider two measures of STEM participation: Advanced Placement (AP) exam taking in high school and college major. Using both measures, we find that, across model specifications, the estimated relationships between STEM and voting are small in magnitude—about the same effect size as a single get-out-the-vote mailer. Our analyses demonstrate that, on average, marginally more STEM coursework in high school and college does not contribute noticeably to the low voting rates among young people in the United States.
Introduction
Sparked by the concern that the United States is falling behind other countries in core science and mathematics competencies and the implications this would have for the American economy, policymakers have placed heavy weight on increasing high school and college students’ exposure to science, technology, engineering, and mathematics (STEM) coursework (Mayo, 2009; Leshner, 2018; Manduca et al., 2017; Foster et al., 2010; Chirikov, Semenova, Maloshonok, Bettinger & Kizilcec, 2020; Ferrini-Mundy, 2013). In the last 10 Congresses, for example, over 2,000 pieces of individual legislation relating to STEM education have been introduced. Simultaneously, there has been a marked increase in students enrolling in STEM courses and majors. Over the past 2 decades, the number of students majoring in STEM-related fields has increased by more than 50% (STEM Education Data and Trends, n.d.-a, n.d.-b; AP Program Participation & Performance Data, 2020).
There are potentially many direct and indirect benefits to individuals and society from having more students who are studying STEM (e.g., Beede et al., 2011; Xie, Fang & Shauman, 2015; Fry, Kennedy & Funk, 2021; G. B. Dahl, Rooth & Stenberg, 2023). However, some critics are concerned that emphasizing STEM coursework will have negative consequences—crowding out the development of other core competencies (Teitelbaum, 2014; Ravitch & Viteritti, 2001; Board, 2015; Freeman, 2006; Xie & Killewald, 2012; Kelly, Butz, Carroll, Adamson & Bloom, 2004; Lowell & Salzman, 2007; Casselman, 2014; Shiller, 2013). At the heart of this debate are concerns about whether a STEM-focused pedagogy allows room for what many reformers argue is the foundational mission of the American education system: the development of young people's capacity to engage with and preserve democracy (Plato, n.d.; Dewey, 1923, 1903; Holbein & Hillygus, 2020; Campbell, 2006; Ravitch & Viteritti, 2001; Chomsky, 2003; Lipset, 1959; Converse, 1972; De Tocqueville, 2003). After all, young people are engaged in civic and democratic processes (like voting) at shockingly low and, by some accounts, declining levels (Holbein & Hillygus, 2020). Furthermore, according to some studies, STEM majors are voting at some of the lowest rates of all young people (Hillygus, 2005; Ro & Bergom, n.d.; Niemi & Hanmer, 2010) and are much less likely to contribute their time, money, and energy to political and social causes (Ravitch & Viteritti, 2001; Allgood, Bosshardt, Van der Klaauw & Watts, 2012; Sax, 2004; Astin et al., 1997). 3 This is unfortunate as civic engagement has long been thought to be a precursor to a well-functioning democracy (e.g., R. A. Dahl, 1973; Verba, Schlozman & Brady, 1995; Wolfinger, Rosenstone & Rosenstone, 1980). If young people do not participate, they may be less likely to be represented in government (Griffin & Newman, 2005). If STEM-inclined students are less likely to vote, this means that their voice will be effectively down-weighted in political debates. This gap in voting rates by college major, then, has led many critics, ranging from policymakers and educators to thought-leaders and scholars, to argue that STEM education needs a civic engagement makeover (Garlick & Levine, 2017; Teitelbaum, 2014; Ro & Bergom, n.d.; Hillygus, 2005; Ravitch & Viteritti, 2001; Feuer, 2021; Condon & Wichowsky, 2018; Higgins,Wallace & Bazzul, 2018).
Critical to the debate on the link between STEM coursework and forms of civic engagement like voting are two questions that we seek to address in this paper. First, are STEM students, in fact, less civically engaged than non-STEM students? Second, to what extent is this relationship causal? There are two reasons these questions are difficult to answer. First, data that contain the necessary variables to test the relationship of interest are difficult to come by. Most work in the area uses survey-based measures of civic engagement (Teitelbaum, 2014; Ravitch & Viteritti, 2001; Board, 2015; Freeman, 2006; Xie & Killewald, 2012; Kelly et al., 2004; Lowell & Salzman, 2007; Casselman, 2014), which may be contaminated by social desirability bias (Karp & Brockington, 2005; Holbrook & Krosnick, 2010). 4 Additionally, survey samples are often small in size or focus only on a single group, cohort, or point in time (Fraga & Holbein, 2020); this can produce idiosyncratic results. These shortcomings have led to somewhat conflicting results when it comes to the role of student coursework and voting (Niemi & Hanmer, 2010; Hillygus, 2005). Second, it is difficult to disentangle whether any relationship between STEM coursework and civic engagement is caused by coursework or simply reflects pre-existing levels of interest in civic or political engagement. Indeed, many studies include a limited set of control variables to address selection bias (Teitelbaum, 2014; Ravitch & Viteritti, 2001; Board, 2015; Freeman, 2006; Xie & Killewald, 2012; Kelly et al., 2004; Lowell & Salzman, 2007; Casselman, 2014).
In this paper, we create the largest and most comprehensive dataset in the United States that links high school and college students and their studies to validated voting records. Our data consist of over 23 million students who graduated high school between 2004 and 2013 and took either the Scholastic Assessment Test (SAT), Preliminary Scholastic Assessment Test (PSAT)/National Merit Scholarship Qualifying Test (NMSQT), and/or Advanced Placement (AP) exams. The College Board's exam data are linked to the National Student Clearinghouse data, which includes college enrollment spells and college majors. We therefore have two distinct measures of participation in STEM coursework: STEM AP exam taking and college STEM majors. These administrative educational records are then linked to validated voter files. The voting records of (initially) over 200 million Americans, provided by Data Trust, LLC, include whether (but not for whom) individuals voted in the 2004–2016 federal elections. These merged data are not only an order of magnitude (if not more) larger than previous work in this space—which allows us to get very precise estimates—but the educational records have a rich set of demographic and academic variables that allow us to account for many sources of selection into STEM coursework and fields (including those absorbed by sibling fixed effects).
On average, we find relatively small differences in voting rates across college majors and high school course-taking. Unconditionally, students who take one additional AP STEM exam are 0.35 percentage points more likely to vote in their first eligible election. Likewise, college STEM majors are 0.9 percentage points more likely to vote after graduating college. After we add a rich set of controls, such as high school (or college) attended, parental income and education, and PSAT scores, the estimates become negative, but remain small in magnitude. Specifically, students who take one additional AP STEM exam are 0.25 percentage points less likely to vote in their first eligible election and college STEM majors are only 0.6 percentage points less likely to vote after graduating college. These results are robust and qualitatively similar across a variety of specifications, different election types, demographic groups, and time periods. (However, they are quite modest in size.)
Additionally, the reversal of the signs on the coefficient estimates suggest that selection into STEM coursework is, in general, a valid concern in the literature that attempts to isolate the causal effect of STEM coursework on voting. In our analyses, we cannot fully rule out all sources of selection, despite our rich set of controls and sibling fixed effects. We suspect, however, that any remaining selection issues bias the estimates away from zero (i.e., more negative relationship between STEM and voting). Moreover, fortunately, our large sample yields very precise estimates and such that the bounds of the 95% confidence intervals are not noticeably distinct from modest coefficient estimates. Our results suggest that, contrary to popular wisdom, STEM students, on average, do not vote at appreciably lower rates than non-STEM students, and STEM coursework, on average, does not meaningfully decrease the chances that young people will be civically engaged. To put the magnitude of the effect into context, the differences in voting rates between STEM and non-STEM students is about the size (in absolute terms) of the impact of a single get-out-the-vote mailer (Green, McGrath & Aronow, 2013). At their surface, these modest magnitudes are not strong endorsements for civic-based interventions to target STEM-oriented students, but this may not be a universal truth. Some estimates on AP exams (e.g., U.S. government and politics) and college majors (e.g., history) suggest that those who primarily study non-STEM topics are much more likely to vote than someone who studies typical STEM fields. Additionally, our estimates are relative to an unobserved counterfactual. STEM majors are likely required to take some social science or history courses at most colleges. Therefore, our estimates are about the difference in coursework between a STEM and non-STEM major, not the difference between taking all STEM and all non-STEM courses.
Overall, we take our results to show that there is reason to be concerned about low and (by some accounts) declining youth turnout, but targeting the typical STEM student or intervening with typical non-STEM coursework or material, may not produce the desired results—at least not in high school or college.
Background and Conceptual Framework
Patterns of Voting
Voting is one of the central pillars of democracy and a key metric of democratic health (R. A. Dahl, 1973; Galston, 2004; Verba et al., 1995; Wolfinger et al., 1980; Downs, 1957). Yet, in the United States, voter turnout is low and unequal among a number of important social dimensions. Scholars have identified a number of social cleavages that strongly predict whether a person becomes active in democracy; these include citizens’ race, gender, occupation, and socioeconomic status (Smets & Van Ham, 2013; McNaughtan & Brown, 2020). However, one of the largest inequities in voter turnout is citizen age: In the United States, older citizens turn out to vote at a rate nearly twice as high as their younger counterparts (Holbein & Hillygus, 2020). This pattern is true among students who do and do not go to college (Fraga & Holbein, 2020; McNaughtan & Brown, 2020). This pattern of low youth turnout is self-reinforcing given the habitual nature of voting (Fujiwara, Meng & Vogl, 2016; Coppock & Green, 2016) and, as such, reinforces other inequities we see in voter participation (e.g., those by race and socioeconomic status; see 46). Scholars have identified college as a critical period in determining whether a young person becomes an active voter or fails to do so (Willeck & Mendelberg, 2022). While an abundant literature has explored the role that educational attainment plays (e.g., Marshall, 2019; Milligan, Moretti & Oreopoulos, 2004; Berinsky & Lenz, 2011; Kam & Palmer, 2008; Henderson & Chatfield, 2011; Mayer, 2011; Sondheimer & Green, 2010; Tenn, 2007; Apfeld, Coman, Gerring & Jessee, 2023), little to no research has considered how variations in a person's educational experience shapes voting. That is, while there is ample research on how the quantity of a person's education matters, there is little research on the qualities that matter. This is unfortunate as American educational experiences differ widely along a number of salient dimensions (e.g., Duncan & Murnane, 2011), including the coursework/field of study one chooses. 5
STEM and Voting Patterns
There are four theoretical reasons as to why STEM-focusing students may vote less often: selection, social networks, opportunity costs, and educational differences. We outline these conceptual mechanisms here. These draw from our survey of prior research on the topic. We note, however, that the research on potential mechanisms has been somewhat scattered; that is, prior work has done less on why voting rates may differ across high school coursework and college majors. As one thought-leader recently noted, the great unanswered question in this literature is “why do STEM students vote at lower rates than their peers?” (Varga, 2021, p. 1). We lay the reasons out here one by one in an attempt to solidify theory in this space. To be clear, however, in articulating these mechanisms in one place, our intent is not to fully disentangle potential mechanisms here. Rather, we discuss these to lay a foundation for the analyses that are to follow.
First, the types of students that select into coursework in STEM may be less interested in politics. This is, perhaps, the most common explanation for differences in voting rates by college major/student coursework. Choosing to take courses in STEM, as opposed to those in the social sciences, for example, may reveal a lack of interest in social activism (Ravitch & Viteritti, 2001; Hillygus, 2005; Nie & Hillygus, 2001; Thomas et al., 2017). Indeed, prior work has shown that among incoming college freshmen, STEM-taking students have lower frequency of discussing politics (Sax, 2004). As one study put it, “the explanation [for differences in voting rates by college majors] probably lies in levels of interest in politics and other social phenomena relative to interest in the natural world” (Niemi & Hanmer, 2010, p. 306), or, as another study put it “students’ voting behavior may be explained more by who they are when they arrive at college and less by their course of study” (Ro & Bergom, 2018, p. 1). In this paper, we explore and attempt—as best as we can—to rule out this explanation. However, a key point that we test here is the extent to which this is true with the data improvements we introduce in this paper.
The second reason why STEM-taking students may be less engaged in voting has to do with social networks. As prior work has noted,
One’s major field of study creates a potentially important sub-environment during college. It not only focuses one's intellectual efforts in a particular direction, but it also has an influence on the kinds of students and faculty with whom one interacts. (Pascarella 1991, pp. 613–614)
Research across various social science disciplines has shown that voting has a strong social element to it—that is, the people with whom one associates in their work, school, and community relationships strongly shapes voting decisions (e.g., Gerber, Green & Larimer, 2008; Blais, Galais & Coulombe, 2019; Campbell, 2013). Putting these two strands together, if STEM-taking students are more likely to socialize with their fellow STEM-taking students (and STEM faculty) and their fellow STEM-taking students (and STEM faculty) are, themselves, less likely to vote, there may be a socially self-reinforcing pattern.
Third, focusing on STEM coursework has an opportunity cost. The number of courses a student can take is, to a certain extent, finite. As a result, enrolling in STEM courses means that you do not enroll in other courses where civic content is taught. While this potential mechanism is, arguably, the most straightforward, work on this potential mechanism is sparse. Scholars, however, have argued for this potential mechanism—albeit obliquely—when they argue that a focus on STEM has crowded out civics education. In an era of test-based accountability, many scholars have worried that emphasis on science, reading, and math would crowd out social studies education. Condon and Wichowsky (Condon & Wichowsky, 2018, p. 197) note that “civic education is being neglected” and that “time spent on social studies in general is declining, more so than other subjects, in an era of high-stakes testing.” If students are given fewer opportunities to be exposed to effective civics learning, they may not be imbued with the knowledge and skills they need to participate in politics (Campbell & Niemi, 2016; Holbein & Hillygus, 2020).
Fourth, the content of STEM coursework may serve to decrease voting rates. Research has shown that the content of courses—in both high school and college—can matter for downstream voting outcomes (Holbein & Hillygus, 2020; Bennion & Nickerson, 2016). Prior work has also noted that “faculty in some academic fields of study tend to do a better job than others with embedding a civic perspective and emphasizing the importance of political participation” (Ro & Bergom, 2018, p. 1). Hence, the content of STEM courses may dissuade young people from becoming active voters. For instance, STEM students may be taught and ultimately believe that societal problems are best solved through non-governmental means—through the technological progress of the private sector, for example. If this belief is internalized, then STEM-minded students may find little reason to engage in democratic elections. In this way, and others, explicit teaching may have downstream consequences on citizens’ patterns of voting.
Of course, it is possible that STEM coursework does not influence voting rates at all. STEM students may overcome the obstacles just listed and still engage in politics at similar rates to their non-STEM counterparts. STEM students may actually be just as civically-minded as their non-STEM counterparts, young people may be influenced by other components of their social networks who are civically-minded, and STEM instructors may still find ways to incorporate civic content into their courses. In addition, it is possible that the other forces that drive voting overcome the mechanisms just discussed. STEM-minded students are not islands unto themselves as they are still being exposed, in the many non-classroom venues that they find themselves in, to the broader political climate around them. Ultimately, which of these theoretical mechanisms wins out is an empirical question. 6
Data
To test the connection between STEM-taking and voting, we use a unique combination of voting and educational records. This project makes use of administrative educational data from the College Board (CB) and National Student Clearinghouse (NSC), as well as national voting records. Combining them generates one of the largest and richest datasets connecting individual-level education records from high school and college with voting outcomes.
Educational Records
Our education data come from two main sources: the CB and NSC. CB owns and operates three major exams taken by high school students—the SAT, PSAT/NMSQT (PSAT), and Advanced Placement (AP). The individual-level data includes all students who took at least one of the exams in the high school graduating cohorts of 2004 to 2013, which is approximately 3 million students per cohort and well over 20 million unique exam takers. The exams are not a census or nationally representative of high school students. Rather, there is some degree of positive selection towards those who take the exams.
The SAT is one of two college entrance exams considered in admissions and program placement by thousands of colleges across the United States. Approximately 1.5 million students per cohort take the exam. The SAT is scored between 400 and 1600 (200 to 800 points are awarded for both the math and verbal sections). Upon registration, students complete a questionnaire that gives their name and date of birth and demographics, such as gender, race/ethnicity, and parental income and education. This dataset also includes which high school students attend and SAT scores on all attempts. 7
AP is a program that offers high school course content in over 30 different subjects, ranging from English and history to calculus and chemistry. Students typically take a year-long course in their high school and have the option to take the corresponding subject's AP exam. High schools determine which AP courses are offered, if any, and the courses are offered at different years in a high school career, but most are taken in junior and senior years. AP exams are scored as integers between 1 and 5, and those scoring high enough are eligible for college credit. We have the full set of AP exams taken (not courses taken) 8 and each score for the over 1 million students who take at least one exam per high school cohort.
We also make use of siblings in the College Board data. This specification arguably gets us as close to causal identification as we can. In practice, the sibling identifiers are borrowed from previous work using similar data. 9
NSC data are a near census of college enrollment spells in the United States. They include enrollment dates for each student in each college for approximately 98% of all enrollees in the United States. 10 We focus on the first college enrolled and first college major, the latter of which is only available for students who earn a degree. 11 These majors are then categorized by their two-digit Classification of Instructional Program (CIP) code, which we further be categorize into STEM and non-STEM majors. 12
Voting Records
In the United States, each state collects and reports its own voting data, but they all publicly detail whether (but not for whom) each individual votes. We obtained nationwide voting data from the Data Trust, LLC—one of the many vendors in this space. The Data Trust combines and standardizes data from each state's election governing body on the tens of millions of people who voted in elections from 2004 to 2016. The key outcome variables in the data are for each biannual national election (i.e., 2004, 2006,…, 2016), whether the person voted in the primary election and, separately, in the general election. Therefore, for someone who was 18 years old by November 2004, we can observe their voting history in all elections. 13
We transform the voting records into a single observation per person, as opposed to a single observation per person–state, based on name and date of birth (DOB). The process is detailed in the Appendix A (see the online supplemental material).
Analytic Dataset
We match the educational records to the voting records using name and DOB for those who live in the 50 states or D.C. 14 We start by matching unique name and DOB combinations from each dataset and then move to a series of fuzzy matching methods, as described in Appendix A. We also create a series of first name, last name, and first and last name identifiers for potential false matches (and non-matches) that we later use in robustness tests, including common names, partially missing DOBs in the voting records, and females who are more likely to change their last name. In a series of validation exercises in Appendix A (section B), we show that the patterns of voting rates in our matched dataset follow those of nationally available statistics by age, race/ethnicity, and over time. With a fully matched dataset, we define two distinct analytic samples based on two measures of STEM: AP subject and college major. 15 Our AP sample includes all 23.5 million CB exam takers, including PSAT and SAT takers who may not have taken any AP exams. We count the number of AP STEM exams and number of AP Non- STEM exams for each student, 16 which average 0.29 and 0.68 over the sample period. Our college major sample includes over 8 million college graduates whose college majors we know. 17 We categorize majors into STEM and non-STEM, which are mutually exclusive, based on their two-digit CIP code. 18 Collectively, our measure of STEM relies on taking AP exams or attending college and graduating, both of which are measures of STEM among relatively high-achieving students. Alternative measures that include all high school students or non-college-goers may yield somewhat different results.
For most of our analyses, we focus on whether the student voted in their first general election, which take place every 2 years, around the time the students complete high school or college. In the AP sample, this is the first eligible election for which the student is 18 years old. In the college sample, this is the first election after graduating college. 16.7% and 27.9% of the AP sample and college graduate sample, respectively, vote in their first election. Additional summary statistics on voting rates, different voting outcomes, 19 and background variables are in the Appendix Table B1.
Methodology
To assess the relationship between STEM coursework or majors and voting, we use regression analyses. When focusing on AP courses, we run variants of the following regression:

The outcome is whether individual i in cohort c at school s voted in election e. We are primarily interested in the coefficients
No controls.
Cohort fixed effects.
Demographics and cohort fixed effects.
PSAT scores, demographics, and cohort fixed effects.
School-by-cohort fixed effects, PSAT scores, and demographics.
Sibling fixed effects, PSAT scores, demographics, and cohort fixed effects.
By-running the series of regressions, we examine how adding increasingly more controls impact the coefficients. The first equation is just the unconditional differences in voting rates. Adding variables like PSAT scores and demographics is intended to (partially) capture selection into these courses based on underlying academic ability and differential preferences based on demographic differences. The fifth one adds in high school-by-cohort fixed effects. This means we are comparing students in the same high school cohort to one another and so they all had the same set of AP courses to choose from, unlike the previous set of regressions. Finally, the sixth regression adds sibling fixed effects, which compares the AP exam taking of siblings. This has some advantages relative to the previous regressions, such as accounting for time-invariant differences in the family, but it does not control for the differences in AP courses offered. Additionally, there is the potential for siblings to influence one another's voting habits.
The coefficients on AP exam count should be considered the relationship between taking one more AP exam (STEM or non-STEM), holding other things constant, including the exam count. As such, it is helpful to think about a student who is deciding whether to take an additional AP STEM (or non-STEM) exam compared to taking an entirely different course, like physical education or music. In some high schools, it may mean taking a similar course but without an AP designation. The first example has the potential to lead to large differences in voting rates while the second example seems less likely to do so. This distribution of the unobserved counterfactuals and their relative relationship with voting determines the coefficients of interest.
We perform a similar analysis in the college graduate sample but our equation is slightly modified, as follows:

The primary difference with the previous equation is STEM_MAJOR is a binary variable, such that
We stress that these methods cannot entirely rule out other sources of selection into STEM and non-STEM coursework. However, the rich set of controls accounts for many plausible explanations for why students select into STEM courses (e.g., availability, academic ability, and demographics). Any remaining selection likely biases our estimates away from zero.
Results
AP Courses
Table 1 shows the results for the AP sample. Column 1 shows that, unconditionally, each additional AP STEM course is associated with a 0.35 percentage point increase in the probability of voting in the first eligible election, controlling for the number of non-STEM AP courses. That is a 2% increase relative to the sample's mean voting rate of 16.7%. Alternatively stated, taking three additional AP STEM courses is associated with a one percentage point increase in voting in the first election. The corresponding estimate for an additional AP non-STEM course is 1.88 percentage points (11%), much larger in magnitude but also positive.
AP Course Taking and Voting
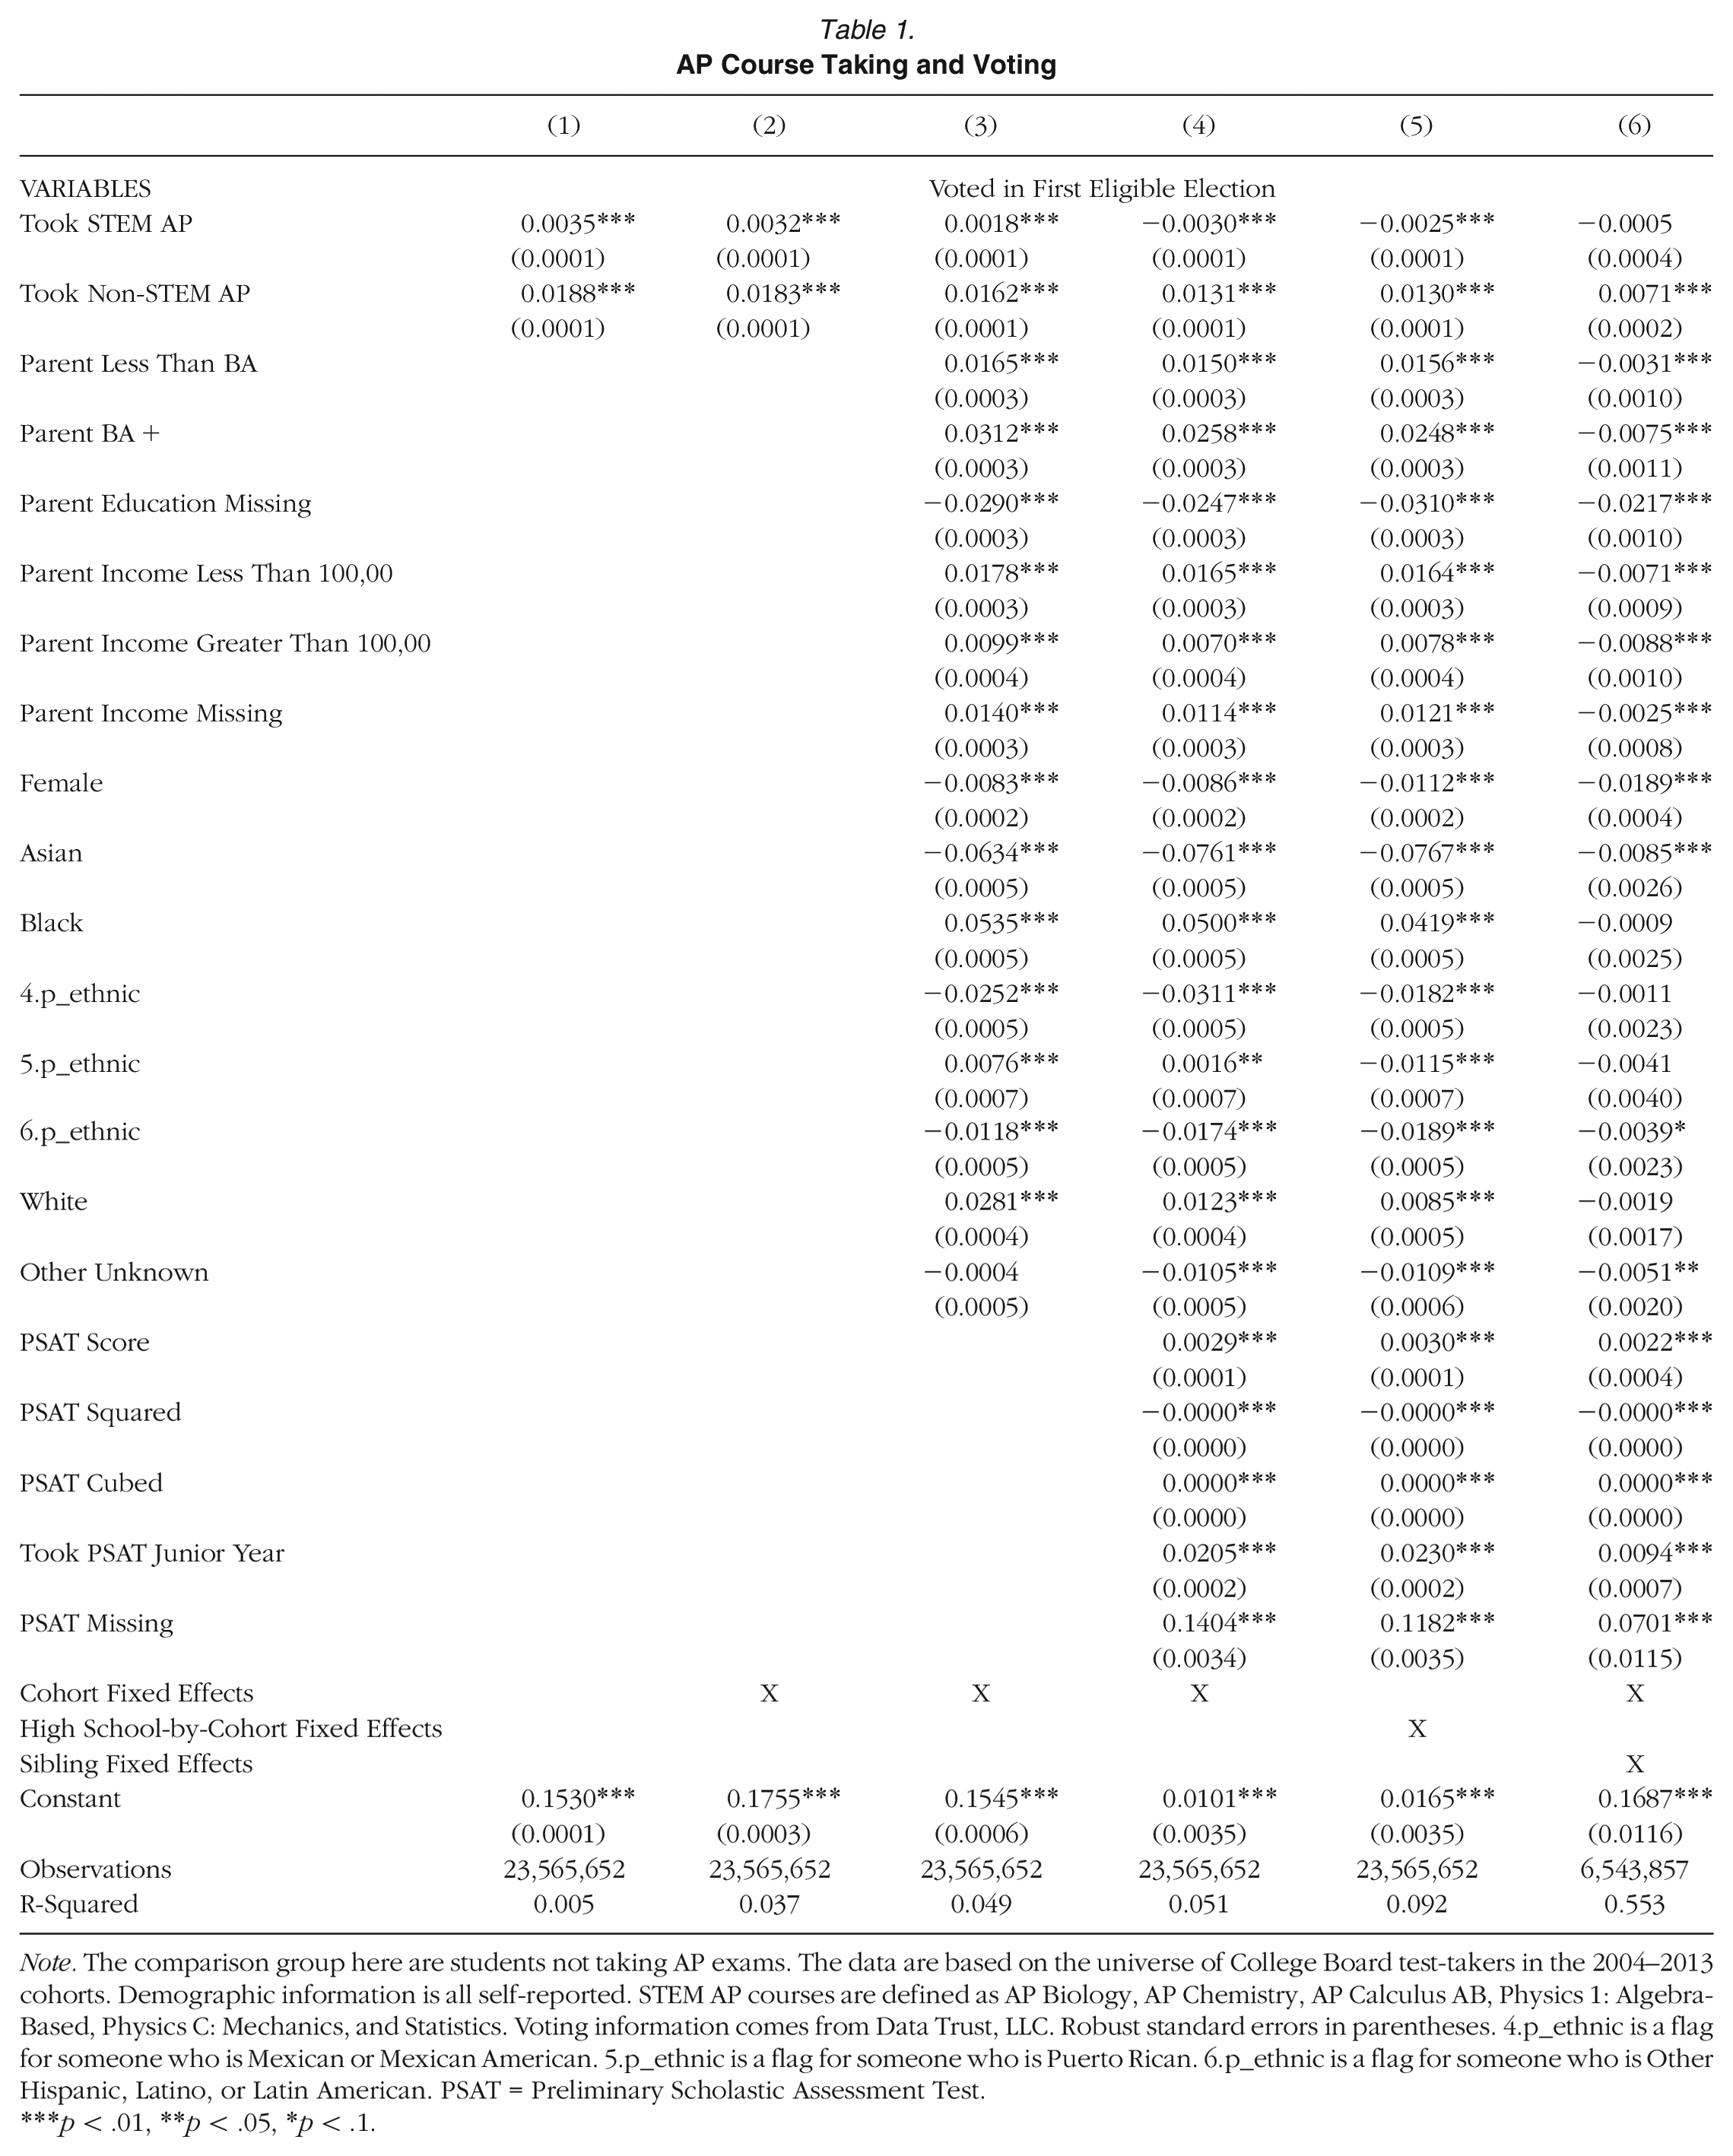
Note. The comparison group here are students not taking AP exams. The data are based on the universe of College Board test-takers in the 2004–2013 cohorts. Demographic information is all self-reported. STEM AP courses are defined as AP Biology, AP Chemistry, AP Calculus AB, Physics 1: Algebra-Based, Physics C: Mechanics, and Statistics. Voting information comes from Data Trust, LLC. Robust standard errors in parentheses. 4.p_ethnic is a flag for someone who is Mexican or Mexican American. 5.p_ethnic is a flag for someone who is Puerto Rican. 6.p_ethnic is a flag for someone who is Other Hispanic, Latino, or Latin American. PSAT = Preliminary Scholastic Assessment Test.
p < .01, **p < .05, *p < .1.
Next, we show the unconditional relationship between the number of AP courses and voting in Figure 1 but disaggregated by course counts. 20 The bottom left corner of the heat map shows that students who take no AP courses, STEM or non-STEM, are relatively unlikely to vote in their first eligible election (15%). There are two ways to think about STEM-oriented students. First, moving from left to right, students are taking more AP STEM courses. Except for the bottom two rows, the other rows show a decrease in voting rates as the number of AP STEM courses increase. For example, 22% of students who take three AP non-STEM courses and zero AP STEM courses voted in their first election, compared to 18% of students who take three AP non-STEM courses and five or more AP STEM courses. Second, conditional on the number of STEM courses taken (i.e., a column), the more AP non-STEM courses taken are associated with higher voting rates. For example, among students who take three AP STEM courses, those who take no AP non-STEM courses versus five AP non-STEM courses vote at a rate of 17% and 23%, respectively. This second way of looking at the figure demonstrates that defining a STEM student may not be just about how many AP STEM courses someone takes but also about how few AP non-STEM courses someone takes (and the combination of the two).
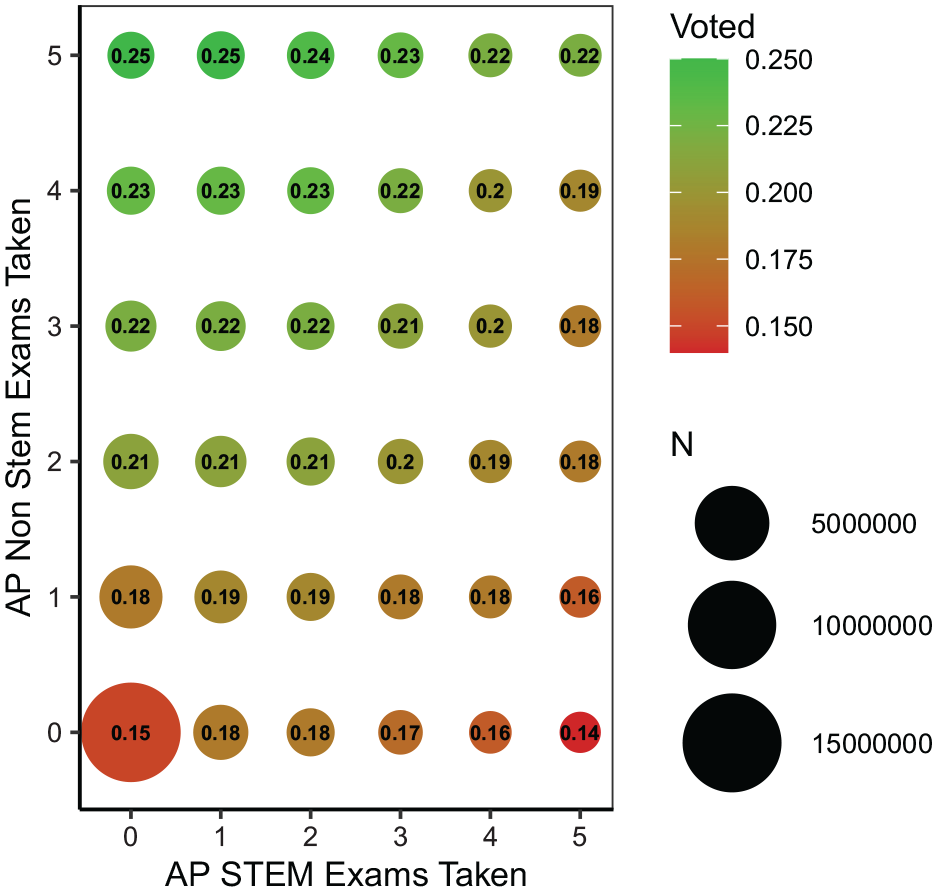
AP coursework and raw voting patterns.
Moving across the columns of Table 1, we see that adding in cohort fixed effects (Column 2) does not change the estimates, but controlling for demographics (Column 3) attenuates the estimates. Adding in PSAT scores (Column 4), an exam often used to sort students into AP courses, flips the sign of the coefficient on AP STEM courses. Adding in high school-by-cohort fixed effects (Column 5) does not appreciably change the estimates, which is an indication that additional control variables to account for selection may have limited impact on the magnitude of the coefficient. Overall, Column 5 shows that students in the same high school and cohort, with the same demographics and PSAT scores, who take an additional AP STEM course, are slightly less likely to vote in their first eligible election (0.25 percentage points). Conversely, those students who take an additional AP non-STEM course are 1.3 percentage points more likely to vote. Adding sibling fixed effects (Column 6) attenuates the estimates, consistent with both smaller relationships between courses and voting and separately sibling spillovers, and there is no longer an estimate on AP STEM courses that is statistically different than zero.
Collectively, Table 1 shows that students who take relatively many AP non-STEM courses are more likely to vote and students who take relatively many AP STEM courses are only slightly less likely to vote, after accounting for underlying differences between students. In the Appendix C, we describe a series of robustness tests on our primary specification (5), largely focused on potential issues related to the matching process. The results are qualitatively unchanged.
In Appendix B, we show and discuss four additional findings. First, conditional on our covariates, we do not find non-linearities in the number of courses taken, providing support for our linear specification and suggesting that the relationship between a marginal AP course and voting is similar throughout the distribution of course count (Appendix Table B3). Second, we show that the broad conclusions are the same across demographics and subgroups, but to slightly varying degrees of magnitude (Appendix Table B4). Third, we show that the results are similar when considering alternative outcomes (Appendix Table B5). In particular, when considering voting in off-cycle elections or count of elections voted, the results hold but are different absolute magnitudes (similar percentages). Fourth, and finally, we see relatively persistent results for several election cycles but the relationships in the long-term are less consistent, perhaps because of degradation of the voting records over time (Appendix Table B6).
Next, we explore the relationship between each distinct AP exam and voting in the first eligible election. We estimate coefficients using the fifth regression with controls for PSAT, demographics, and high school-by-cohort fixed effects, but instead of using STEM and non-STEM counts, we use a set of binary variables for taking each AP course. Figure 2 shows the coefficient estimates and demonstrates that the earlier results are not driven by a single course. 21 Almost all coefficient estimate of AP STEM courses are below zero but small in magnitude, and almost all coefficient estimates for non-STEM courses are above zero and larger in magnitude. AP microeconomics and macroeconomics are exceptions on the non-STEM side, and AP environmental science is an exception on the STEM side. 22 Noticeably, the largest relationships are with AP government and AP U.S. history, both of which have content related to governments, elections, and voting. The coefficient on AP U.S. government is 2.6 percentage points, which corresponds to a 15.6% increase in the probability of voting compared to students who do not take the course.
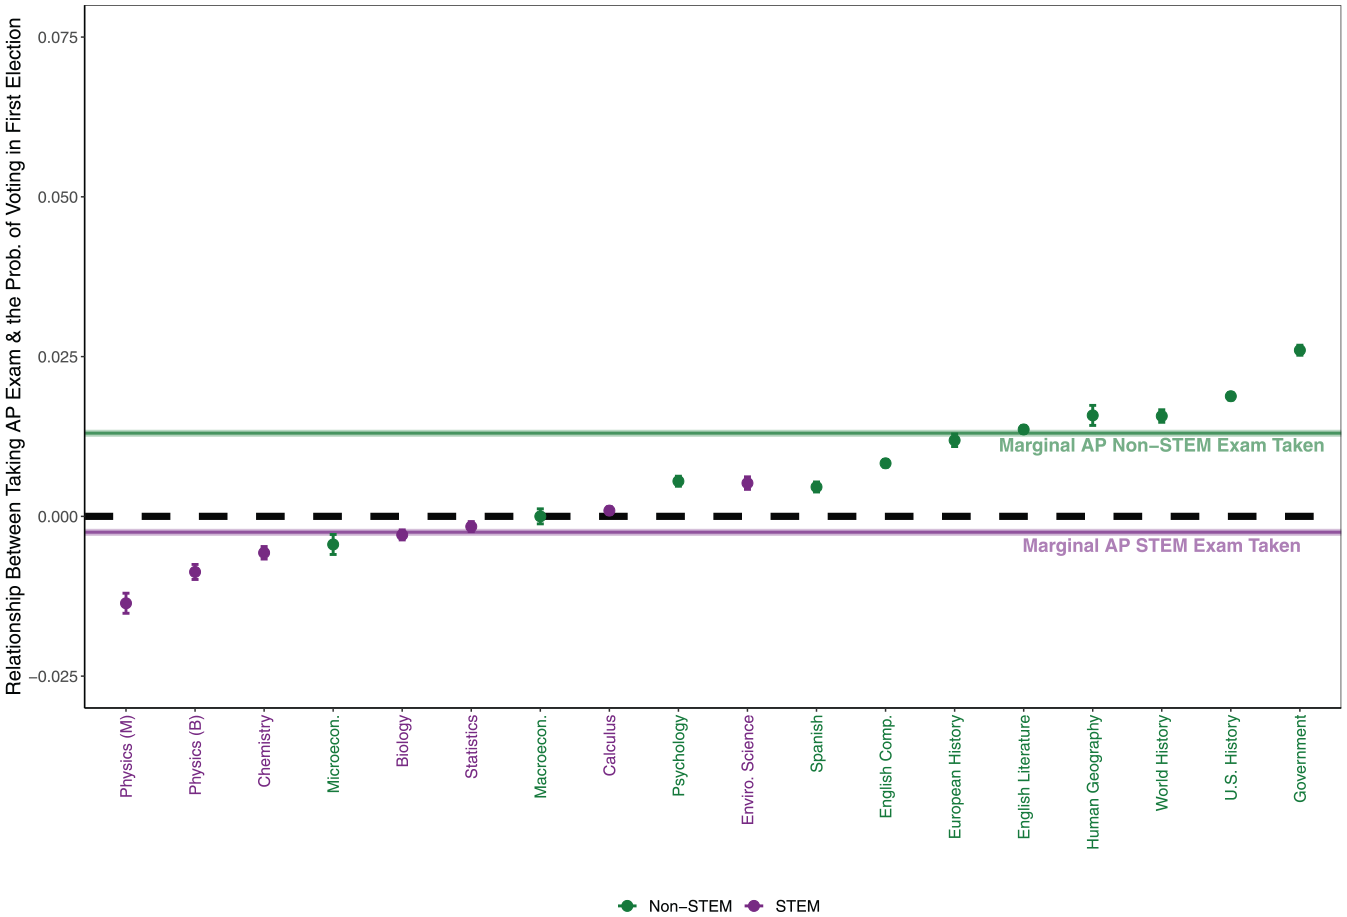
Relationship between taking AP exam and the probability of voting in first election.
College Major
Table 2 shows the results for the college graduate sample. Column 1 shows that, unconditionally, majoring in STEM is associated with a 0.88 percentage point increase in the probability of voting in the first after college graduation. That is a 3.2% increase relative to the sample's mean voting rate of 27.9%.
College Major and Voting
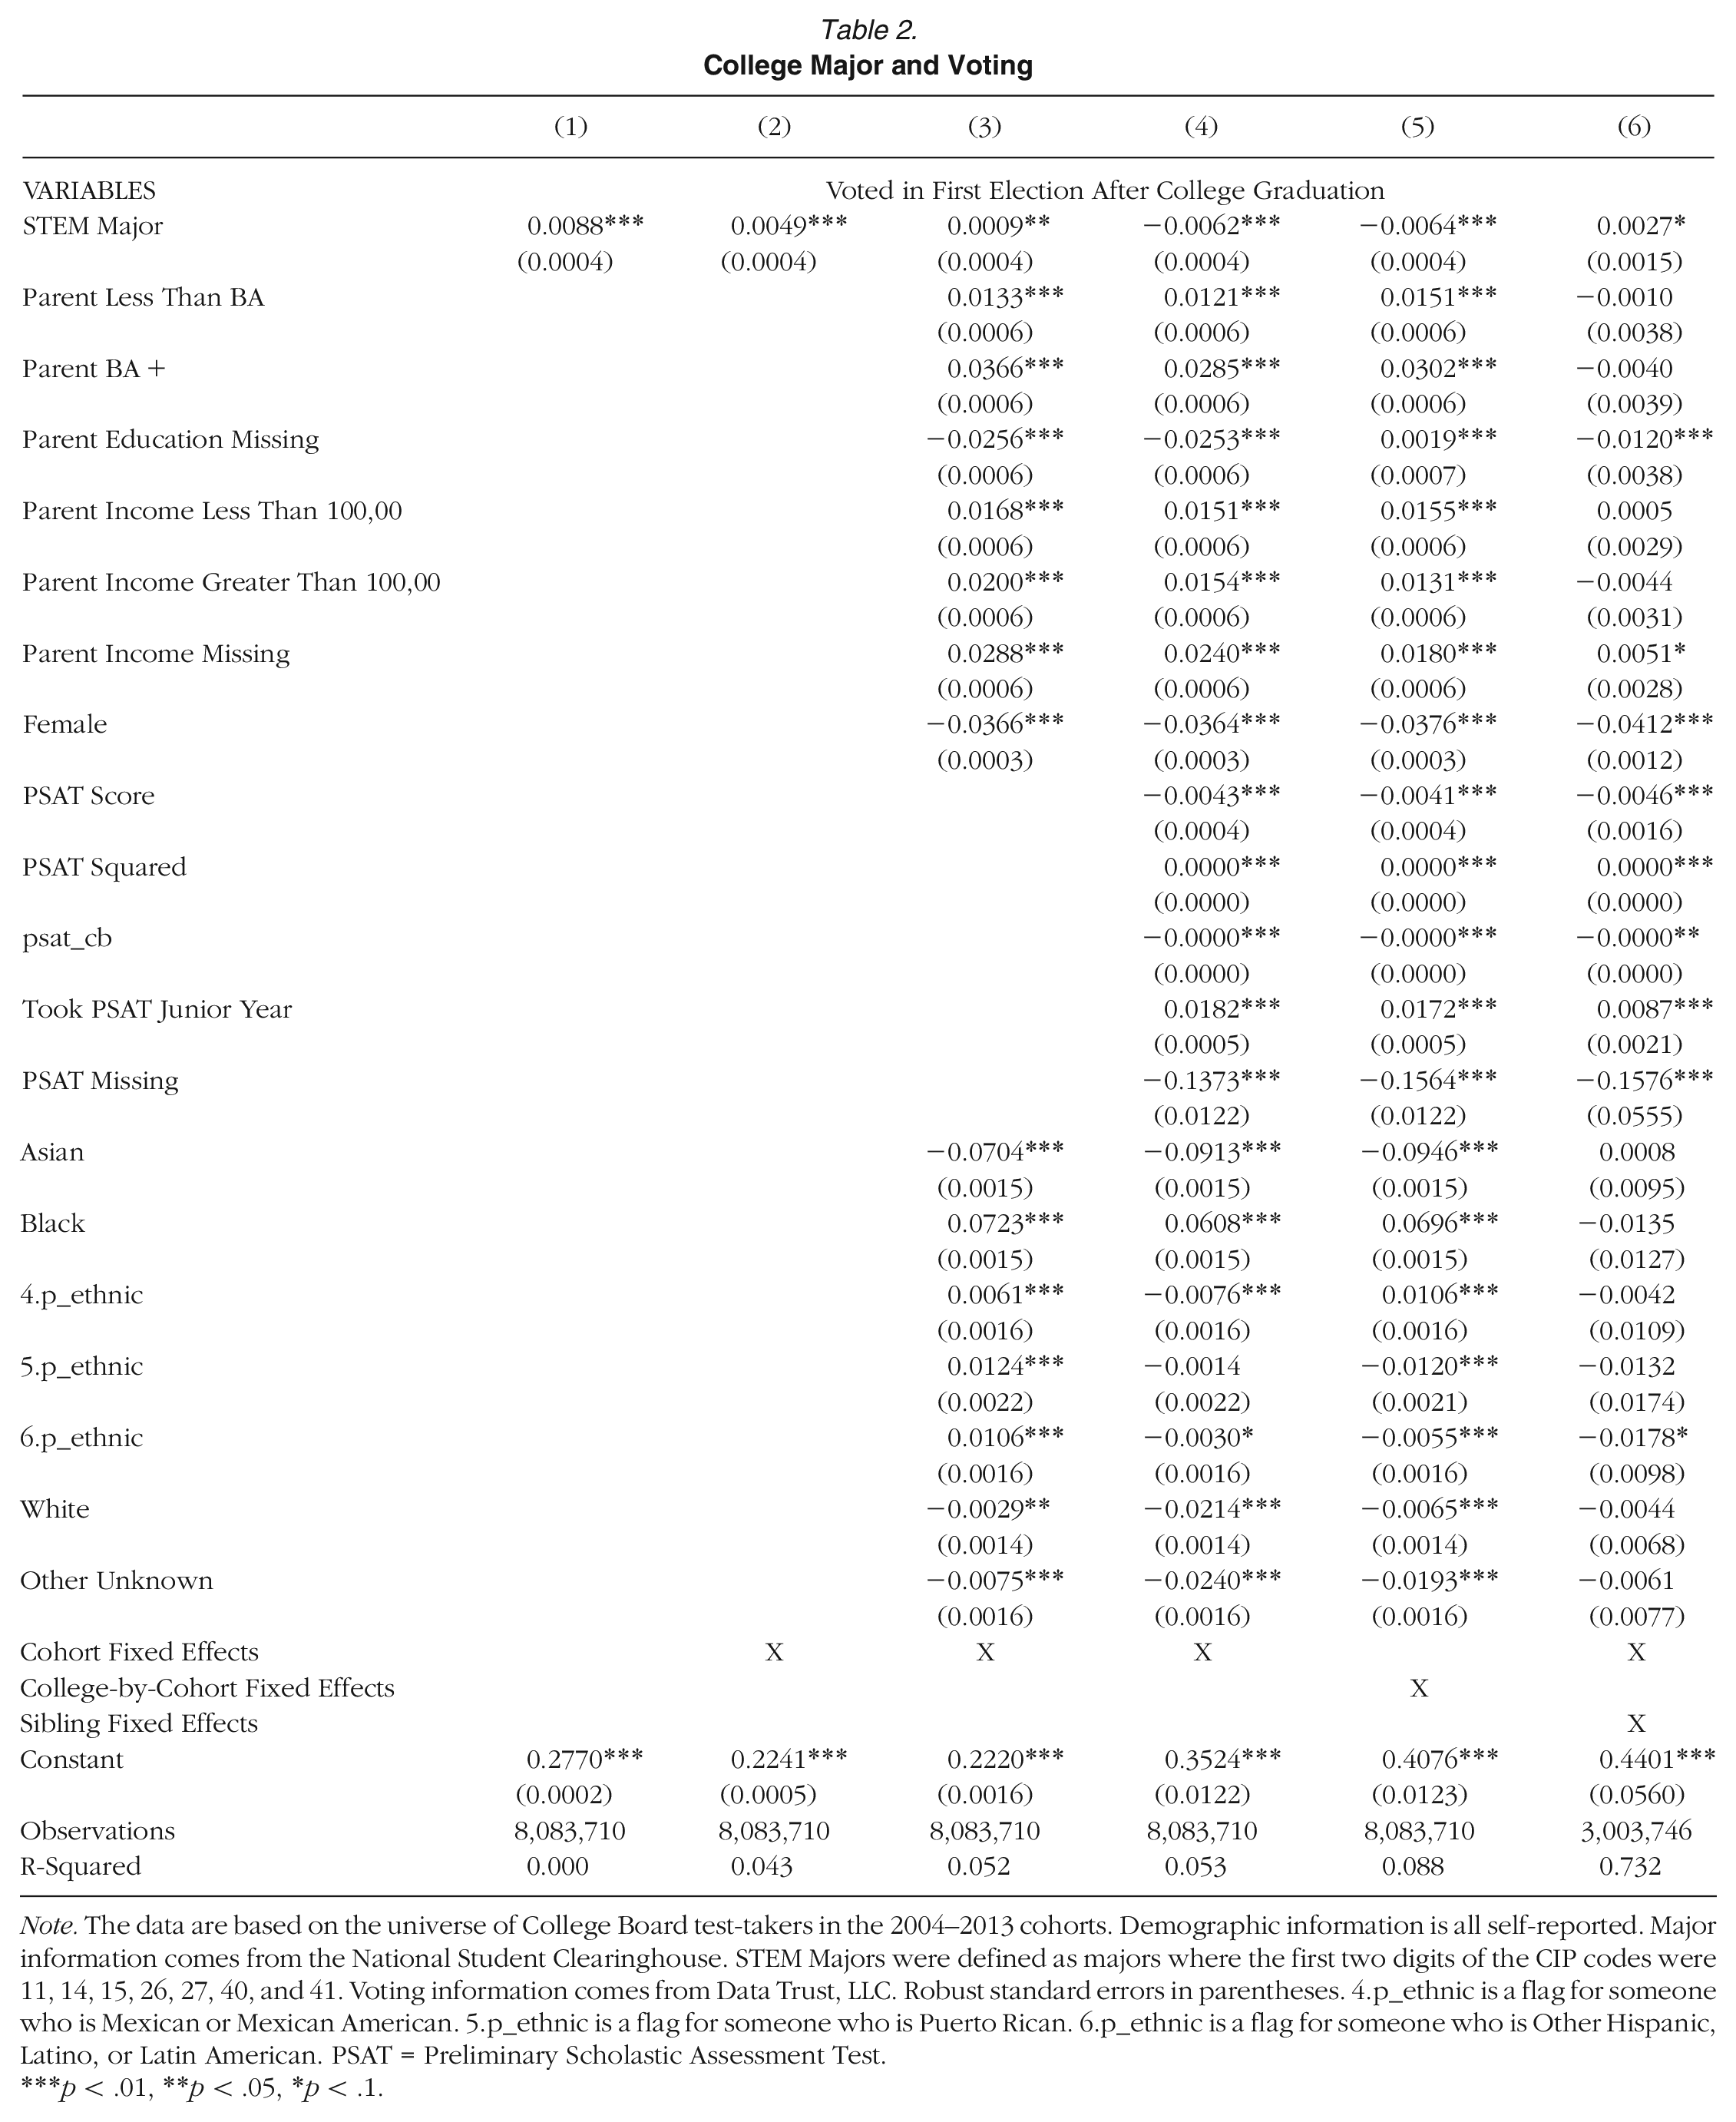
Note. The data are based on the universe of College Board test-takers in the 2004–2013 cohorts. Demographic information is all self-reported. Major information comes from the National Student Clearinghouse. STEM Majors were defined as majors where the first two digits of the CIP codes were 11, 14, 15, 26, 27, 40, and 41. Voting information comes from Data Trust, LLC. Robust standard errors in parentheses. 4.p_ethnic is a flag for someone who is Mexican or Mexican American. 5.p_ethnic is a flag for someone who is Puerto Rican. 6.p_ethnic is a flag for someone who is Other Hispanic, Latino, or Latin American. PSAT = Preliminary Scholastic Assessment Test.
p < .01, **p < .05, *p < .1.
Moving across the columns of Table 2, we see that adding in cohort fixed effects (Column 2) and controlling for demographics (Column 3) both attenuate the previous estimates. Adding in PSAT scores (Column 4), again flips the sign of the coefficient, suggesting a negative relationship between STEM majors and voting. Adding in college-by-cohort fixed effects (Column 5) does not appreciably change the estimates. Overall, Column 5 shows that students in the same college and cohort, with the same demographics and PSAT scores, who major in a STEM field, are slightly less likely to vote in their first election after college graduation (0.64 percentage points, 2.3%). Adding siblings fixed effects (Column 6) reverses the sign to be positive again, but small in magnitude.
Collectively, Table 2 shows that students who major in STEM are slightly less likely to vote than their non-STEM peers, after accounting for underlying differences between students. Similar to the AP course-taking analyses, we present additional findings in Appendices B and C that show the results are robust to the specification, potential matching issues, and alternative voting outcomes. We also show that when we control for whether the student voted in the first eligible election after high school, results are attenuated but qualitatively similar (Appendix Table C6). This last result suggests that not all the relationships between college major and voting can be explained by previous voting habits.
Next, we explore the relationship between each college major and voting after college graduation. We estimate coefficients using the fifth regression with controls for PSAT, demographics, and college-by-cohort fixed effects but, instead of using a single STEM major variable, we use a set of binary variables for taking each college major. Figure 3 shows the coefficient estimates of each major relative to the omitted category—other (uncommon) non-STEM majors. 23 Four of the five STEM majors show negative coefficients, including engineering, which is a very popular major. Computers and information sciences is the only coefficient that has a positive relationship with voting relative to the omitted other majors. Notably, history majors are 7 percentage points (25%) more likely to vote than the omitted other majors, even after accounting for the background factors and college enrolled. Some non-STEM majors have coefficients below zero, including business, but the magnitude of the coefficients are smaller than the humanities and social sciences on the rightmost of the figure.
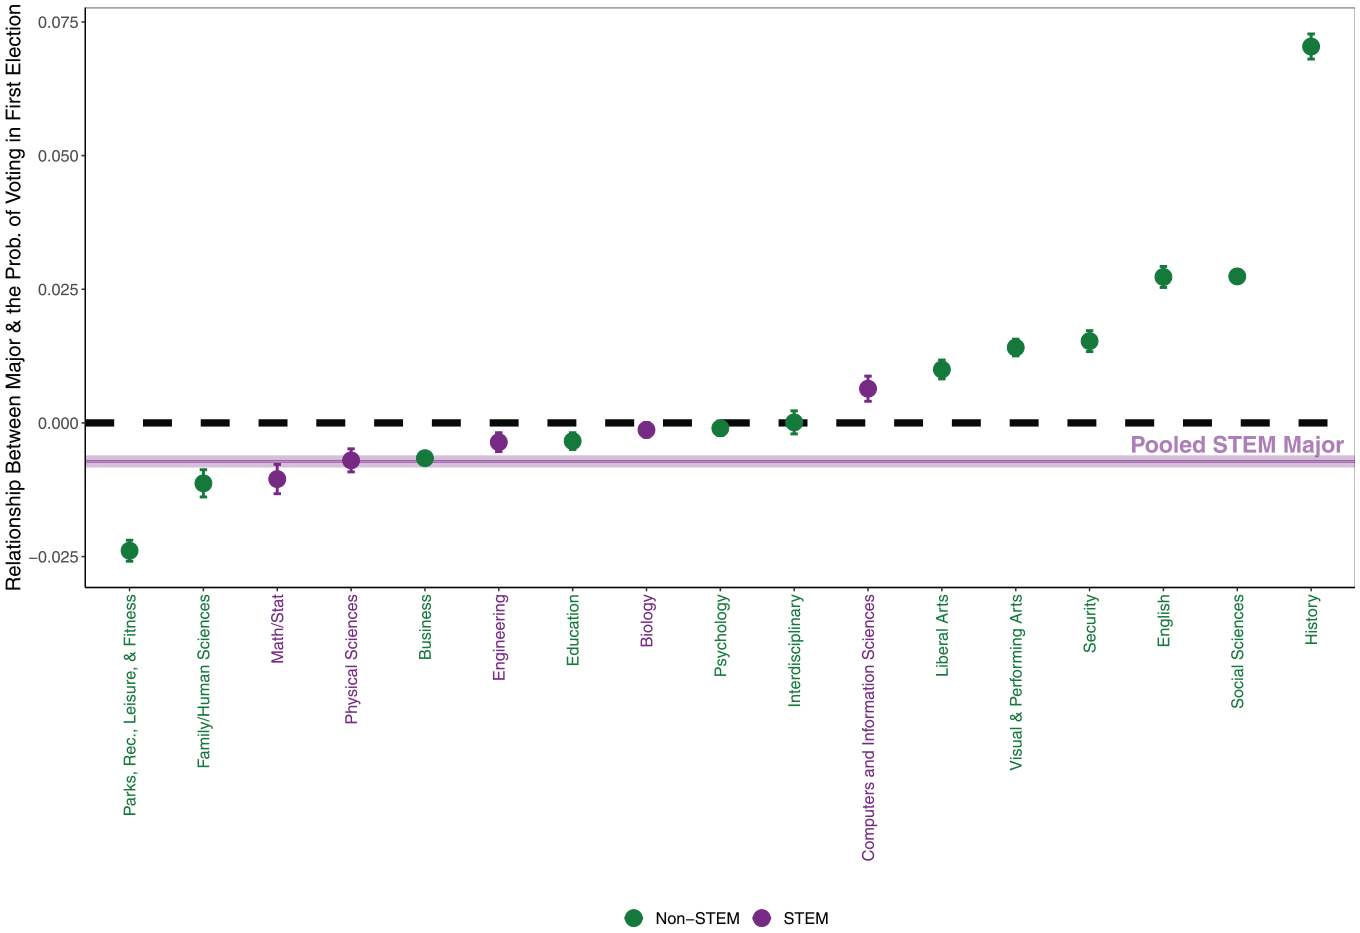
Relationship between major and the probability of voting in first election.
Discussion
This paper has documented the relationship between STEM coursework in high school and college with the propensity to vote. Overall, we find two consistent results. First, without adjusting for covariates, those who take AP STEM exams and who major in STEM fields are slightly more likely to vote. This is somewhat at odds with the prevailing wisdom and previous research (Teitelbaum, 2014; Ravitch & Viteritti, 2001; Board, 2015; Freeman, 2006; Xie & Killewald, 2012; Kelly et al., 2004; Lowell & Salzman, 2007; Casselman, 2014; Hillygus, 2005; Ro & Bergom, n.d.; Niemi & Hanmer, 2010). However, this unconditional relationship is substantively small by any reasonable benchmark. Second, after adjusting for covariates, the coefficient turns negative. However, again, these estimates remain small and only significant because of our abundance of statistical power. If anything, the changing signs of these relationships indicates that students with different attributes, which are correlated with voting rates, are also selecting into different coursework. Our results highlight the fact that examining how schooling and coursework causally impact voting or civic engagement requires accounting for student selection into those learning environments.
What should we make of the magnitudes of the relationship between STEM and voting being quite modest (with the exception of a few AP courses and majors)? This finding leads to two points of discussion. First, whether the noted differences are worthy of an intervention, say to increase the voting rates of a typical STEM student, relative to a typical non-STEM student, is not immediately clear. Many state and local governments, agencies, and educational institutions promote and require civics and non-STEM coursework to increase civic engagement. These may indeed be worthy measures, which could even explain such modest differences, but using these measures to further close any STEM versus non-STEM voting gaps may only have modest impacts.
A second related point is that although we cannot rule out additional sources of student selection, our rich dataset has ruled out several plausible sources of selection. As such, our estimates are likely to be conservative on the causal impacts of AP coursework or college majors on these voting outcomes. Some individual courses and majors, such as social science, have as much as a 4 percentage point (15%) higher probability of voting than some STEM majors. This suggests that the upper bound of the causal impact of certain types of non-STEM coursework may in fact be large. Additionally, the combination of STEM and non-STEM coursework may be an important factor in voting rates, something we do not explicitly explore in our high school or college analyses. Future research or policymakers can consider the magnitudes of our estimates when considering what to expect from any policy or intervention targeted at STEM (or non-STEM) students or coursework.
Our work has important implications for both theory and practice. Our results shine light on an area that has had much theorizing, but far less empirical work. Namely, our results help to start to unpack the role that a person's educational experiences play in shaping the next generation of active voters. Education has long played a key role in models of voting—from those that focus on rational-choice explanations of voter turnout to those that emphasize the important role that resources play. Unfortunately, the focus on education has rarely gone beyond attainment itself; indeed, little to no research has considered how variation in a person's educational experience during this key period shapes voting. Our work helps to unpack a core part of the education experience—the content/majors that a student chooses to enroll in. In so doing, we take an important next step in unpacking the education-participation connection.
Practically speaking, our work shines light on areas of active policy debate. In total, our work provides evidence that the role of STEM in shaping the next generation of voters is much more nuanced than previous studies have suggested. The nuance includes, but is not limited to, how we define and categorize students as STEM and how the relationship between that definition of STEM and voting differs by election and personal characteristics. Effects that we observe are much smaller than previous (primarily survey-based) research has suggested. Our results imply that the connection between STEM and voting is much more modest than others have suggested. As such, our work provides important context for those who have fretted about the increased focus on STEM in contemporary education policy.
Supplemental Material
sj-pdf-1-aer-10.3102_00028312231200232 – Supplemental material for Do STEM Students Vote?12
Supplemental material, sj-pdf-1-aer-10.3102_00028312231200232 for Do STEM Students Vote?12 by D’Wayne Bell, Jing Feng, John B. Holbein and Jonathan Smith in American Educational Research Journal
Footnotes
Notes
D’W
J
J
J
References
Supplementary Material
Please find the following supplemental material available below.
For Open Access articles published under a Creative Commons License, all supplemental material carries the same license as the article it is associated with.
For non-Open Access articles published, all supplemental material carries a non-exclusive license, and permission requests for re-use of supplemental material or any part of supplemental material shall be sent directly to the copyright owner as specified in the copyright notice associated with the article.