
Abstract
Objective:
To compare the hippocampal volume between individuals with normal cognitive function (CN) and those with Alzheimer’s disease (AD) using the European Alzheimer’s Disease Consortium (EADC)-Alzheimer’s Disease Neuroimaging Initiative (ADNI) Harmonized Hippocampal Protocol (HarP).
Methods:
This retrospective study included 84 participants (42 individuals each in the AD and CN groups) from April 30th Hospital (Ho Chi Minh City, Vietnam). The AD diagnosis adhered to the Diagnostic and Statistical Manual of Mental Disorders, Fifth Edition. Participants underwent neuropsychological tests and whole brain magnetic resonance scans for cognitive function and hippocampal volume assessments. The AD participants were categorized into four subgroups based on the severity of their cognitive decline, determined using the Mini-Mental State Examination scores (AD1: 5=24, AD2: 20-23, AD3: 14-19, and AD4: 0-13). Qualified radiologists used HarP to measure the whole and sectional hippocampal volumes. Statistical analyses were performed to compare the hippocampal volume differences between the AD and CN groups considering disease severity, sex, and age. A multifactor regression analysis was conducted to explore the predictive factors for hippocampal volume.
Results:
The neuropsychological test findings (p-value < 0.001), but not demographic data (sex, education, body mass index, medical history), were significantly different among the AD subgroups. The whole (AD: 4.158 ± 0.989 cm3; CN: 5.884 ± 0.517 cm3) and sectional hippocampal volumes were significantly different between the AD and CN groups (p-value < 0.0001). Specifically, the whole and sectional hippocampal volumes were significantly different between the AD2 subgroup and CN group (p-value < 0.05). Besides, multifactor regression analysis showed a minimal impact of the demographic factors on the whole hippocampal volume.
Conclusion:
Our study highlights the association between AD and reduced hippocampal volume, emphasizing its significance in the disease’s pathology. Our data support the effectiveness of the HarP in measuring hippocampal volume.
Keywords
1 Background
Alzheimer’s disease (AD) is the most common type of dementia [1]. Unfortunately, the effective treatment for AD has not been established yet [2]. Globally, dementia affects approximately 50 million individuals, with two-thirds of these cases having AD [3]. It is estimated that there will be a 71% increase in dementia prevalence by 2050, with approximately 45% of cases expected in Asian countries, including Vietnam [3, 4]. Epidemiological studies in Northern and Southern Vietnam indicate a 4.8%-5% prevalence of cognitive decline among those aged >60 years, translating to roughly 500,000 affected individuals in Vietnam [5]. The worldwide economic burden of AD is immense, reaching approximately one trillion dollars [4]. Beyond the financial impact, the human cost of dementia is profound and far-reaching. Thus, identifying and validating biomarkers for early diagnosis and monitoring disease progression is essential.
AD progresses through several stages, each marked by increasing severity in cognitive decline and brain atrophy. It typically begins with mild cognitive impairment, where memory and cognitive issues become noticeable but do not yet considerably interfere with daily life. As the disease advances, these impairments worsen through mild, moderate, and eventually severe stages, severely impacting the individual’s daily functioning. Understanding how hippocampal volume changes across these stages is crucial, as the hippocampus is a key region affected by AD-related atrophy. Investigating these changes may reveal patterns that align with or deviate from the expected disease progression.
The definitive diagnosis of AD is traditionally confirmed by post-mortem studies, revealing amyloid-beta 42 (A|342) deposits in the brain [6]. Magnetic resonance imaging (MRI) is a vital diagnostic tool in living patients, leveraging its high tissue contrast, resolution, and sensitivity [7]. Structural imaging, particularly the study of brain changes, is crucial in assessing AD progression [8]. In clinics, the AD biomarkers include (1) cerebrospinal fluid analysis for Aβ1-42, total tau, and phosphorylated tau proteins [9]; (2) structural neuroimaging, such as brain MRI and volumetric measurements of structures such as the hippocampus [10]; and (3) functional neuroimaging, including metabolic studies with fluorodeoxyglucose-positron emission tomography (PET) and protein labeling studies with amyloid or tau PET [11]. However, PET imaging is costly and not widely available, and cerebrospinal fluid analysis is invasive and expensive, particularly in Vietnam. MRI is more accessible and affordable in this context cortical atrophy in AD patients tends to appear earlier and progress more rapidly in the left hemisphere. The hippocampus, particularly noted for its atrophy in AD patients as compared to that of healthy individuals, is a crucial focus of neuroimaging research [12]. Hippocampal atrophy is a core biomarker in the revised National Institute on Aging-Alzheimer’s Association diagnostic criteria for AD and is sensitive to disease progression [13, 14].
There are various methods for hippocampal segmentation, including manual, semi-automatic, and automatic techniques, with manual segmentation being the gold standard [14, 15]. However, the considerable variations in measurement protocols across studies have limited the comparability of hippocampal volume data in AD research [16]. The European Alzheimer’s Disease Consortium and Alzheimer’s Disease Neuroimaging Initiative jointly developed the harmonized hippocampal protocol (HarP) for standardizing hippocampal segmentation on MRI [17]. Although manual segmentation is considered the gold standard, developing artificial intelligence models for AD diagnosis necessitates validating automatic segmentation methods. However, the applicability and accuracy of these automated tools in Asian populations, including Vietnam, remain understudied, which can affect the clinical utility of MRI biomarkers [18, 19].
Among the automatic segmentation tools, FreeSurfer is the most used package for brain surface-based analysis and segmentation from T1-weighted MRI. Despite its widespread use, the accuracy of such automatic tools, including FreeSurfer, can be compromised by potential technical and race-specific physiological variabilities. Recent findings have demonstrated considerable differences in cortical thickness between cognitively healthy elderly East Asians and Caucasians [18]. Furthermore, FreeSurfer reportedly exhibits a low accuracy in segmenting MRIs of East Asian patients [19]. These findings highlight the need to evaluate automatic segmentation tools for the Asian population.
The present study aimed to analyze the hippocampal volume biomarkers in Vietnamese AD patients by using the HarP, which is the gold standard segmentation technique for the hippocampus. We then compared the hippocampal volume measurements obtained using manual and automatic segmentation methods. Additionally, we further classified the AD group into four subgroups based on the severity of their cognitive decline to examine whether hippocampal volume atrophy is consistent across the stages. Given the lack of Vietnamese research studies on MRI biomarkers in AD, our study provides novel insights into hippocampal volume quantification in 42 Vietnamese diagnosed with AD and 42 healthy controls.
2 Material and methods
2.1 Study design
Our research workflow comprised three main steps, including participant recruitment, data preprocessing, and data analysis. A visual summary of the study design and workflow is shown in
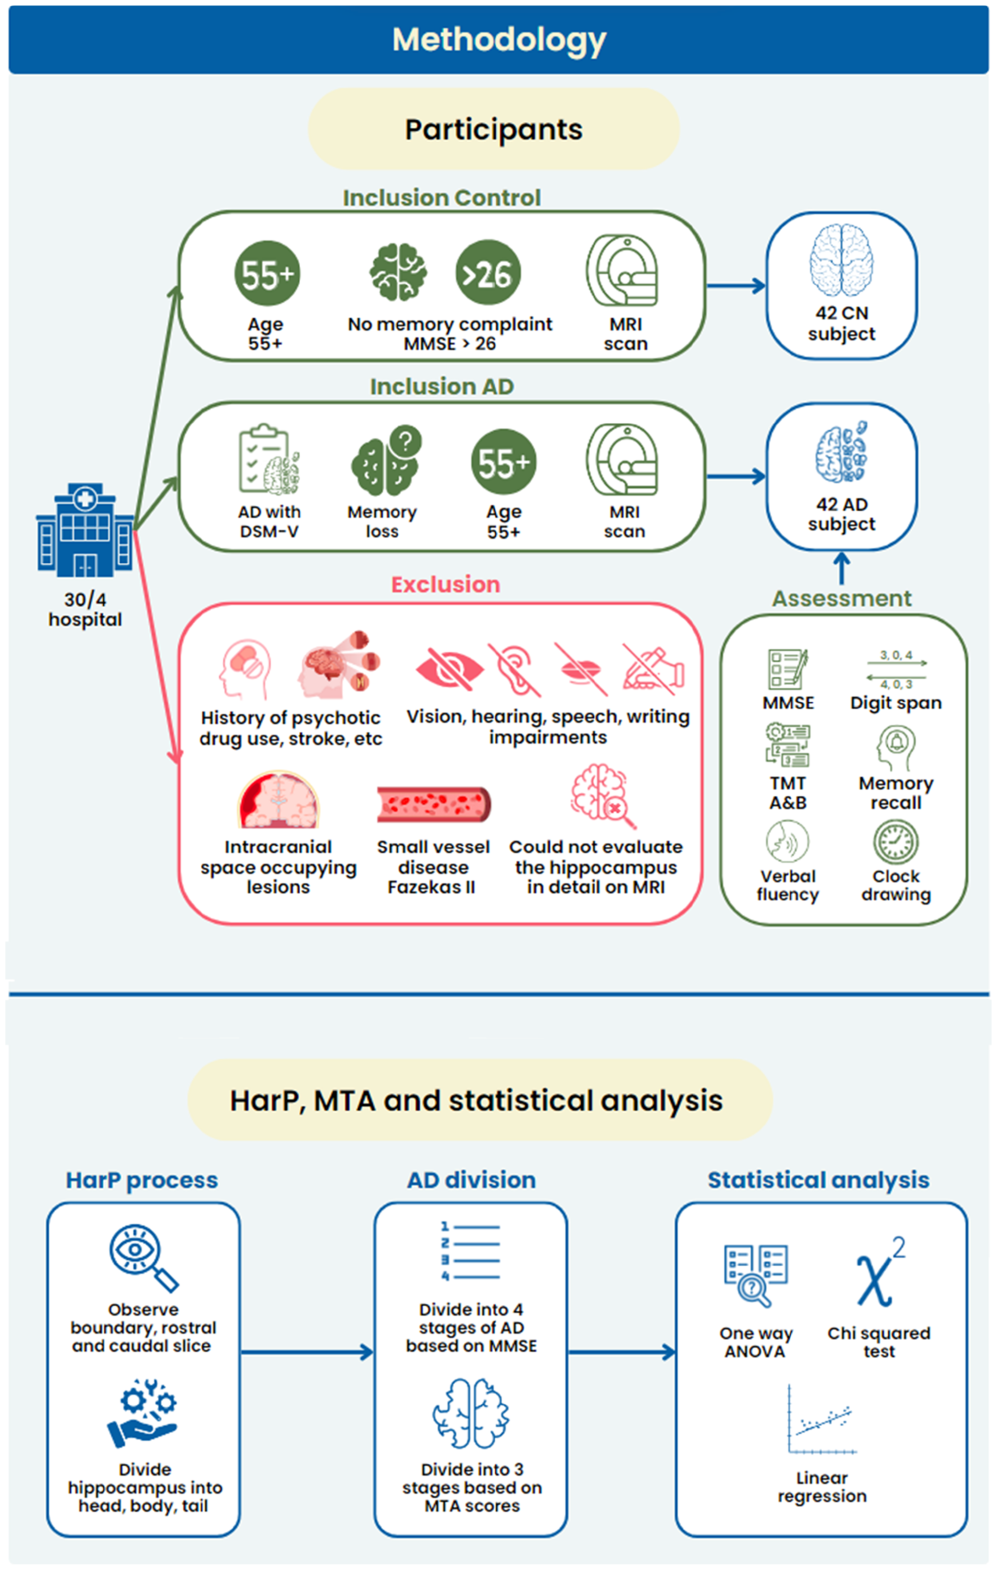
Study design and workflow of this study to obtain, preprocess, and analyze data using the harmonized hippocampal protocol (HarP)
2.2 Participants
This retrospective cross-sectional study included participants recruited at April 30th Hospital (Ho Chi Minh City, Vietnam) from October 2018 to October 2021. We selected 84 study participants (42 AD patients and 42 individuals with CN) who underwent MRI scans for unrelated medical reasons. The inclusion criteria for both the AD and control groups are described below.
For the AD group, participants aged ≥55 years from the Memory and Dementia Unit were recruited. Moreover, they must meet the diagnostic criteria for Alzheimer’s according to the DSM-5 guidelines. The assessment of cognitive functions was conducted by evaluating various symptoms, including memory loss, aphasia, apraxia, agnosia, and executive dysfunction. Each AD participant underwent various neuropsychological tests for cognitive function evaluation and a whole brain MRI for hippocampal volume measurement. Fluid biomarker studies and molecular imaging, such as amyloid PET, were not performed to confirm the presence of AD pathology in this study. This approach aligns with the study’s retrospective design and the study setting’s standard clinical practice, where fluid biomarkers and amyloid PET scans are not routinely used for AD diagnosis due to cost constraints and limited availability. In Vietnam, where this study was conducted, PET is particularly cost-prohibitive, with the cost of a single scan being approximately six times the average monthly salary of a Vietnamese. Furthermore, neither PET nor fluid biomarker tests are part of the standard diagnostic protocol for AD in Vietnam. The present study relies on established clinical criteria for probable AD, which reflects the typical diagnostic process in the clinical environment where the research was conducted. This approach aligns with the DSM-5 criteria, which allows for a diagnosis of probable AD based on the signs of memory and cognitive decline, along with brain atrophy. Although we recognize this as a limitation that may affect the specificity of AD diagnosis, we believe that our approach provides valuable preliminary insights that can guide more comprehensive studies, incorporating advanced diagnostic techniques, in the future.
Contrarily, the CN group comprised Vietnamese individuals aged ≥55 years with normal cognitive function. These individuals were selected from the pool of individuals visiting the hospital for examination and treatment between October 2018 and October 2021 who underwent brain MRI for diseases without having AD or memory complaints. The cognitive functions of the CN group were assessed by using the Mini-Mental State Examination (MMSE), with scores of >26 indicating normal cognitive function. They also underwent MRI using an imaging protocol similar to that used for AD patients.
The exclusion criteria include (1) those with a history of psychotic drug use or alcoholism, acute cerebrovascular accident within the last 6 months, head trauma, or other central nervous system diseases; (2) those with impaired listening, speaking, reading, and writing functions; (3) those with hearing and vision losses; (4) those whose MRI scans revealed intracranial space-occupying lesions or cerebral small vessel disease Fazekas II; (5) those with acute cerebral infarction or cerebral edema; and (6) those whose hippocampus could not be evaluated in detail on MRI.
This retrospective study was approved by the Research Ethics Committee of April 30th Hospital, and the study participants as well as caregivers or patients provided written informed consent before participating in the study. Data collected from the medical records included the participants’ neuropsychological test’s results, MRI findings, age, sex, educational level, symptom duration, family history, history of hypertension, heart disease, stroke, and diabetes, and smoking and drinking habits.
2.3 Assessment instruments
We conducted comprehensive clinical assessments, including neurological and neuropsychological assessments, to evaluate cognitive function in both groups. All tests were performed by expert neurologists. To assess global cognition, the Vietnamese version of the MMSE was utilized, which provides a comprehensive measure of the overall cognitive function of both the AD and CN groups.
For the AD group, the following additional neuropsychological assessments were performed: (1) attention abilities were evaluated using the digit span forward and digit span backward tests, which assess the individual’s capacity to sustain and manipulate attentional focus; (2) language fluency, specifically semantic fluency, was assessed through tests requiring participants to generate as many animal names as possible within a specific time frame; (3) memory capabilities were evaluated using immediate recall, delayed recall, and delayed recognition tasks, which measured the participant’s ability to remember and recognize information; and (4) processing speed and attention were assessed using the Trail Making Test Part A (TMT-A), which measures visual motor speed and attentional flexibility. For working memory and executive functions, the Trail Making Test Part B (TMT-B) was administered, focusing on mental flexibility and task-switching abilities. However, since TMT-B has many missing values, Table 1 does not include the TMT-B data, and the TMT-A data has many entries without specific times, the table summarizes the number of patients who met and did not meet the criteria, with the benchmark being ≤180 seconds. Additionally, the clock drawing test was utilized to assess the participants’ executive functions and visuospatial abilities.
Neuropsychological and cognitive assessments among the AD subgroups
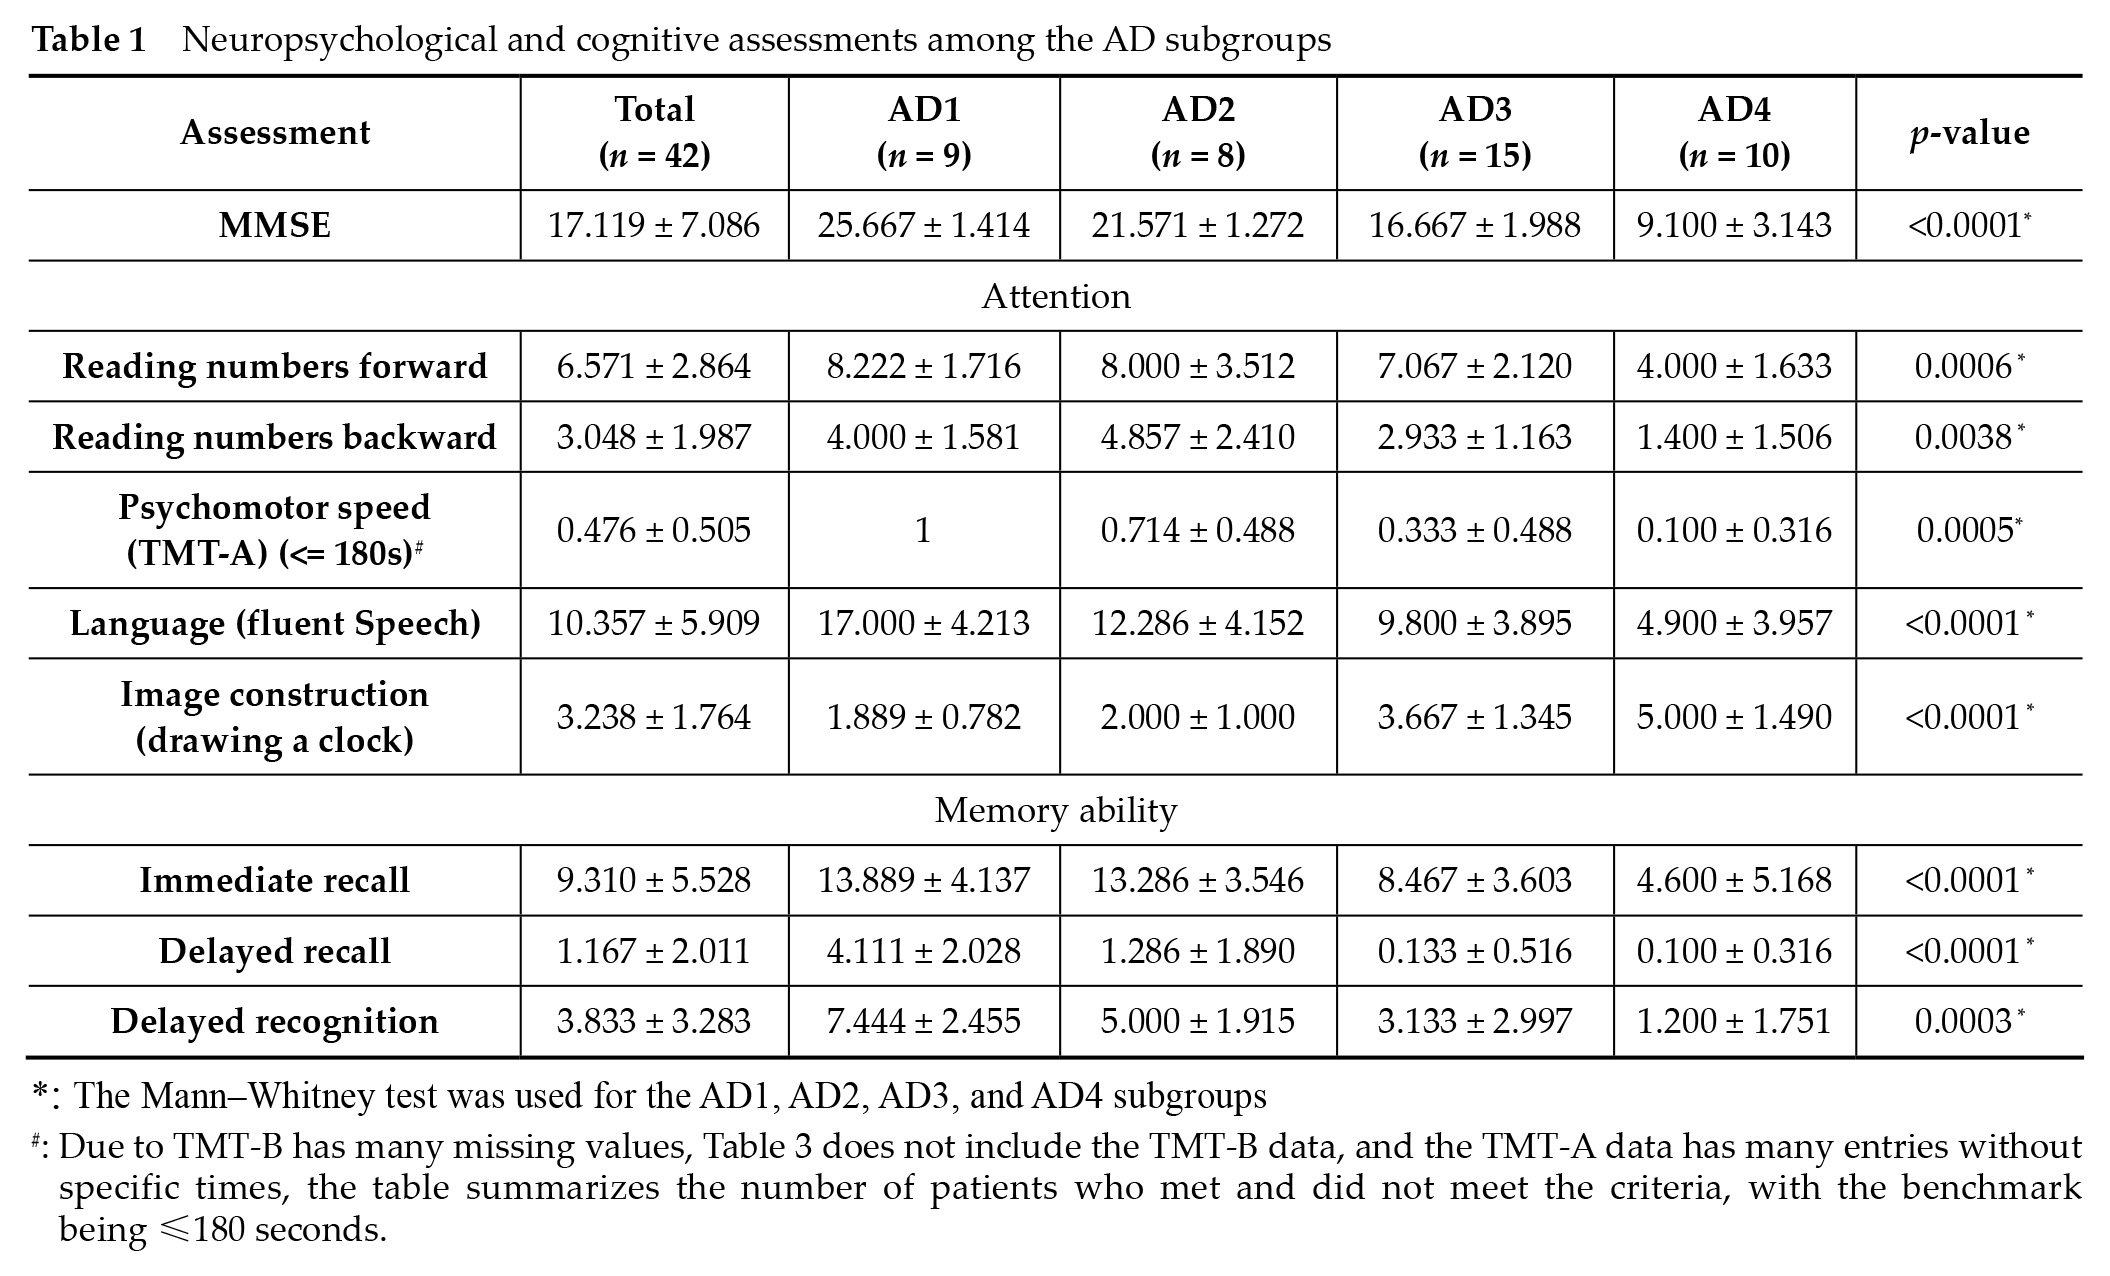
: The Mann-Whitney test was used for the AD1, AD2, AD3, and AD4 subgroups
#: Due to TMT-B has many missing values, Table 3 does not include the TMT-B data, and the TMT-A data has many entries without specific times, the table summarizes the number of patients who met and did not meet the criteria, with the benchmark being ≥180 seconds.
The AD patients were stratified into four subgroups according to the severity of their disease, as determined by their MMSE scores. This stratification was inspired by the work of Vyas et al. [20], who suggested using MMSE scores to delineate the different AD stages [20]. The AD subgroups were as follows: level 1 (AD1), ≥24 points (n = 9, very mild cognitive impairment or early-stage AD); level 2 (AD2), 20-23 points (n = 8, mild AD); level 3 (AD3), 14-19 points (n = 15, moderate AD); and level 4 (AD4), 0-13 points (n = 10, severe AD).
These groups differ slightly from those of Vyas et al. [20], as our ranges were adjusted to better fit our sample distribution while still maintaining the overall structure of severity classification. This approach enables us to explore the potential differences across the spectrum of AD severity while closely aligning with the established categories. We acknowledge that the uneven sample sizes across the groups is a limitation of this preliminary study, which aims to explore the trends and provide a foundation for future, larger-scale investigations.
2.4 MRI procedure
2.4.1 The technical specifications of cranial MRI
We employed an MRI apparatus with a field strength of 1.5 Tesla, specifically a Magnetom Avanto SN: 26664 model produced by Siemens in 2008. T2, Flair, Diffusion-weighted imaging (DWI) and Hemorrhage (HEMO) images were employed for regular brain examinations, with a slice thickness of 5 mm and a spacing of 2 mm. Furthermore, a sequence of T1-weighted magnetization-prepared rapid gradient echo (MPRAGE) pulses with a thickness of 1 mm was employed to examine the temporal lobe. The MRI orientation is determined on the sagittal view, by the line connecting the brain’s anterior and posterior commissures (AC-PC line). The coronal slices used for segmentation are resliced orthogonal to this plane.
2.4.2 MRI conduction
Initially, the patient should be placed in a supine position on the examination table, with their cranial region oriented toward the machine compartment. Subsequently, the scout-view was configured. The morphological diagnostic pulse sequences, namely T2W, FLAIR, DWI, HEMO, and planes, including the axial, sagittal, and coronal planes, were chosen in this study. The T1-MPRAGE pulse acquired the MPR data, which were subsequently utilized to reconstruct the imaging planes. Afterward, the acquired data should be transferred to the Syngovia system to measure the hippocampus by using the HarP. The data collected were documented on the designated sample sheet, whereas the corresponding images were archived in both the Pacs and Syngovia systems.
2.5 Hippocampal volume assessment using the EADC-ADNI HarP
The volume of each hippocampus was determined using MRIcroGL version 1.2 software from the University of South Carolina, following the EADC-ADNI HarP procedure [21]. Owing to the complex anatomy of the hippocampus and variations in the procedure for identifying each hippocampal section across different centers, a Delphi panel in 2015 determined that the EADC-ADNI HarP is highly stable and serves as a reference standard for manual hippocampal measurements [13, 21].
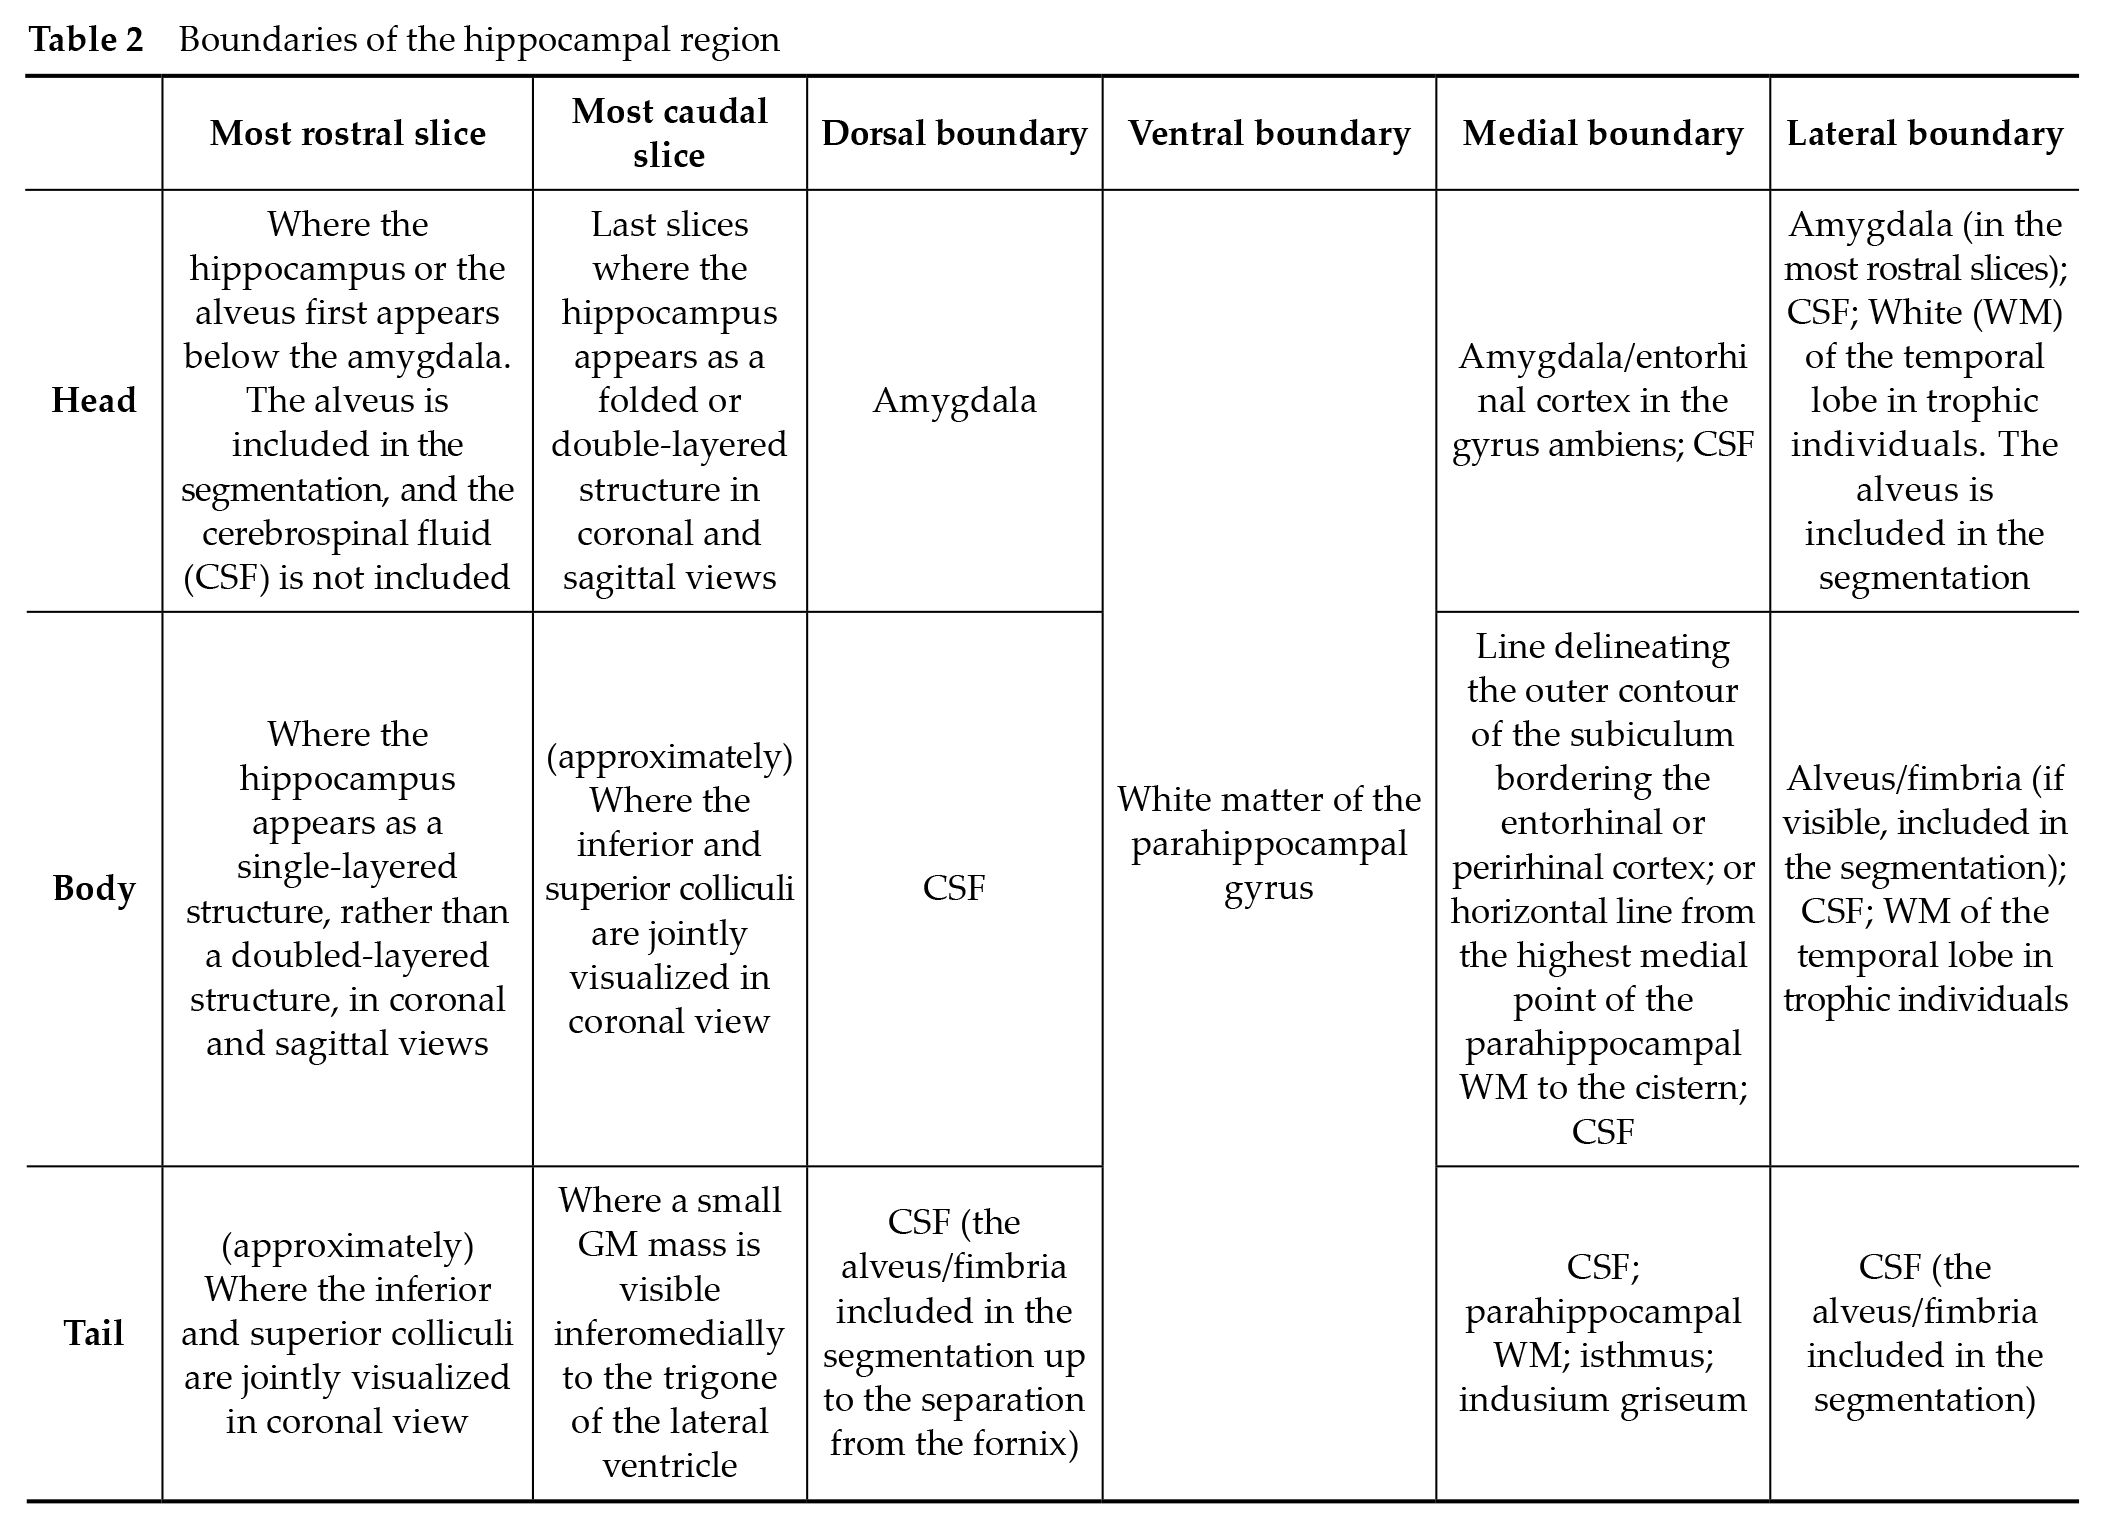
In this procedure, the hippocampus is divided into the following three parts: head, body, and tail. The head is the anterior part of the hippocampus and appears as either a folded or a bilayered structure in the coronal plane. The body is anteroposteriorly oriented, whereas the hippocampus is a single structure that is not folded in the sagittal plane and has only one layer in the coronal plane. The tail is the final portion of the hippocampus, beginning at the slice where the colliculus first appears. The criteria for identifying each part of an MR image are summarized in
Boundaries of the hippocampal region
2.6 Statistical analysis
All statistical analyses in this study were performed by GraphPad Prism Software version 8.3.1, with p-value of <0.05 considered statistically significant. The normal distribution assumption in this study was assessed by using the Shapiro-Wilk test. Continuous data were presented as mean ± standard deviation for variables following a normal distribution, whereas the non-normally distributed variables were reported as medians with quartiles and extreme values. Qualitative data were expressed as percentages and assessed by χ2 test to compare the proportions between the groups. Independent-samples t-tests were employed for normally distributed continuous variables, whereas the non-parametric tests, including the Mann-Whitney U test, were used for non-normally distributed continuous variables. The study employed the one-way analysis of variance and Tukey’s post-hoc analysis to examine the variation in the hippocampal volume across various subgroups of AD patients with varying degrees of severity and the control group. Moreover, the present study employed a multifactor regression analysis approach to examine the impact of independent variables, including sex, age, education, body mass index (BMI), hypertension, and diabetes, on the dependent variable, i.e., whole hippocampal volume. This regression analysis allowed the examination of potential associations and predictive factors related to hippocampal volume.
3 Results
3.1 Participants
Altogether, 84 participants, equally divided into the AD and CN groups, were enrolled in this study. The AD group was further divided into the following four subgroups: AD1 (n = 9), AD2 (n = 8), AD3 (n = 15), and (n = 10). As observed in
The participants’ demographic information
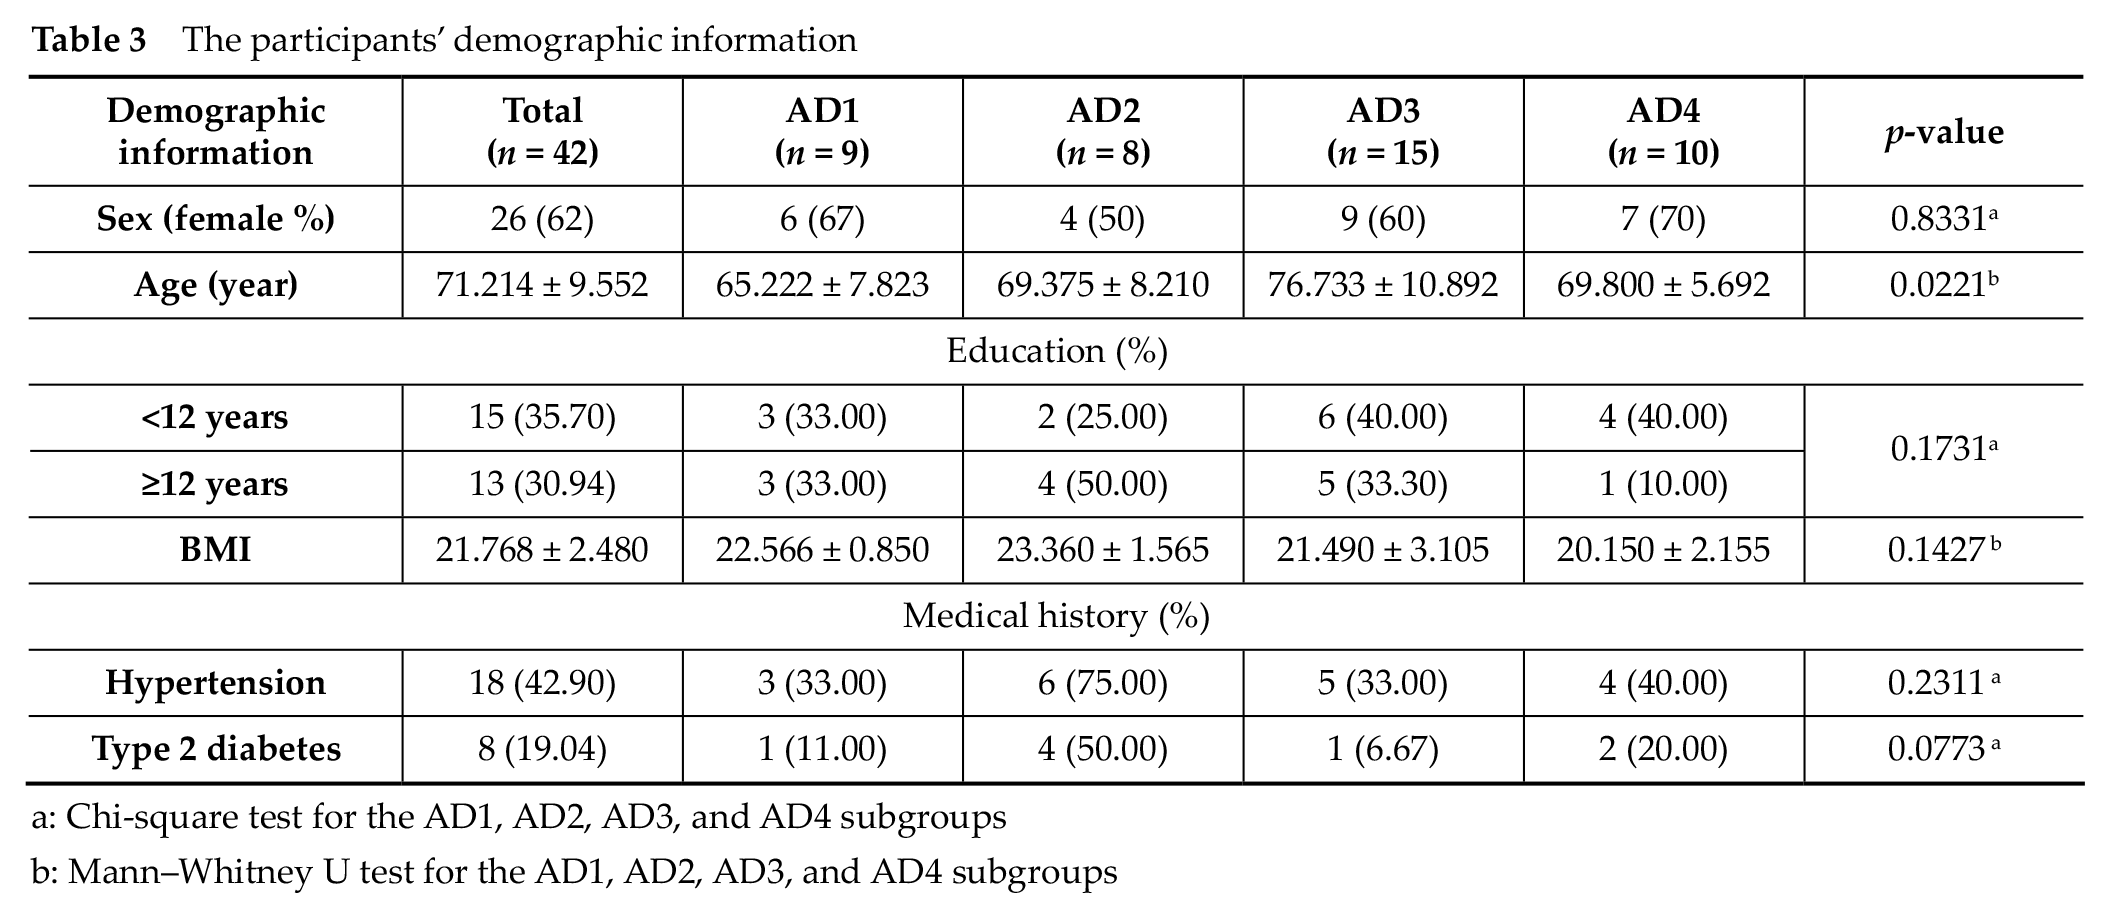
a: Chi-square test for the AD1, AD2, AD3, and AD4 subgroups
b: Mann-Whitney U test for the AD1, AD2, AD3, and AD4 subgroups
Table 1 shows a comparison of the neuropsychological and cognitive assessment findings among the AD subgroups. Among the 42 participants, the MMSE scores varied significantly across the subgroups, with the AD1 and AD4 subgroups scoring the highest and lowest at 25.667 and 9.1, respectively (p < 0.0001). Attention, psychomotor speed, language, and memory ability tests showed a significant performance decrease with increasing AD severity. Conversely, in the image construction test, AD4 and AD1subgroups had the highest and lowest average scores, respectively (p < 0.0001).
3.2 Analysis of the whole and sectional volumes of the hippocampus
The HarP is utilized to analyze hippocampal volume differences between the CN and AD groups, providing insights into the hippocampal structural changes in AD and their correlation with clinical and demographic factors. Table 4 shows a comparison of the whole and sectional hippocampal volumes between the AD and CN groups. The whole volume and sectional volume of the hippocampus in the AD group is smaller than in the CN group (p-value < 0.0001).
Whole and sectional hippocampal volumes of the AD and CN groups
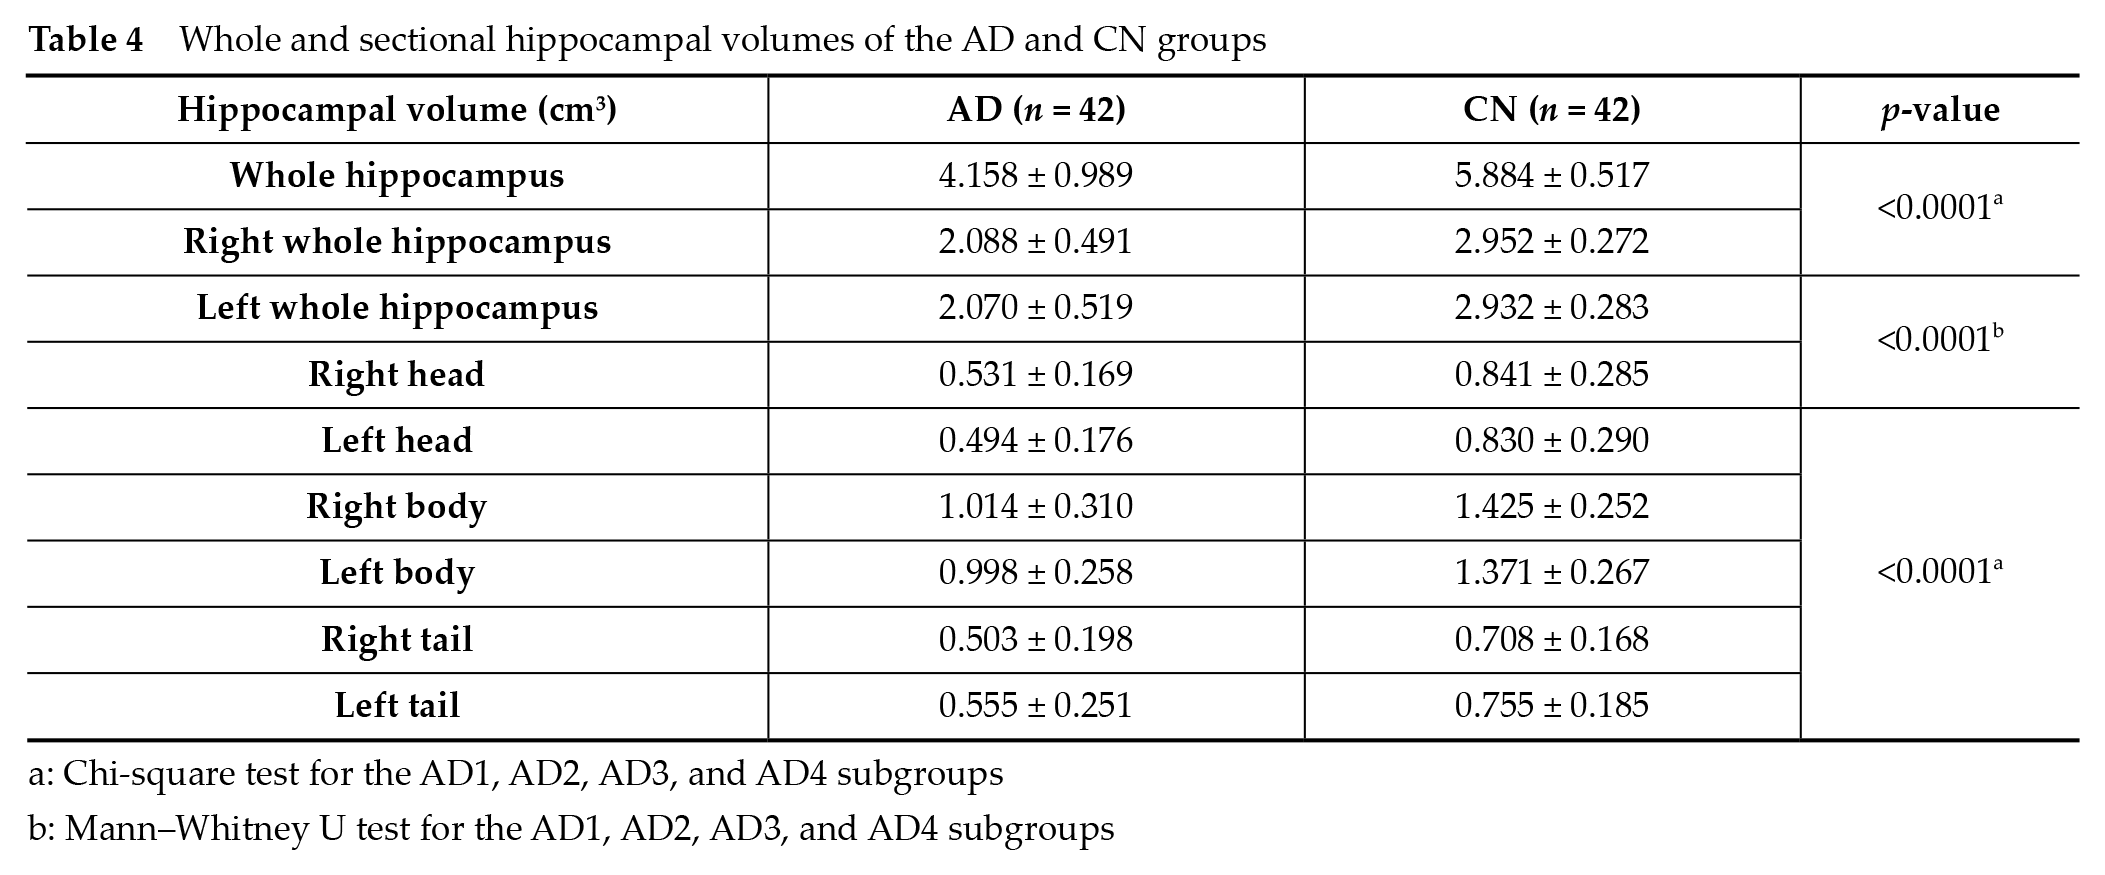
a: Chi-square test for the AD1, AD2, AD3, and AD4 subgroups
b: Mann-Whitney U test for the AD1, AD2, AD3, and AD4 subgroups
3.3 Analysis of the whole and sectional hippocampal volume according to disease severity
When comparing the whole hippocampal volume between the CN and AD1 groups, between the AD2 and AD3 groups, and between the AD3 and AD4 groups, significant differences were observed. The whole hippocampal volumes were 5.231 ± 0.827, 4.319 ± 0.904, and 3.475 ± 0.71 cm3 for the AD1, AD2, and AD3 subgroups, respectively (p < 0.0001). However, upon analyzing the sectional hippocampal volumes, the AD2 subgroup showed a larger right whole and right body hippocampal volumes than the AD3 subgroup (p < 0.0001), but no significant differences were observed in the other regions
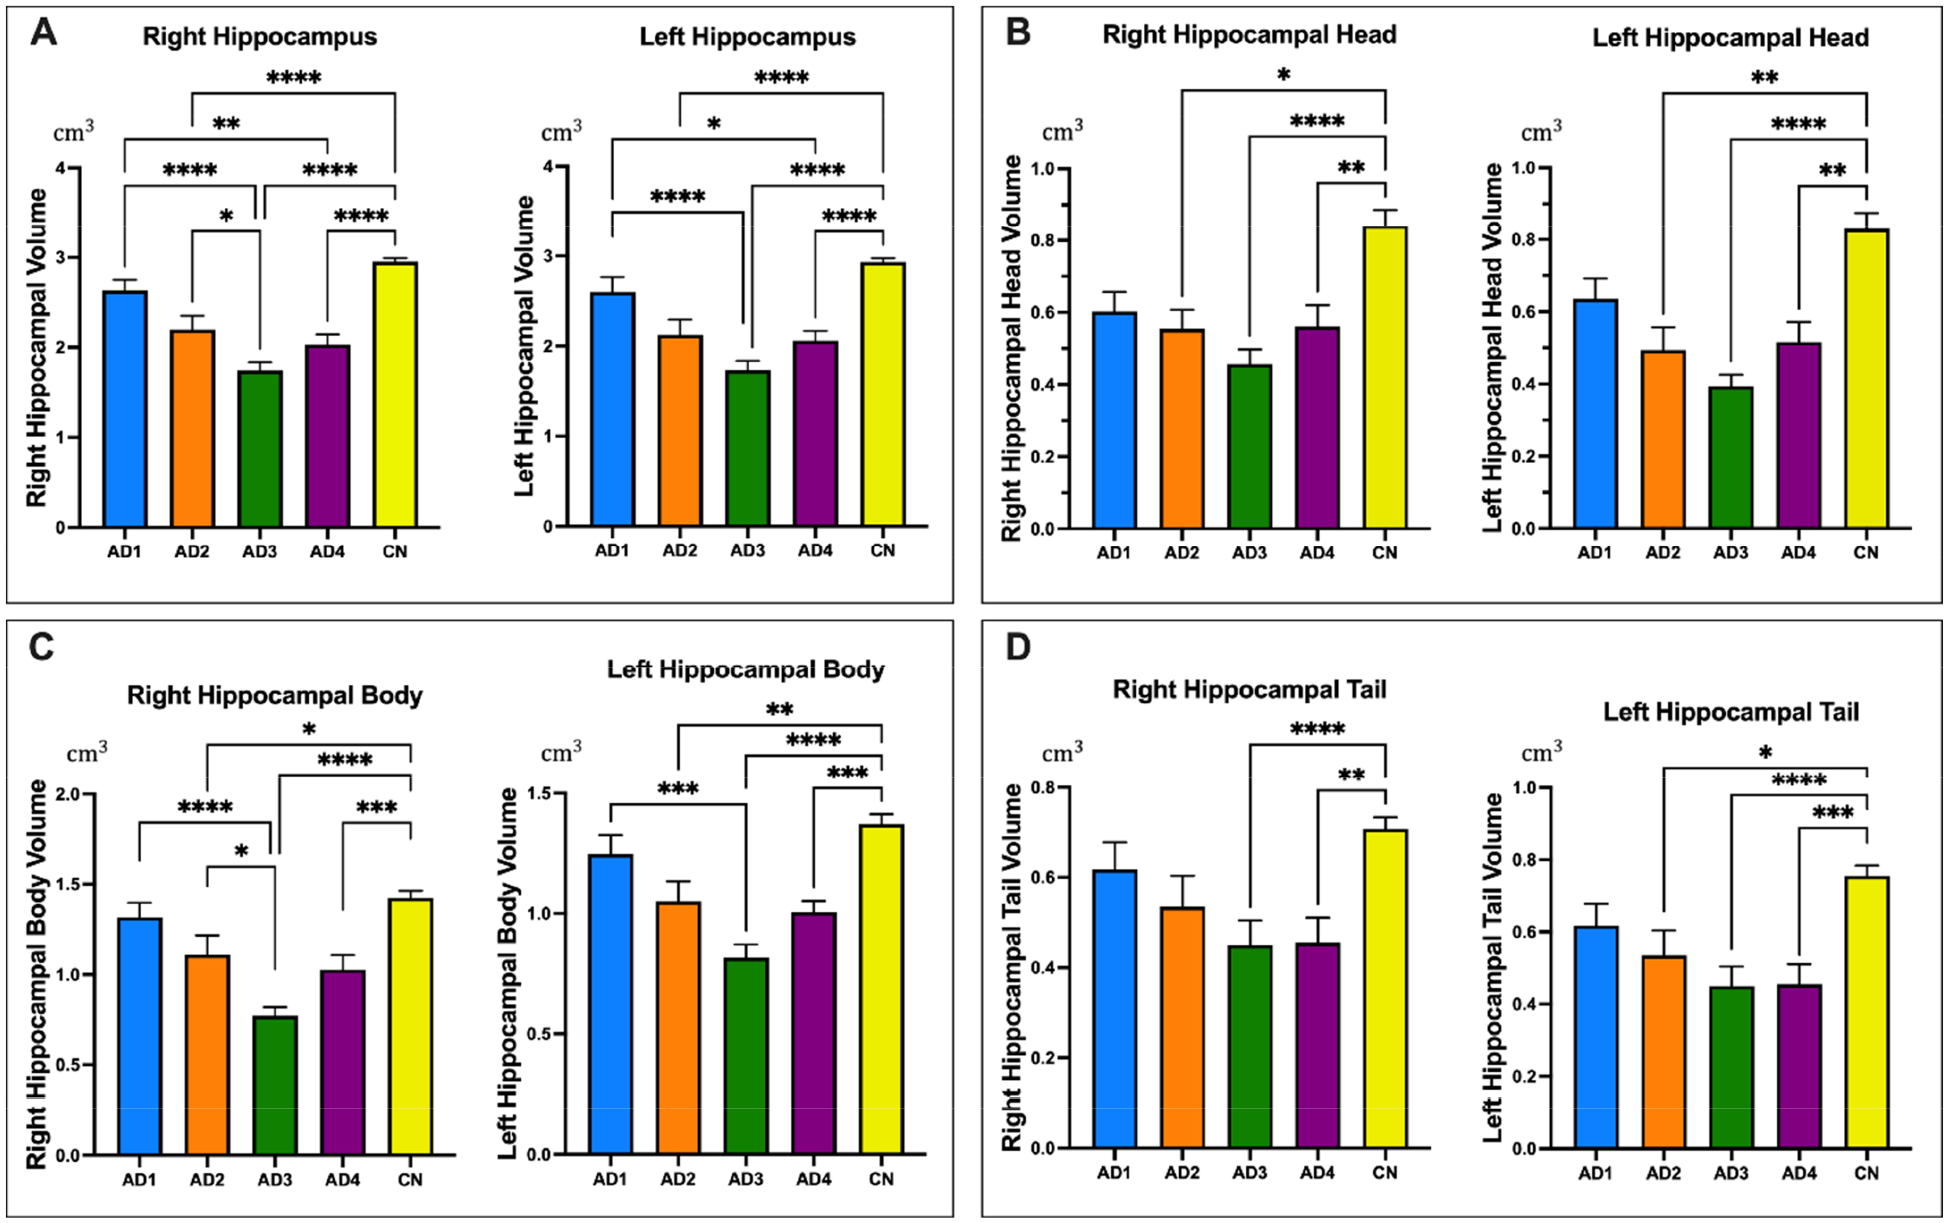
Comparison of the volume (cm3) of each part of the hippocampus according to the patients’ Alzheimer’s disease severity. (A) Right and left whole hippocampal; (B) Right and left hippocampal head; (C) Right and left hippocampal body; (D) Right and left hippocampal tail. AD1, Alzheimer’s disease level 1; AD2, Alzheimer’s disease level 2; AD3, Alzheimer’s disease level 3; AD4, Alzheimer’s disease level 4; CN, Healthy in individuals with normal cognition. The p-value is tested using Analysis of variance (ANOVA) one-way and Tukey post-hoc in Table 4. The results are represented as mean ± SEM. *p-value < 0.05; **p-value < 0.01; ***p-value < 0.001; ****p-value < 0.0001.
Whole and sectional hippocampal volumes of the CN group and AD subgroups
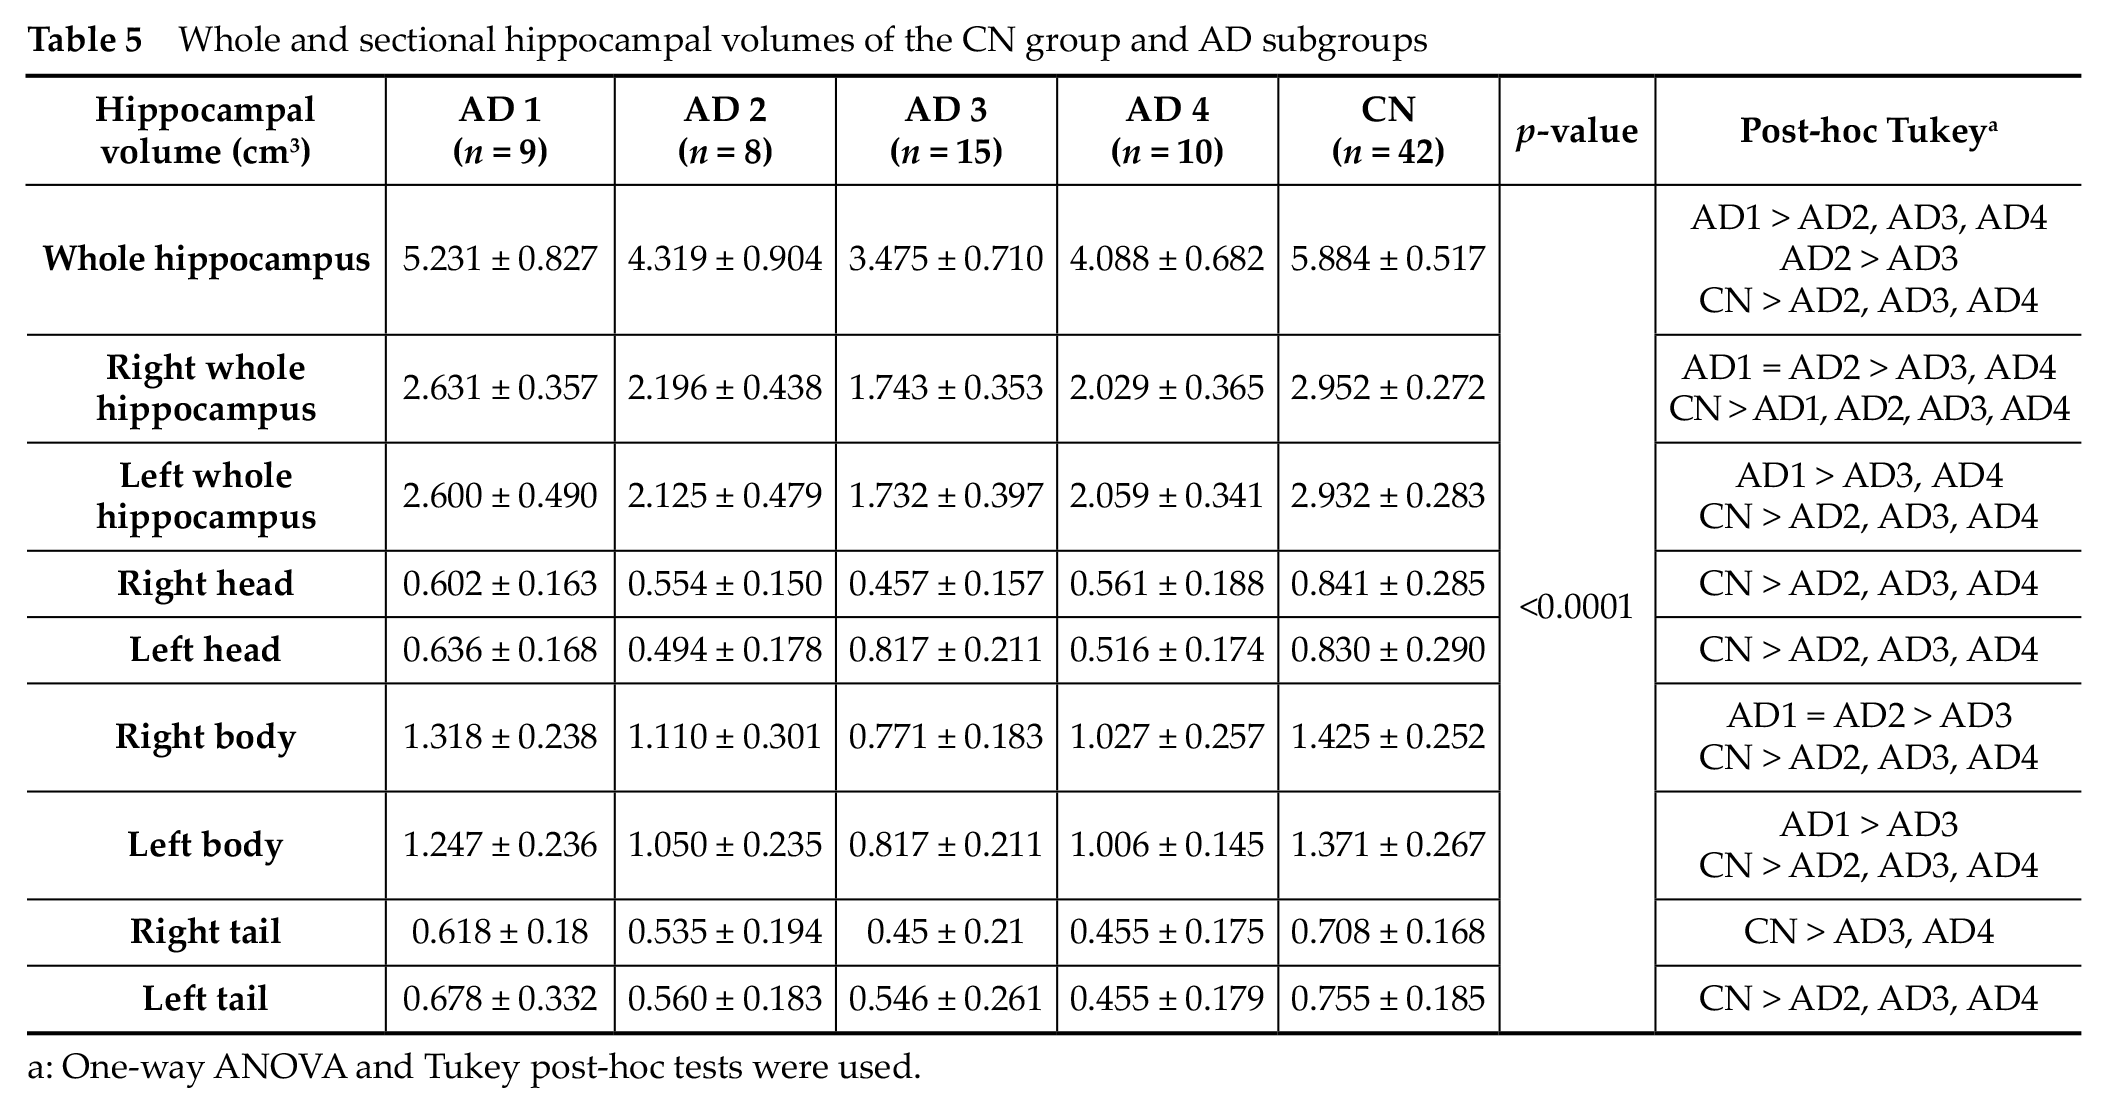
a: One-way ANOVA and Tukey post-hoc tests were used.
Contrarily, comprehensive measurements across the hippocampus, as shown by HarP, revealed significantly different measurements between the CN and AD3 groups and between the CN and AD4 groups. Moreover, as the CN and AD2 groups exhibited a relatively great difference in measurement, except for the right hippocampus tail
3.4 Correlation of the sectional hippocampal volume with the participants’ neuropsychological test scores, age, and sex
When assessing the volume of the left and right hippocampus in relation to the AD severity, a clear trend emerged when using the MMSE scores as the benchmark
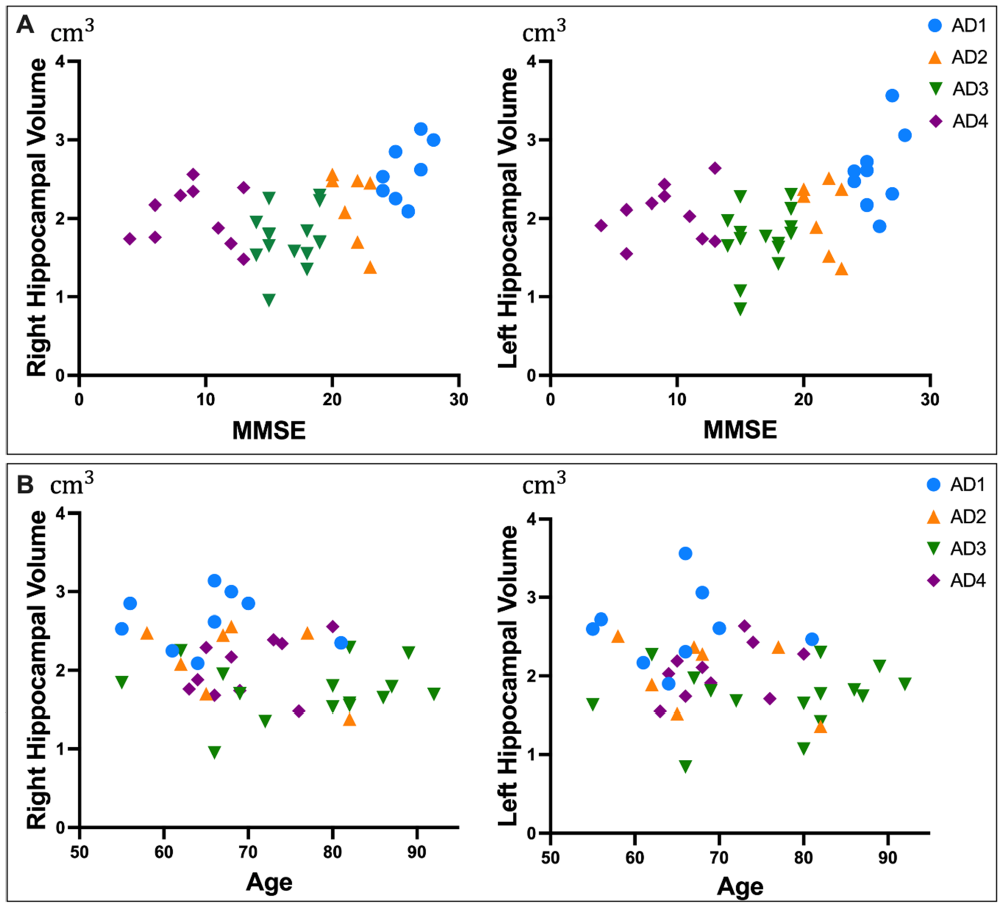
Scatter plot showing the distribution of the data for patients with Alzheimer’s disease stratified according to their disease severity. (A) Relationship between hippocampal volume characteristics and MMSE scores. (B) Relationship between hippocampal volume characteristics and age.
3.5 Association between the hippocampal volume and demographic factors
Table 6 represents the results of the multifactor regression analysis between the hippocampal volume and demographic factors. The findings indicate that the six independent variables, namely sex, age, educational level, BMI, high blood pressure, and diabetes, were not significant predictors of the change in whole hippocampal volume (p < 0.0001). Therefore, these demographic variables did not significant influence the alteration in the whole hippocampal volume.
Results of the multifactor regression analysis between the hippocampal volume and demographic factors
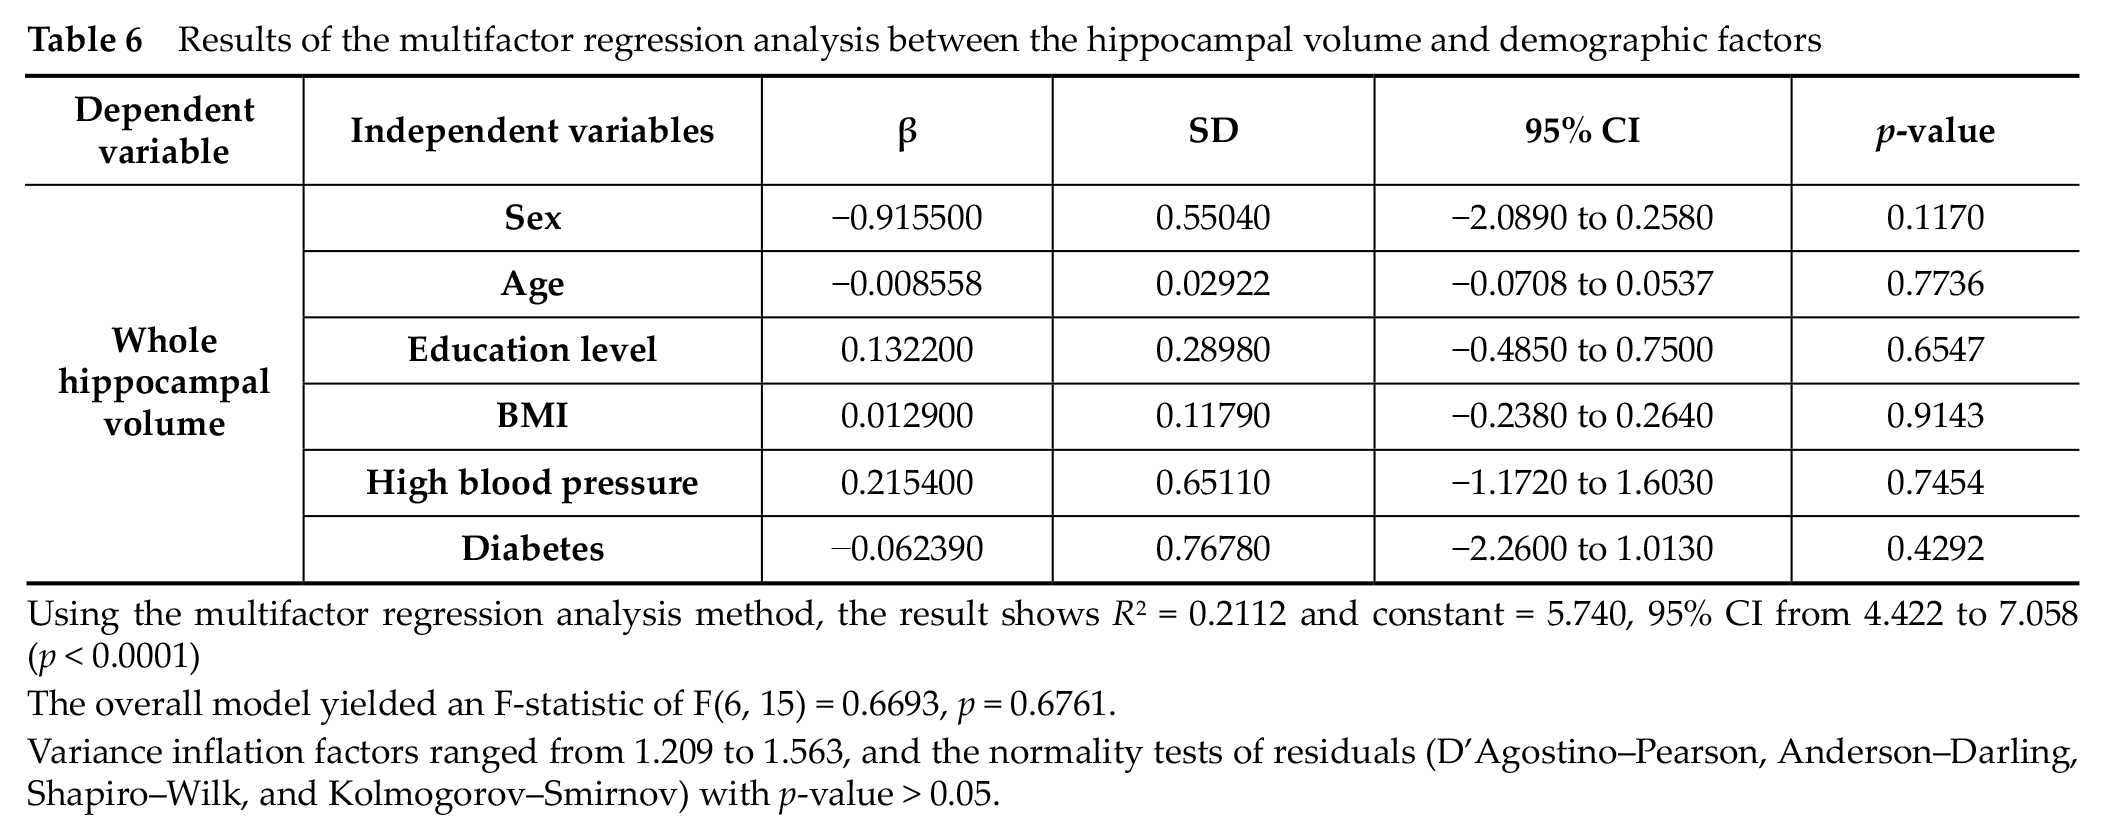
Using the multifactor regression analysis method, the result shows R2 = 0.2112 and constant = 5.740, 95% CI from 4.422 to 7.058 (p < 0.0001)
The overall model yielded an F-statistic of F(6, 15) = 0.6693, p = 0.6761.
Variance inflation factors ranged from 1.209 to 1.563, and the normality tests of residuals (D’Agostino-Pearson, Anderson-Darling, Shapiro-Wilk, and Kolmogorov-Smirnov) with p-value > 0.05.
These results indicate that, while the regression model meets the assumptions of low multicollinearity and normality of residuals, the demographic variables do not significantly predict the changes in hippocampal volume. The low R2 value suggests that only 21.12% of the variance in the whole hippocampal volume is explained by these factors. The non-significant F-statistic further supports the conclusion that these demographic variables, as a group, do not demonstrate a statistically significant impact on the alteration in
the whole hippocampal alteration in our study.
3.6 Correlation of the medial temporal lobe atrophy (MTA) scores with the hippocampal volumes measured by HarP
Figure 4 shows the hippocampal volumes measured using the HarP were stratified according to the (MTA scores, offering a visual representation of the association between hippocampal volumes and varying degrees of atrophy. For the right hippocampus, a significant difference in the total volume was observed across the three MTA score levels. In the head and body regions of the right hippocampus, significant differences emerged solely between the extremities of the MTA scores of 1 and 3. The tail region of the right hippocampus did not exhibit a significant difference between the MTA scores of 1 and 2.
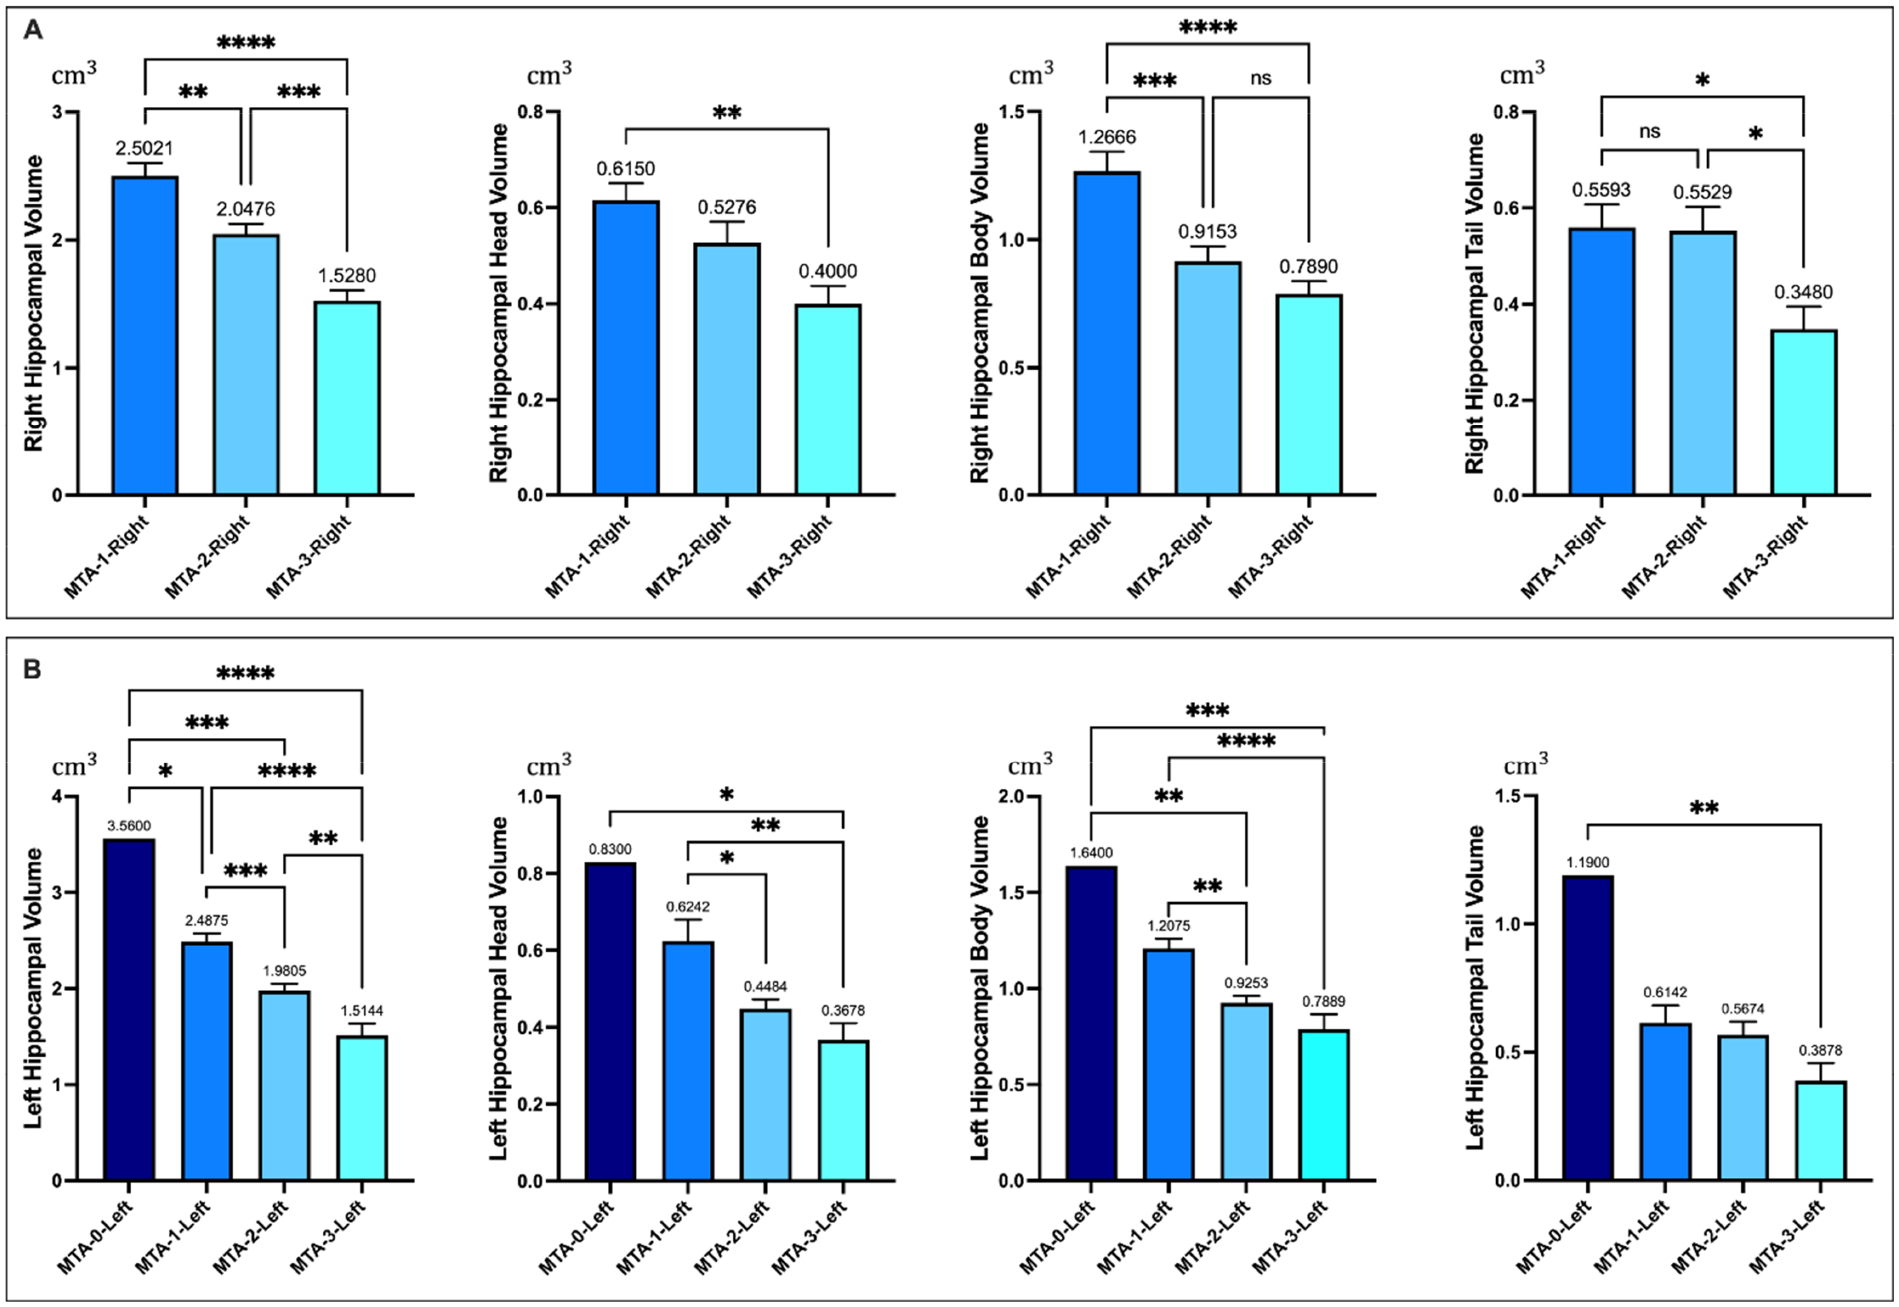
Hippocampal volumes measured by using the harmonized hippocampal protocol (HarP) classified according to the medial temporal lobe atrophy (MTA) score. (A) Whole and Regional (head, body, tail) volumes of right hippocampal; (B) Whole and Regional (head, body, tail) volumes of left hippocampal. *p-value < 0.05; **p-value < 0.01; ***p-value < 0.001; ****p-value < 0.0001.
In the left hippocampus, one participant presented with an MTA score of 0. The analysis showed a significant variance in the total volume across all four MTA score levels for the left hemisphere. However, no significant differences were shown between MTA scores of 2 and 3 for the head and body regions of the left hippocampus. The tail region of the left hippocampus also demonstrated no significant differences across the three MTA scores from 1 to 3.
Figure 5 presents the correlation plots between the hippocampal volumes measured by using the HarP with the MTA scores. The results indicated that there were significant negative relationships between the hippocampal volumes measured by using the HarP and MTA scores. In both hemispheres, the correlation is consistent across the sub-regions, but the strength of the correlation varies, with the whole, head, and body regions showing stronger associations with the MTA scores than the tail regions.
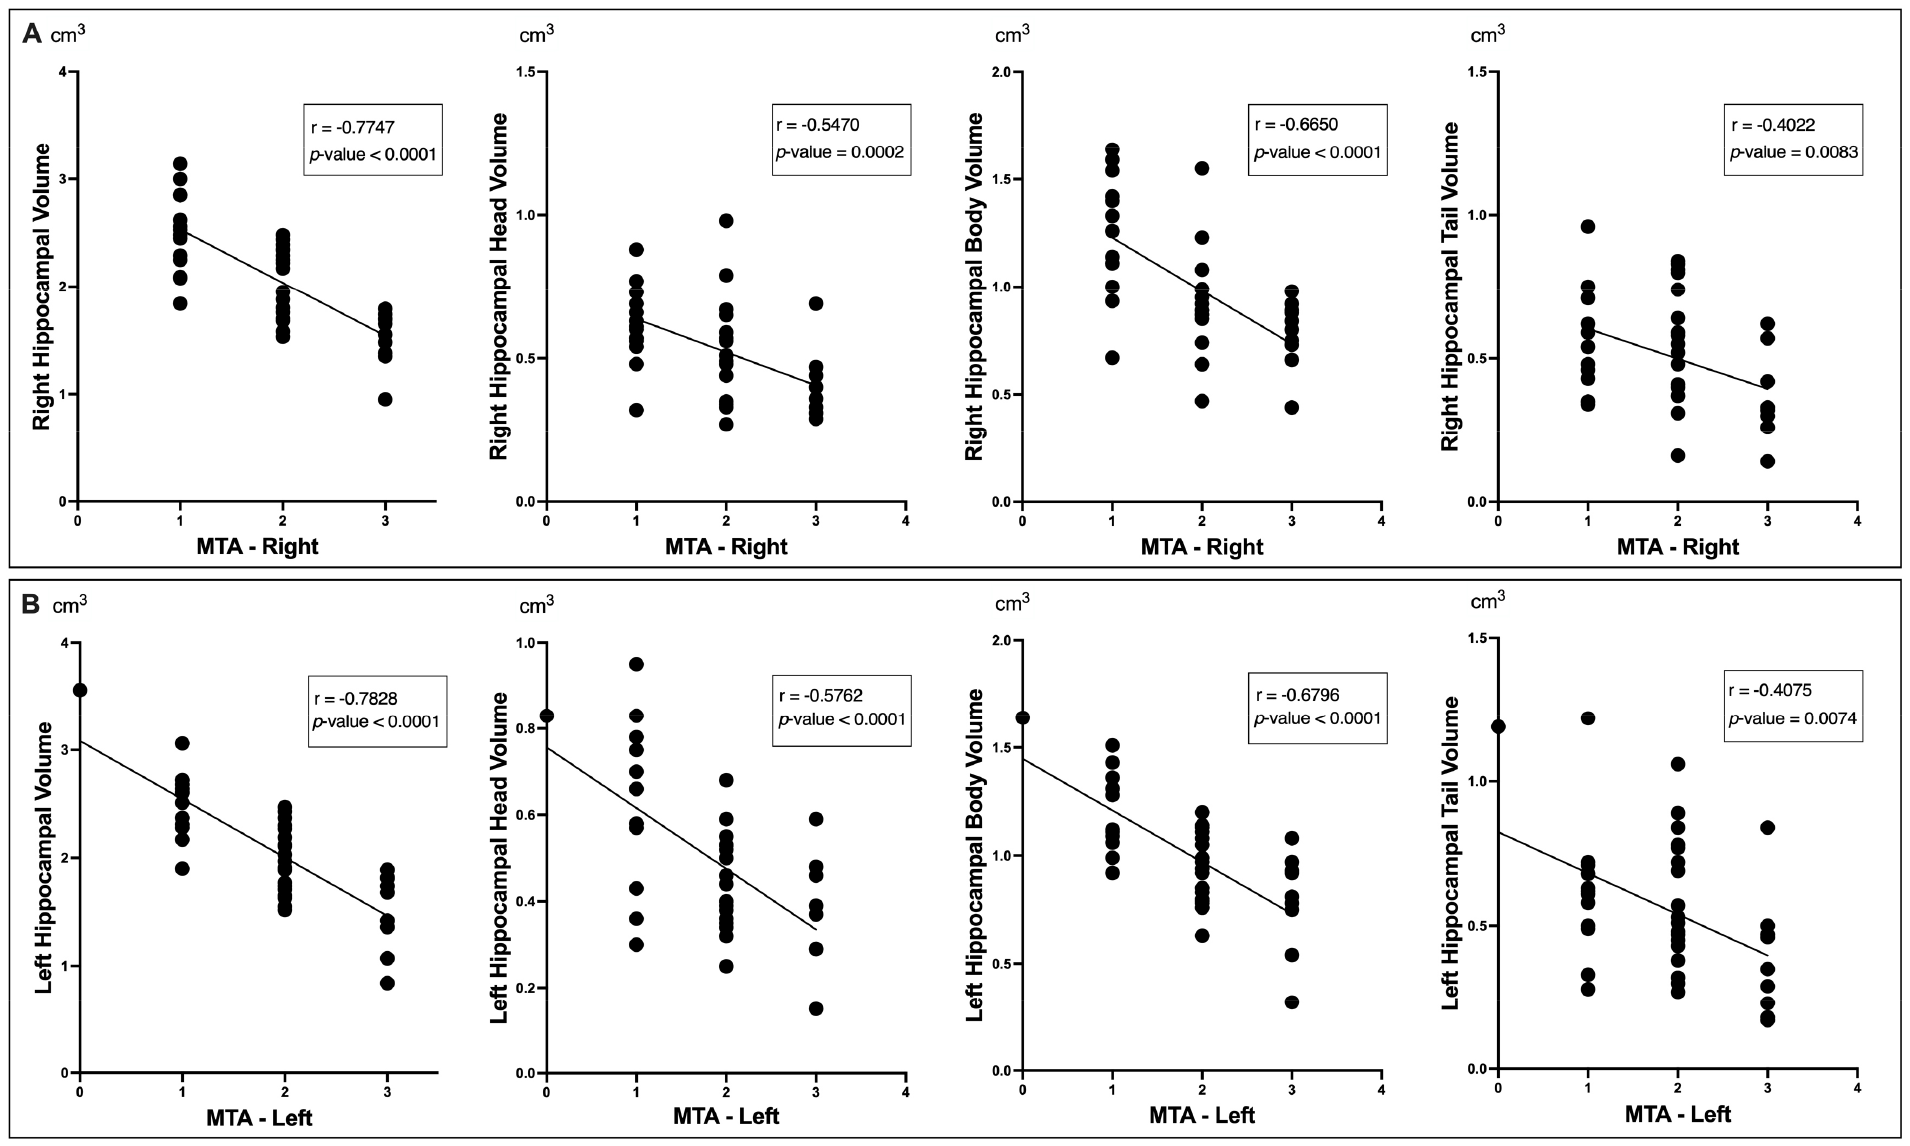
Correlation between the hippocampal volumes measured by using the harmonized hippocampal protocol (HarP) with the medial temporal lobe atrophy (MTA) scores. (A) Correlations with right MTA scores and (B) left MTA scores for volumes of whole hippocampus, hippocampal head, body, and tail.
3.7 Comparison between the manual and automatic segmentations of the hippocampus
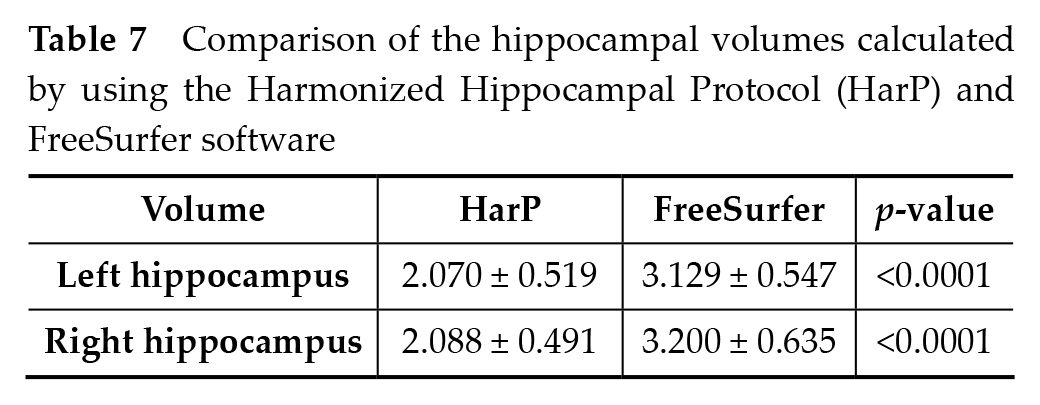
Table 7
shows the comparison of the hippocampal volume measurements obtained using the HarP with those obtained using FreeSurfer software version 7. A significant reduction in the volumes in both the left and right hemispheres was obtained by using the HarP, as compared to that obtained with FreeSurfer (p-value < 0.0001). Complementing these quantitative findings,
Figure 6
shows a paired visual comparison between the two methodologies, illustrating that most hippocampal volumes assessed by using the HarP are considerably lower than those determined by FreeSurfer, corroborating the statistical evidence presented in
Comparison of the hippocampal volumes calculated by using the Harmonized Hippocampal Protocol (HarP) and FreeSurfer software
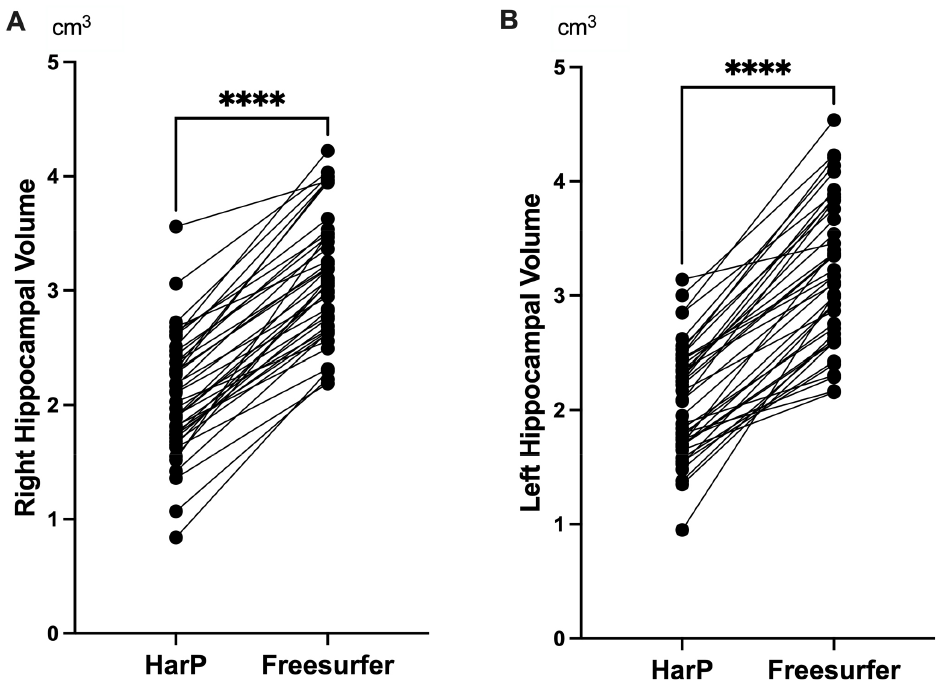
Comparison of the hippocampal volumes calculated by using the Harmonized Hippocampal Protocol (HarP) and FreeSurfer software. (A) Right hippocampal volume; (B) Left hippocampal volume. ****p-value < 0.0001.
4 Discussion
Utilizing the HarP, the present study examined the hippocampal volumes of the AD subgroups stratified by their disease severity (AD1: n = 9; AD2: n = 8; AD3: n = 15; AD4: n = 10) and CN group (n = 42). The bilateral hippocampal volumes showed a significant decline in the AD group as compared to those of the CN group, with progressive reductions observed across the AD subgroups. The sectional analysis showed abnormal nonlinear patterns, with the AD3 subgroup having the lowest volumes, thereby questioning the assumptions of linear deterioration. The hippocampal volume strongly correlated with the cognitive scores (MMSE), confirming its utility as a disease progression marker. The lack of demographic associations emphasizes the disease-specific effects on hippocampal changes. Despite the sample size limitations, the findings demonstrate HarP’s potential for early quantitative detection even in mild AD cases by linking hippocampal atrophy to cognitive changes. Longitudinal assessments in larger cohorts can elucidate the intricate hippocampal atrophy patterns to identify the prognostic capabilities and methods of preserving of functionality in patients with prodromal AD.
4.1 Stability of HarP
The stability of the HarP is underscored by its consistent correlation with the MTA score. Empirical observations indicated a reliable inverse relationship between the volume measurements obtained by using the HarP and MTA scores. This consistency across measures reinforces the reliability and stability of HarP, aligning it with the established MTA score. Moreover, HarP exhibits robustness to data variations. For the MTA score, multiple factors, including the width of the choroid fissure, width of the temporal horn of the lateral ventricle, and height of the hippocampus, are considered; however, despite these considerations, the HarP measurements maintain their consistency with the MTA scores. This robustness to variations further accentuates the stability of HarP, demonstrating its capacity to provide reliable measurements across different conditions and variations. Although the MTA score, which is primarily a scale to distinguish individuals with normal cognition from those with AD, considers numerous factors, it is less quantitative and informative than HarP. Despite this, HarP maintains its stability, offering a more focused and reliable method for hippocampal volumetry.
Interestingly, while segmentation of the entire mesial temporal lobe could provide additional data, our study’s primary aim was to validate the HarP’s effectiveness, specifically for hippocampal measurement, in AD patients and healthy controls. This focused approach directly addresses the HarP’s potential for clinical adoption. Therefore, the HarP not only provides a reliable method for hippocampal volumetry but also distinguishes itself through its remarkable stability and targeted approach to hippocampal assessment.
4.2 Evaluation of automatic segmentation tools on Asian populations
Our study, based on the results presented in
4.3 Comparative analysis of the hippocampal volume across datasets
The HarP exhibits remarkable consistency in measuring the hippocampal volume, not only within the individual datasets but also across different datasets and sample sizes. This consistency is evident when comparing the left and right hippocampal volumes in two distinct studies, with our study obtaining a volume of approximately 2.9 cm3 and another paper [17] reporting a volume of approximately 3.1 cm3
Sectional hippocampal volume in cm3 on various datasets
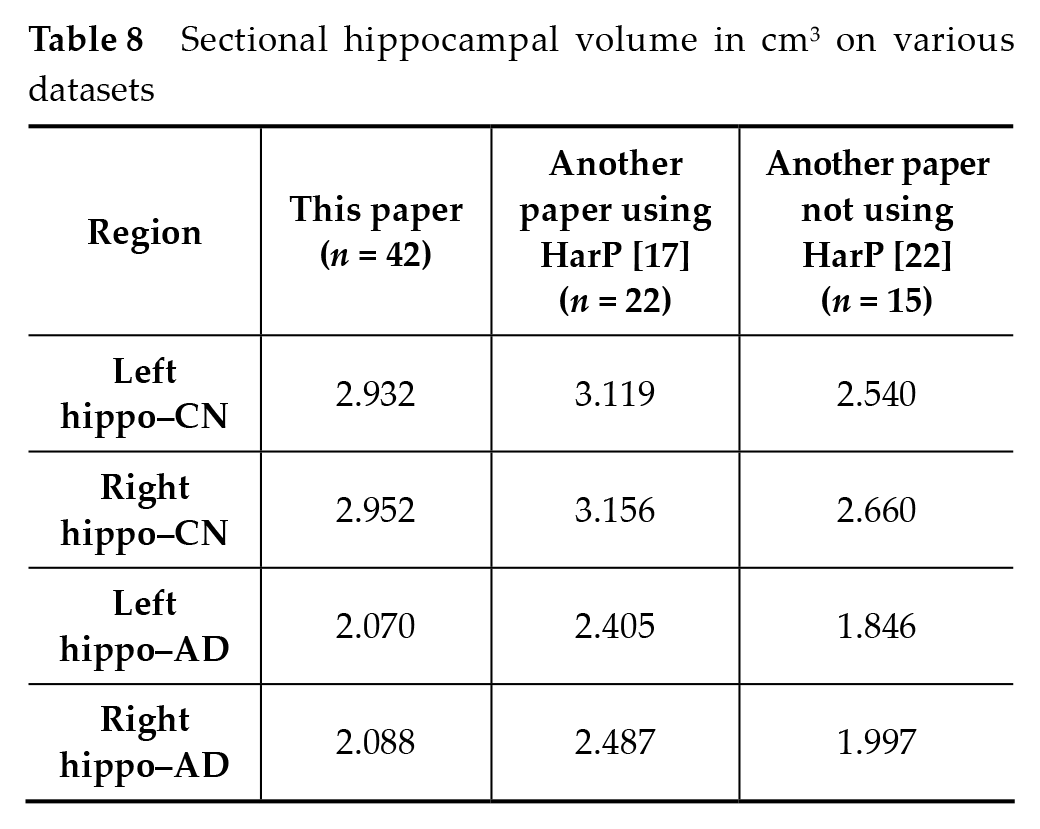
The present study provides a fresh viewpoint on AD evaluation across diverse populations. Our study data highlighted that, even in the CN group, the mean hippocampal volume is approximately 2.9 cm3, which is significantly below the 3.287 cm3 threshold reported in another research to differentiate AD cases from healthy controls [23]. This variation in hippocampal volume thresholds between studies accentuates the variability in population-specific traits and the potential impact of different datasets. It underscores the necessity for region-specific research, rather than solely relying on data from a single, possibly non-representative population. Our study findings also implied that the AD diagnostic criteria may need to be modified based on population-specific attributes. This could have substantial implications for early AD detection and treatment, especially in populations with inherently low average hippocampal volumes, even in those without AD.
4.4 Future work and limitation
The present research has illuminated several intriguing facets of the relationship between hippocampal volume and AD. However, to achieve a comprehensive understanding, subsequent investigations should employ a longitudinal design, as it would allow for a detailed analysis of the hippocampal volume changes among AD patients over an extended period of time. Moreover, augmenting the HarP measurement technique with more sophisticated MRI methodologies can enhance the precision and reliability of our findings. Incorporating machine learning and artificial intelligence tools may also streamline and improve the diagnostic accuracy. Additionally, an expansion of the participant demographic is warranted, as it would facilitate an exploration into the potential genetic or environmental variables that influence the trajectory of AD. Furthermore, a collaborative examination of hippocampal volume in conjunction with other biomarkers could provide a more holistic view of disease progression. As we move toward therapeutic strategies, conducting interventional studies, using hippocampal volume as a primary or a secondary endpoint, is imperative to translate our findings into meaningful clinical interventions.
5 Conclusion
The present study underscores the association between AD and reduced hippocampal volume, highlighting the significance of hippocampal atrophy in the disease’s pathology. The HarP proved effective for measuring hippocampal volume as compared to the manual method. These findings emphasize the potential application of hippocampal volume measurement in the diagnosis and monitoring of AD.
Footnotes
Acknowledgements
None
Funding information
Hai Dac Nguyen, Ha Nguyen, Luan Cong Bui, are funded by internal grant from 30-4 hospital.
Author Contributions
Declaration of conflicting interests
The authors declare no conflict of interest.
Data Availability Statement
Not applicable
Ethical approval
This article is a retrospective study and the study was approved by the Ethics Committee of 30-4 Hospital (CCN.2020.BV304.05) on 14/01/2021.
Informed consent
This article is a retrospective study, therefore informed consent is not applicable.