
Abstract
Parkinson’s disease (PD) is a neurodegenerative disorder characterized by motor retardation, myotonia, quiescent tremor, and postural gait abnormality, as well as nonmotor symptoms such as anxiety and depression. Biofeedback improves motor and nonmotor functions of patients by regulating abnormal electroencephalogram (EEG), electrocardiogram (ECG), photoplethysmography (PPG), electromyography (EMG), respiration (RSP), or other physiological signals. Given that multimodal signals are closely related to PD states, the clinical effect of multimodal biofeedback on patients with PD is worth exploring. Twenty-one patients with PD in Beijing Rehabilitation Hospital were enrolled and divided into three groups: multimodal (EEG, ECG, PPG, and RSP feedback signal), EEG (EEG feedback signal), and sham (random feedback signal), and they received biofeedback training five times in two weeks. The combined clinical scale and multimodal signal analysis results revealed that the EEG group significantly improved motor symptoms and increased Berg balance scale scores by regulating β band activity; the multimodal group significantly improved nonmotor symptoms and reduced Hamilton rating scale for depression scores by improving θ band activity. Our preliminary results revealed that multimodal biofeedback can improve the clinical symptoms of PD, but the regulation effect on motor symptoms is weaker than that of EEG biofeedback.
1 Introduction
Parkinson’s disease (PD) is a chronic neurodegenerative disease characterized by motor dysfunction and clinical symptoms such as delay, tetany, and resting tremor [1]. In addition, PD can cause some common nonmotor symptoms, such as cognitive impairment, anxiety, and depression [2–4], which can significantly affect the quality of life of patients [5].
Many electrophysiological studies have demonstrated that the clinical motor and nonmotor symptoms of patients with PD are closely related to electroencephalography (EEG) signals, electrocardiogram (ECG) signals, and respiratory pulses. Many EEG studies have demonstrated that PD patients generate higher power in θ and γ bands and lower power in β and α bands than healthy controls. [6] The functional connections between different brain regions can change in the θ (4–8 Hz), α (8–12 Hz), and β (13–30 Hz) bands [7]. The α and β bands are closely related to motor symptoms of PD [8] and can be used as potential biomarkers to identify motor retardation and stiffness symptoms [9]. PD patients with depressive symptoms can alter δ and θ bands [10] and increase connectivity of frontoparietal networks [11], which can be used to detect nonmotor symptoms. In addition, θ bands are significantly related to emotion regulation ability in PD patients with depression [12, 13]. Alterations in the cardiac autonomic nervous system can precede the development of motor symptoms. Some studies have demonstrated that patients with PD have autonomic dysfunction, which reduces sympathetic and parasympathetic autonomic activity and heart rate variability (HRV) [14, 15]. A change in HRV is critical for an early diagnosis and risk assessment of patients with PD [16]. Photoplethysmography (PPG) is another technique for the physiological assessment of the heart, which can be used to evaluate the systemic blood circulatory system and has great reference significance for PD evaluation. Respiratory disorder is one of the nonmotor symptoms of patients with PD [17] that primarily manifests as sleep breathing disorder, which reveals the presence of other pneumo-functional comorbidities [18] and is related to peripheral autonomic nervous system abnormalities [16]. Changes in multimodal signals are closely related to motor and nonmotor symptoms of PD.
Biofeedback, a noninvasive treatment, can significantly improve motor and nonmotor symptoms in patients with PD [19–21] and can improve balance and avoid falls [22–24]; in addition, biofeedback based on electromyography (EMG) can promote the rehabilitation of gait function in patients with PD [25]. Thompson et al. proposed various biofeedback training methods combining EEG and respiration (RSP) characteristics [26], which have significant effects on dystonia in patients with PD and effectively controlled frozen gait. Richter et al. found that motor symptoms were significantly improved in the EEG and multimodal groups (including HRV and RSP) compared with those in the sham group [27]. In addition, biofeedback improves movement disorders in older patients with PD [21]. Biofeedback based on auditory and somatosensory feedback can effectively improve frozen gait symptoms in patients with PD [28]. In the past, most biofeedback techniques only provided feedback on one or two types of signals; thus, it is important to explore biofeedback technology that combines multiple modal information in the future. Neurofeedback, a type of biofeedback, is primarily used for treating PD to regulate the activity of the brain [29]. Some studies have demonstrated that neurofeedback can autonomically regulate β band power [30] to improve motor symptoms. Functional connectivity of the insula-dorsomedial frontal cortex circuit can be improved in patients with PD using functional magnetic resonance imaging and neurofeedback-guided kinesthetic motor imagery [31]. However, biofeedback based on multimodal signals has not been evaluated for clinical improvement in motor and nonmotor symptoms in patients with PD.
In this study, a biofeedback scheme based on multimodal physiological signals was designed to explore the response mechanism of multimodal physiological signals in patients with PD. We adopted a single-blind control design by dividing patients with PD into three groups: sham, EEG, and multimodal. The EEG, ECG, PPG, and RSP signals of each group were recorded before and after biofeedback training, and their clinical symptoms were evaluated. We hypothesized that the EEG group would be better at improving motor function, and the multimodal group could show significant improvements in nonmotor function.
2 Materials and methods
2.1 Participants
The dataset included a sample of 21 patients with PD from Beijing Rehabilitation Hospital, which jointly recruited early-stage patients with PD (Hoehn-Yahr Stage II-III) to validate the major findings. Inclusion criteria were as follows: (1) diagnosis of PD; (2) stable vital signs, no serious cardiopulmonary disease or osteoarthrosis; and (3) medication that was stable and would not be adjusted in the short term. Exclusion criteria were as follows: (1) patients with fractures, (2) patients with mental illnesses, (3) patients with cognitive impairment, and (4) patients with impaired vision and hearing that impeded rehabilitation treatment. Patients in this dataset had Hoehn and Yahr stage II or lower and were treated for PD. All individual participants in the study provided informed consent. The study meets the requirements of the Declaration of Helsinki as amended in 2013.
2.2 Trial design and treatment
We adopted a single-blind controlled experimental design and divided all patients with PD into three groups: sham, EEG, and multimodal. Three groups of participants underwent two-week biofeedback training consisting of five sessions in the hospital. All participants underwent clinical assessment and multimodal signal acquisition before and after training. The study was approved by the Ethics Committee of Beijing Rehabilitation Hospital, Capital Medical University (2020bkky010), and all patients with PD signed an informed consent form before inclusion following the Declaration of Helsinki.
2.3 Clinical assessment
All patients were tested for motor and nonmotor symptoms before and after treatment using various scales. Motor symptoms scales included the unified Parkinson’s disease rating scale (UPDRS) II, UPDRS III, Berg balance scale (BBS), and time up & go scale (TUG). Nonmotor symptom scales included the UPDRS I, UPDRS IV, Hamilton rating scale for depression (HRSD), Hamilton anxiety scale (HAMA), and mini-mental state examination scale (MMSE) [32–37].
2.4 Biofeedback protocol
Each biofeedback training session contained four blocks: two motors and nonmotor blocks. There was a 120-s resting period before and after treatment. Movement imagination was used to treat motor symptoms, and respiratory training was used to treat nonmotor symptoms. In the motor block, the patients must focus on the screen for 20 s to image movement with a picture and then rest for 10 s (Fig. 1(A)). Four types of graphic interchange format (GIF) images were used to demonstrate the motion, and one type of GIF was displayed in each trial. Each motor block had 16 trials in which patients were asked to imagine movement. In the nonmotor block, the patients must listen to instructions to regulate respiration (Fig. 1(B)). Each block had two trials; each trial lasted for 120 s to regulate respiration (Fig. 1(C)).
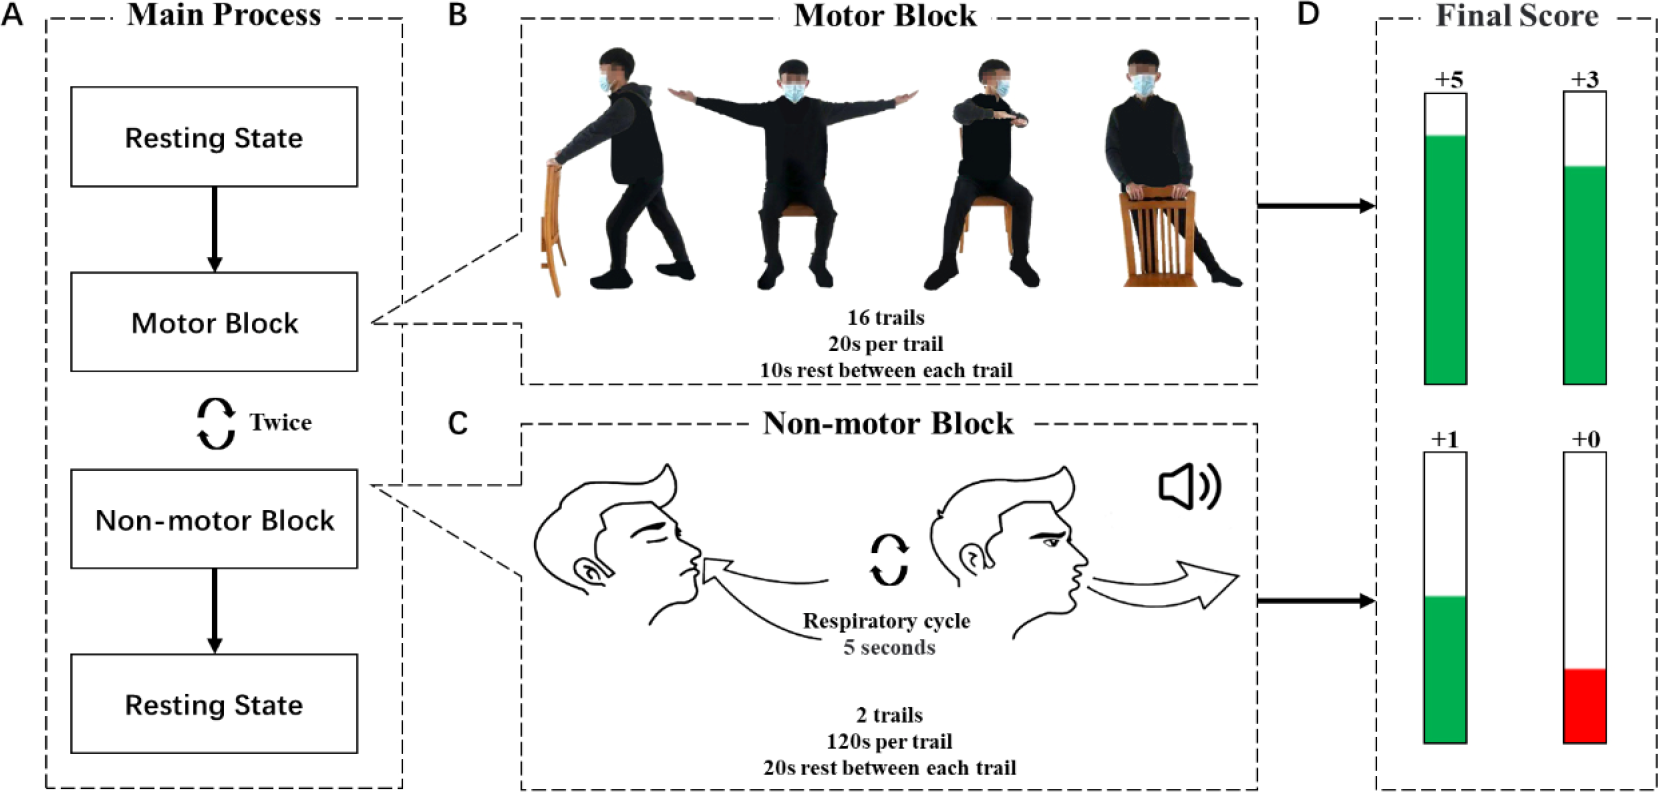
Flowchart of biofeedback training protocol. (A) The main process of biofeedback training. Motor and nonmotor blocks were executed twice each. (B) Motor block: movement imagination experiment in which one GIF was played in each trial. (C) Nonmotor block: The respiratory training experiment followed verbal instructions to regulate the breathing rhythm. (D) Real-time biofeedback score displayed at different levels.
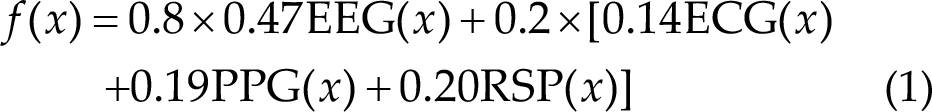
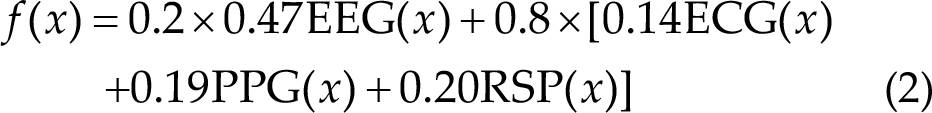
All patients’ multimodal signals were recorded and patients underwent biofeedback training using Brain MultiPuls [38]. The biofeedback score of the EEG signal was the sensory motor rhythm (SMR) mean frequency power of the C3 and C4 positions. The biofeedback score of the ECG and PPG signals was the R wave (upward waves in ECG and PPG signals) interval. The biofeedback score of the RSP signal was the interval time (the interval between troughs of respiratory signals). Before the real biofeedback training, resting-state data were collected as the individual baseline threshold. The score was updated when the new biofeedback score was calculated per 4 s. The biofeedback score was presented as a visual bar with a height proportional to the score. A green bar appeared when the real-time biofeedback score was greater than the baseline threshold; otherwise, a red bar appeared. Specifically, when the real-time biofeedback score exceeded the threshold score of 66%, the final score increased by 5 points. However, more than 33% added 3 points and more than 0% added 1 point. Subjects were encouraged to obtain higher final scores 4 s before the last point update during the biofeedback experiment (Fig. 1(D)). The sham group score was a random number. The EEG group score was the mean frequency power in the SMR band. In addition, the multimodal biofeedback score formula differed from the motor and nonmotor blocks, and the main difference was reflected in the coefficient of the formula. For the score calculation of the motor module, see Eq. (1). Equation (2) of the biofeedback score was used for the nonmotor block. f(x) is the total biofeedback score. EEG(x), ECG(x), PPG(x), and RSP(x) are the real-time biofeedback scores. Biofeedback therapy using SMR and ECG and RSP as feedback signals can effectively improve the motor symptoms of PD [26–27, 39], while ECG, PPG, and RSP signals can improve nonmotor symptoms such as cognition and depression [40–42]. The weight parameters of EEG, ECG, PPG, and RSP signals were obtained from the research of Guo et al. [43].
2.5 Multimodal signal preprocessing
2.5.1 EEG signals
EEGLAB was used to analyze the EEG signals (https://sccn.ucsd.edu/eeglab/index.php). The raw EEG signal was subjected to 0.5 Hz high-pass and 45 Hz low-pass finite impulse response (FIR) filters. Then, for all channels, dereferencing was performed using FP9 and FP10. Finally, independent component analysis was used to delete the artifacts (eye movements and EMG signal, and eye blinks) of the EEG signals.
2.5.2 ECG and PPG signals
EEGLAB was used to analyze the ECG and PPG signals. The ECG and PPG signals were filtered using an FIR bandpass filter ranging from 0.1 to 40 Hz. Then, the peak points for every 4 s of data were determined using the dynamic difference threshold method [44], as shown in Eq. (3). y(n) is the differential signal, and x(n) is the filtered signal. The t was 40 ms. Finally, the R wave interval was calculated for each of the two adjacent peak points.

2.5.3 RSP signals
EEGLAB was used to analyze the RSP signals. The RSP signals were filtered using an FIR bandpass filter ranging from 0.01 to 10. Then, the peak points for 1 min of data were determined. Finally, the time interval between two adjacent peak points was calculated.
2.6 EEG time-frequency analysis
The frequency power was calculated using discrete Fourier transform (DFT) on pre- and post-treatment resting-state data. The DFT value was calculated using the average of the sliding window as shown in Eq. (4), where N is the total number of sampling points in the time domain, n is the sequence number of the time domain, and k is the sequence number of the frequency domain. The length of the window was 1000 sampling points and the step was 10 sampling points. Finally, Eq. (5) was used to obtain the different frequency spectrum energy ratios (FRs) before and after the treatment block using the result for the entire channel average from the previous step. In Eq. (5), x is the frequency power, and n and m are the ranges for each frequency band. In addition, the relative frequency power ratio was calculated by subtracting the 5th day post-FR from the 1st day pre-FR in the same frequency band. The frequency energy bands were classified into the following six ranges: δ (0.5–4 Hz), θ (4–7 Hz), α (8–12 Hz), β (13–30 Hz), γ (31–45 Hz), and SMR (12–15 Hz).


2.7 EEG phase lag index analysis
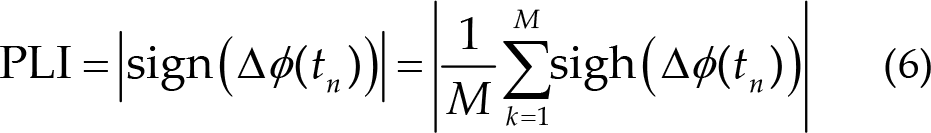
The phase lag index (PLI) [45] was used to analyze phase synchrony in different brain regions, which addressed the volume conduction effect to minimize the common source. First, the Hilbert transform was used to convert the EEG signal to a frequency domain signal. Then, the instantaneous phase difference Δϕ (tn ) between two electrodes was calculated to build the PLI matrix (see Eq. (6)). Currently, there is no unified standard for the selection of threshold values, and the selected threshold value must maintain the functional integrity and small-world nature of the brain network. Therefore, we chose a threshold value of making the average degree greater than the logarithm of the number of electrodes and the network density less than 50% [46]. Finally, a network sparsity range of 20%–45% was determined, and different brain networks were constructed with 5% step sizes.
The changes in the global topological properties of the brain network were analyzed. A sparsity of 0.35 in the δ band, 0.25 in the θ band, and 0.35 in the β band was used to ensure the integrity of the brain functional network and the maximum difference between groups in the properties of the small-world network. The GRETNA toolbox (https://github.com/sandywang/GRETNA) was used to analyze efficiency local (Eloc), clustering coefficient (Cp), efficiency global (Eglo), σ, γ, and λ.
2.8 ECG and PPG time domain analysis
The time interval between two nearly peak points, which is the RR period for the ECG and PPG signals, was calculated. Furthermore, we used the period to obtain the percentage of NN50 in the total number of R wave to R wave intervals (pNN50) in Eq. (7), the mean of R wave to R wave (RR) in Eq. (8), the SD of NN intervals (SDNN) in Eq. (9), and root mean square of the difference between adjacent NN intervals (RMSSD) in formula (10) for ECG signals. We also calculated the mean of RR in Eq. (8), SDNN in Eq. (9), RMSSD in Eq. (10), and the rate of PPG in Eq. (11). Finally, to calculate the difference between post- and pre-treatment blocks, the 5th day results were subtracted from the 1st day results to obtain the final results.


2.9 RSP time domain analysis
The period between two nearly peak points, which is the interval for the RSP, was calculated. Furthermore, the interval was used to obtain the mean of the interval in Eq. (12), the standard of the interval in Eq. (13), and the rate in Eq. (14). Finally, to calculate the difference between post- and pre-treatment blocks, the 5th day results were subtracted from the 1st day results to obtain the final results.


2.10 Statistical analysis
SPSS version 26.0 was used for statistical analyses. First, all the data were tested for normal distribution using the Shapiro–Wilk test. Then, among the three groups, a one-way analysis of variance (ANOVA) was performed for data with a normal distribution, and the Kruskal–Wallis test was performed for data with a non-normal distribution. For the results of the time-frequency of EEG, ECG, PPG, and RSP, statistical analysis was used to assess the difference between post- treatment on the 5th day and pre-treatment on the 1st day among the three groups. In the EEG PLI results, the differences between the mean of pre- and post-treatment for five days were analyzed using the same statistical analysis among the three groups. The least significant difference (LSD) method was used to correct all the post-hoc tests of these characteristics because the characteristics with significant differences among the three groups followed a normal distribution. Finally, the correlations between scale scores and network metrics were analyzed. The Pearson correlation test was used for data with a normal distribution, while the Spearman correlation test was used for data with a non-normal distribution.
3 Results
3.1 Clinical characteristics
The 21 patients with PD were equally assigned to one of the three groups: sham (2 males and 5 females, mean age ± SD 63.00 ± 5.66 years), EEG (2 males and 5 females, mean age ± SD 59.86 ± 8.44 years), and multimodal (1 male and 6 females, mean age ± SD 62.29 ± 3.06 years), with no significant difference in demographic characteristics among the three groups. The comparison of the baseline pre-admission scale scores among the three groups is shown in Supplemental Table 1. Only the MMSE score had a significant difference (h = 8.25, p = 0.02), and that of the sham group was significantly higher than that of the multimodal group (p = 0.01), so the results of the MMSE scale were excluded in subsequent analysis. The means and SD for clinical characteristics are summarized in Table 1. After treatment, the HRSD of the multimodal group decreased significantly (z = −2.02, p = 0.04), the BBS of the EEG group increased significantly (z = −2.21, p = 0.03), and the TUG scale score (t(6) = 3.55, p = 0.01, d = 1.34, 95% CI [0.27, 1.45]) decreased significantly (Fig. 2).
Comparison of differences in nine scales between pre- and post-treatment.
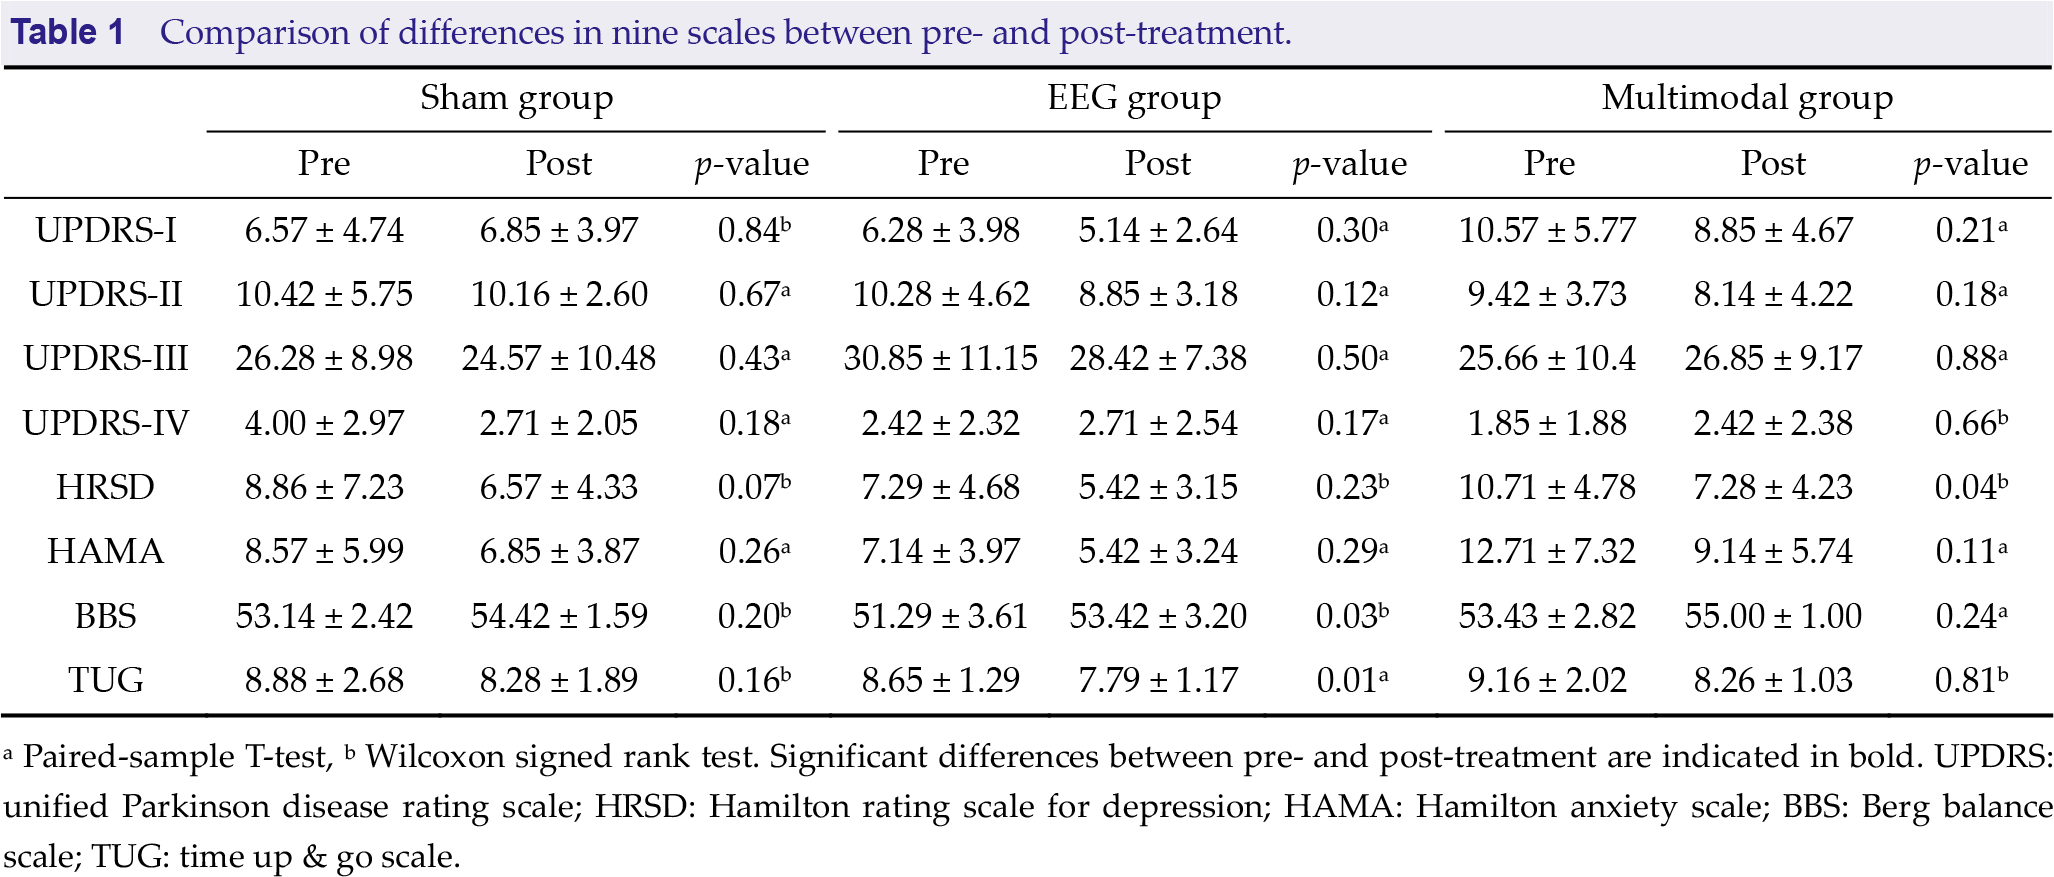
a Paired-sample T-test, b Wilcoxon signed rank test. Significant differences between pre- and post-treatment are indicated in bold. UPDRS: unified Parkinson disease rating scale; HRSD: Hamilton rating scale for depression; HAMA: Hamilton anxiety scale; BBS: Berg balance scale; TUG: time up & go scale.
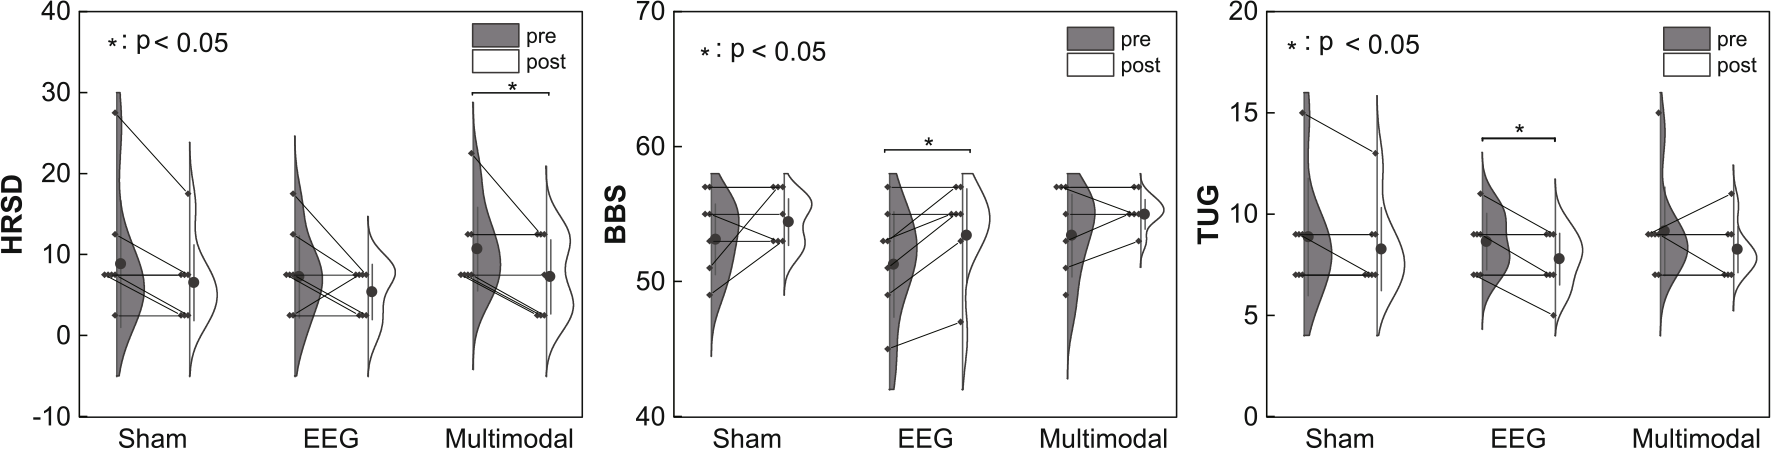
Differences in the scales between pretreatment and post-treatment in the three groups.
3.2 Time-frequency domain of EEG
Fig. 3(A) shows that the power of each frequency band of the EEG and multimodal groups were enhanced after treatment. According to the Shapiro-Wilk test, the EEG data of the three groups were consistent with a normal distribution.
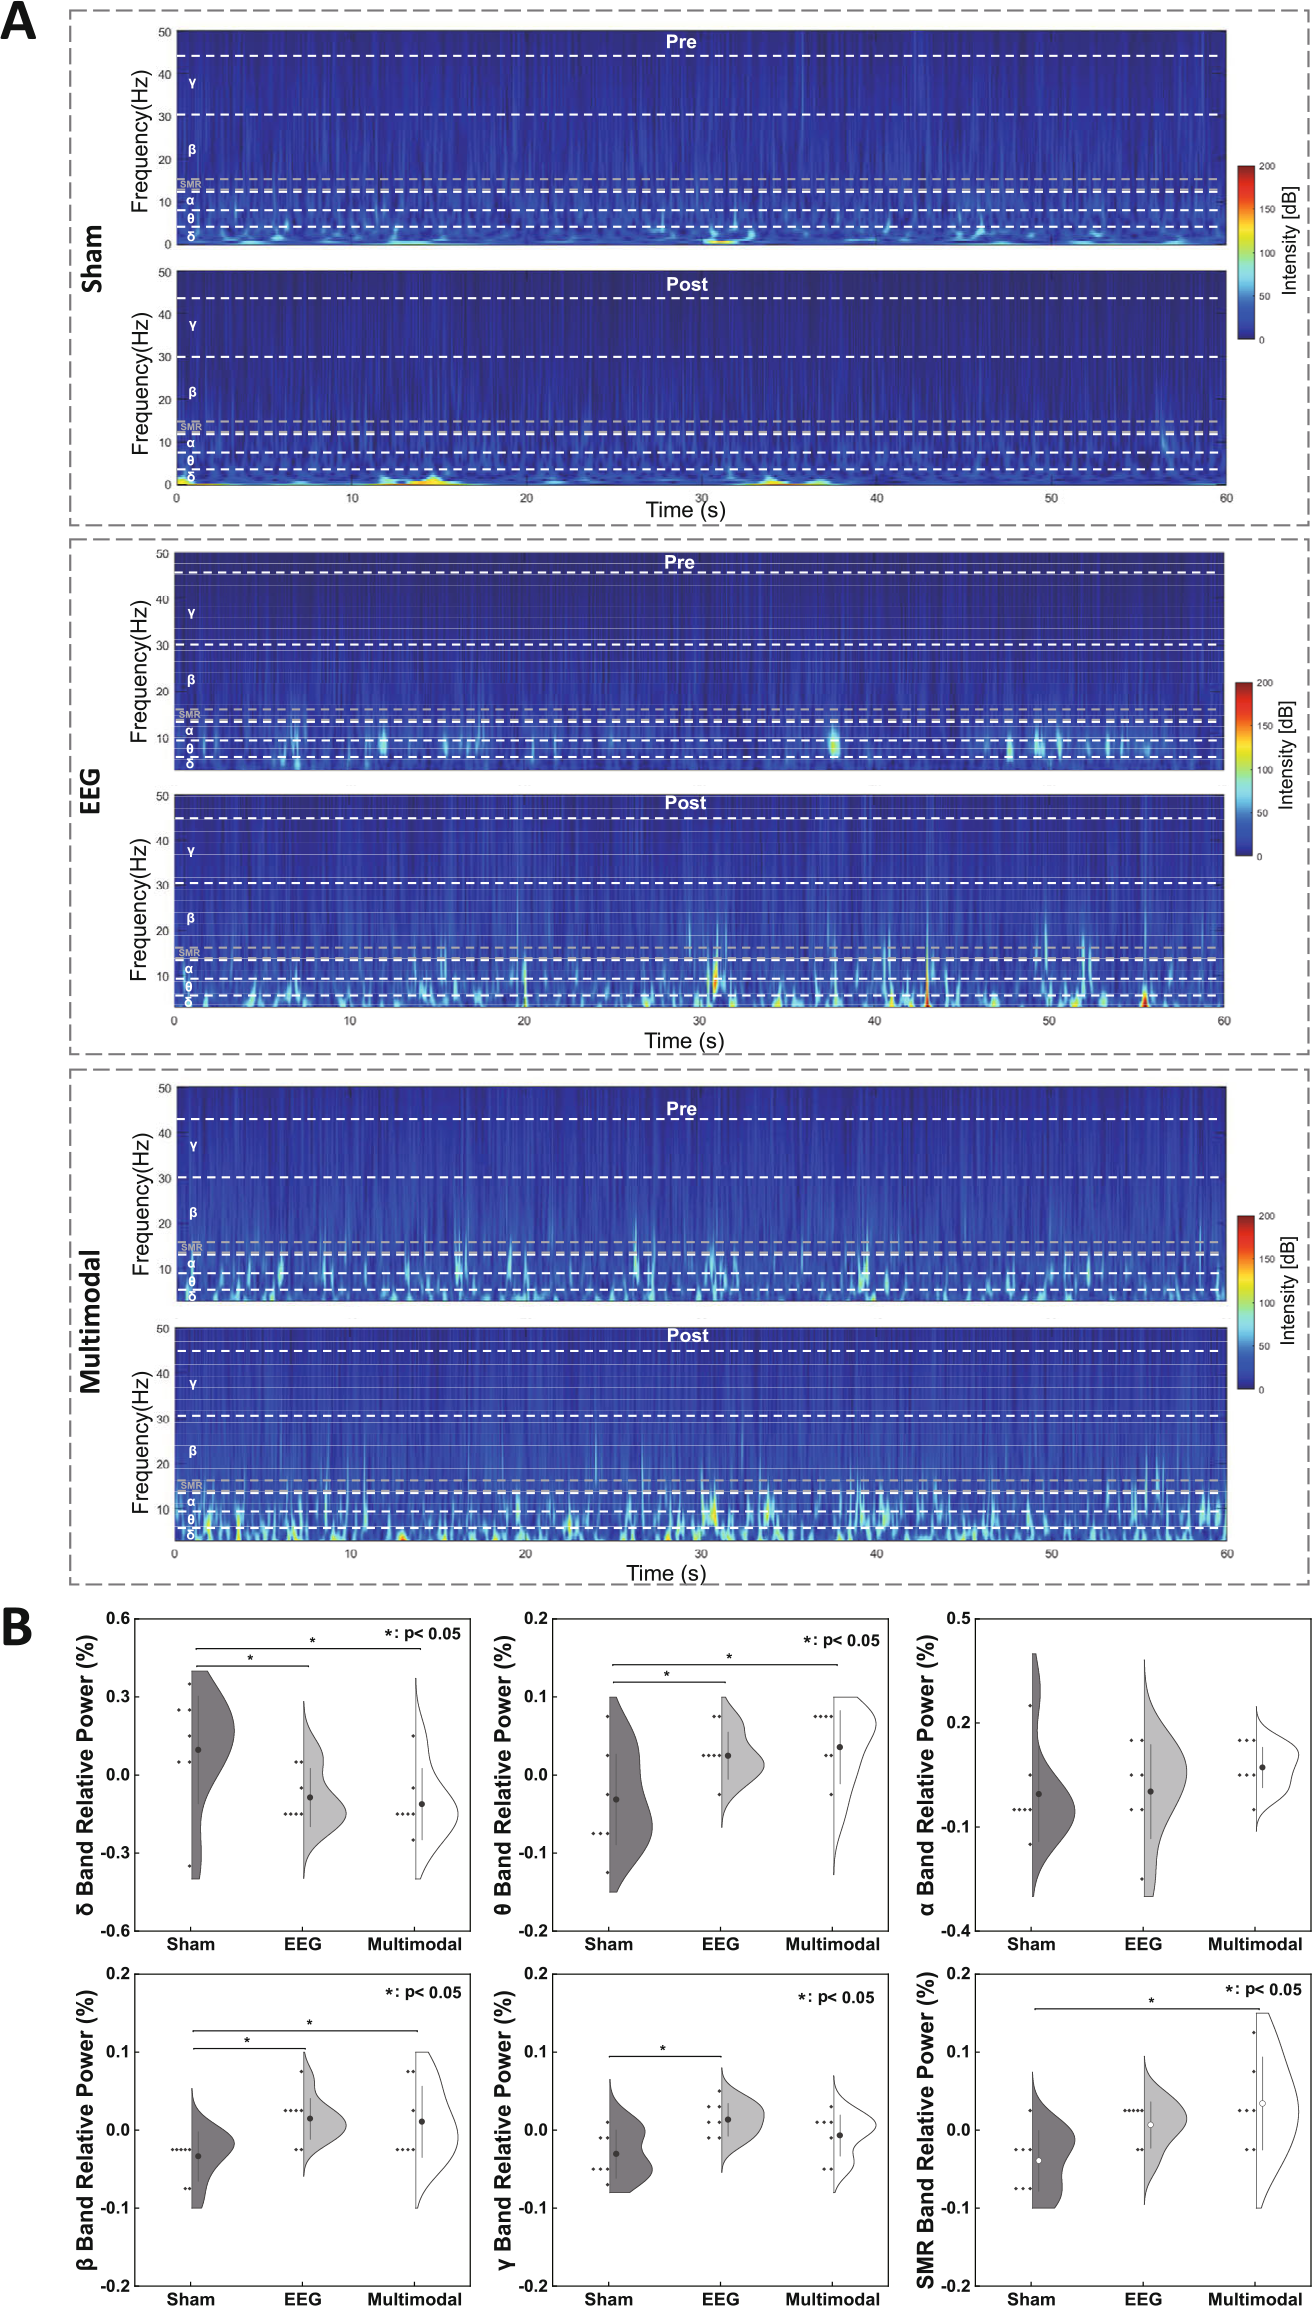
Frequency domain for EEG signals. (A) Time-frequency plots of pre- and post-treatment in the three groups. (B) Violin plots of the relative power difference between the difference values of the 5th day and 1st day of the sham, EEG, and multimodal groups at different frequency bands (* p < 0.05, corrected by LSD).
From one-way ANOVA, the relative power in different frequency bands was significantly different among the three groups: δ band (F(2, 14) = 3.64, p = 0.05, r = 0.54); θ band (F(2, 15) = 4.17, p = 0.03, r = 0.56); β band (F(2, 15) = 3.99, p = 0.04, r = 0.55); γ band (F(2, 16) = 4.80, p = 0.02, r = 0.59); and SMR band (F(2, 14) = 4.83, p = 0.02, r = 0.59). A post-hoc test was performed for frequency bands with significant differences, and LSD correction was performed for p-values. The relative power of the sham group was lower in the θ band than that of the EEG group (t(18) = 2.35, p = 0.04, d = 1.25) and the multimodal group (t(18) = 2.80, p = 0.01, d = 1.49). The relative power of the sham group was significantly lower in the β band than that of the EEG group (t(18) = 2.86, p = 0.02, d = 1.53) and the multimodal group (t(18) = 2.62, p = 0.03, d = 1.40; Fig. 3(B)).
3.3 Brain network connectivity of EEG data
Considering that the differences in EEG spectral analysis are primarily reflected in the δ, θ, and β bands, the PLI results of these three bands were further analyzed (Fig. 3). According to the Shapiro–Wilk test, except for Eloc and Eglo in δ band, gamma, lambda, and sigma in θ band, and gamma, sigma, and Eglo in β band, all other characteristics conform to normal distribution. On-way ANOVA was used for normally distributed data, and Kruskal–Wallis’s test was used for non-normally distributed data.
Eloc (F(2, 15) = 4.50, p = 0.03, r = 0.33) and clustering coefficient (Cp) (F(2, 15) = 3.68, p = 0.05, r = 0.29) were significantly different among the three groups in the θ band. The Eloc value of the multimodal group was significantly lower than that of the sham group (t(18) = 2.48, p = 0.03, d = 1.29), and EEG group (t(18) = 2.82, p = 0.01, d = 1.47). Eloc (F(2,15) = 6.91, p = 0.01, r = 0.43) and Cp (F(2, 16) = 3.94, p = 0.04, r = 0.30) were significantly different among the three groups in the β band. The Eloc value of the EEG group was significantly higher than that of the sham (t(18) = 0.99, p = 0.02, d = 1.43) and multimodal groups (t(18) = 1.31, p = 0.00, d = 1.91). LSD correction was used for the p-values of all post-hoc tests above. In addition, there was no significant difference in the PLI features of the three types of frequency bands (p > 0.05).
3.4 ECG, PPG, and RSP parameters
Table 2 shows the statistical results of the ECG, PPG, and RSP features in the three groups. The ECG results showed that the mean RR differed significantly among the three groups (F(2, 15) = 3.96, p = 0.04, r = 0.31). After the LSD correction, the mean RR for the EEG group was significantly lower than that for the sham group (t(18) = 2.32, p = 0.03, d = 1.26) and multimodal group (t(18) = 2.47, p = 0.02, d = 1.34). The signal characteristics of PPG and RSP were not significantly different among the three groups.
Statistical analysis of differences among the three groups in ECG, PPG, and RSP data.
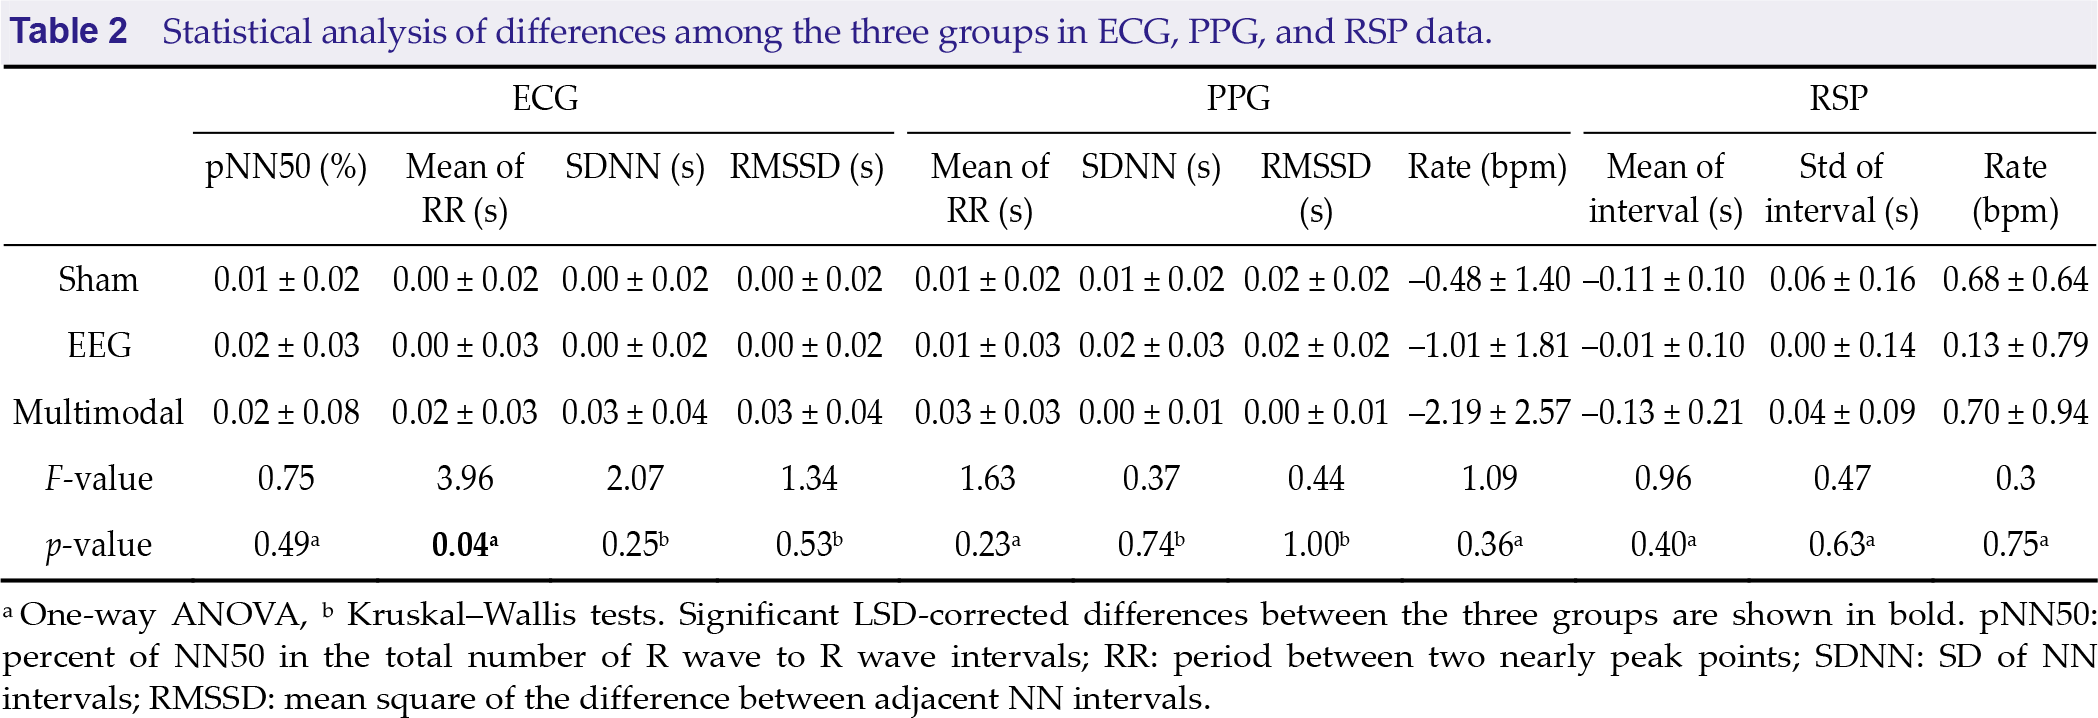
a One-way ANOVA, b Kruskal–Wallis tests. Significant LSD-corrected differences between the three groups are shown in bold. pNN50: percent of NN50 in the total number of R wave to R wave intervals; RR: period between two nearly peak points; SDNN: SD of NN intervals; RMSSD: mean square of the difference between adjacent NN intervals.
3.5 Correlations of network metrics with scale scores
Figure 4 shows that Eloc and Cp are significantly different among the three groups in the θ and β bands. To explore treatment effects for EEG and multimodal groups, Pearson’s correlation was used to further assess the relationship between network measures and scores on the scales; the results are shown in Fig. 5(A). The results of significant correlations between scales and brain network metrics are shown in Figs. 5(B) – (D). The Eloc value was positively correlated with the HRSD scale (r = 0.52, p = 0.05) in the θ band and negatively correlated with the BBS scale (r = 0.52, p = 0.02) in the β band. The Cp value was positively correlated with the HRSD scale (r = 0.47, p = 0.03) in the θ band.
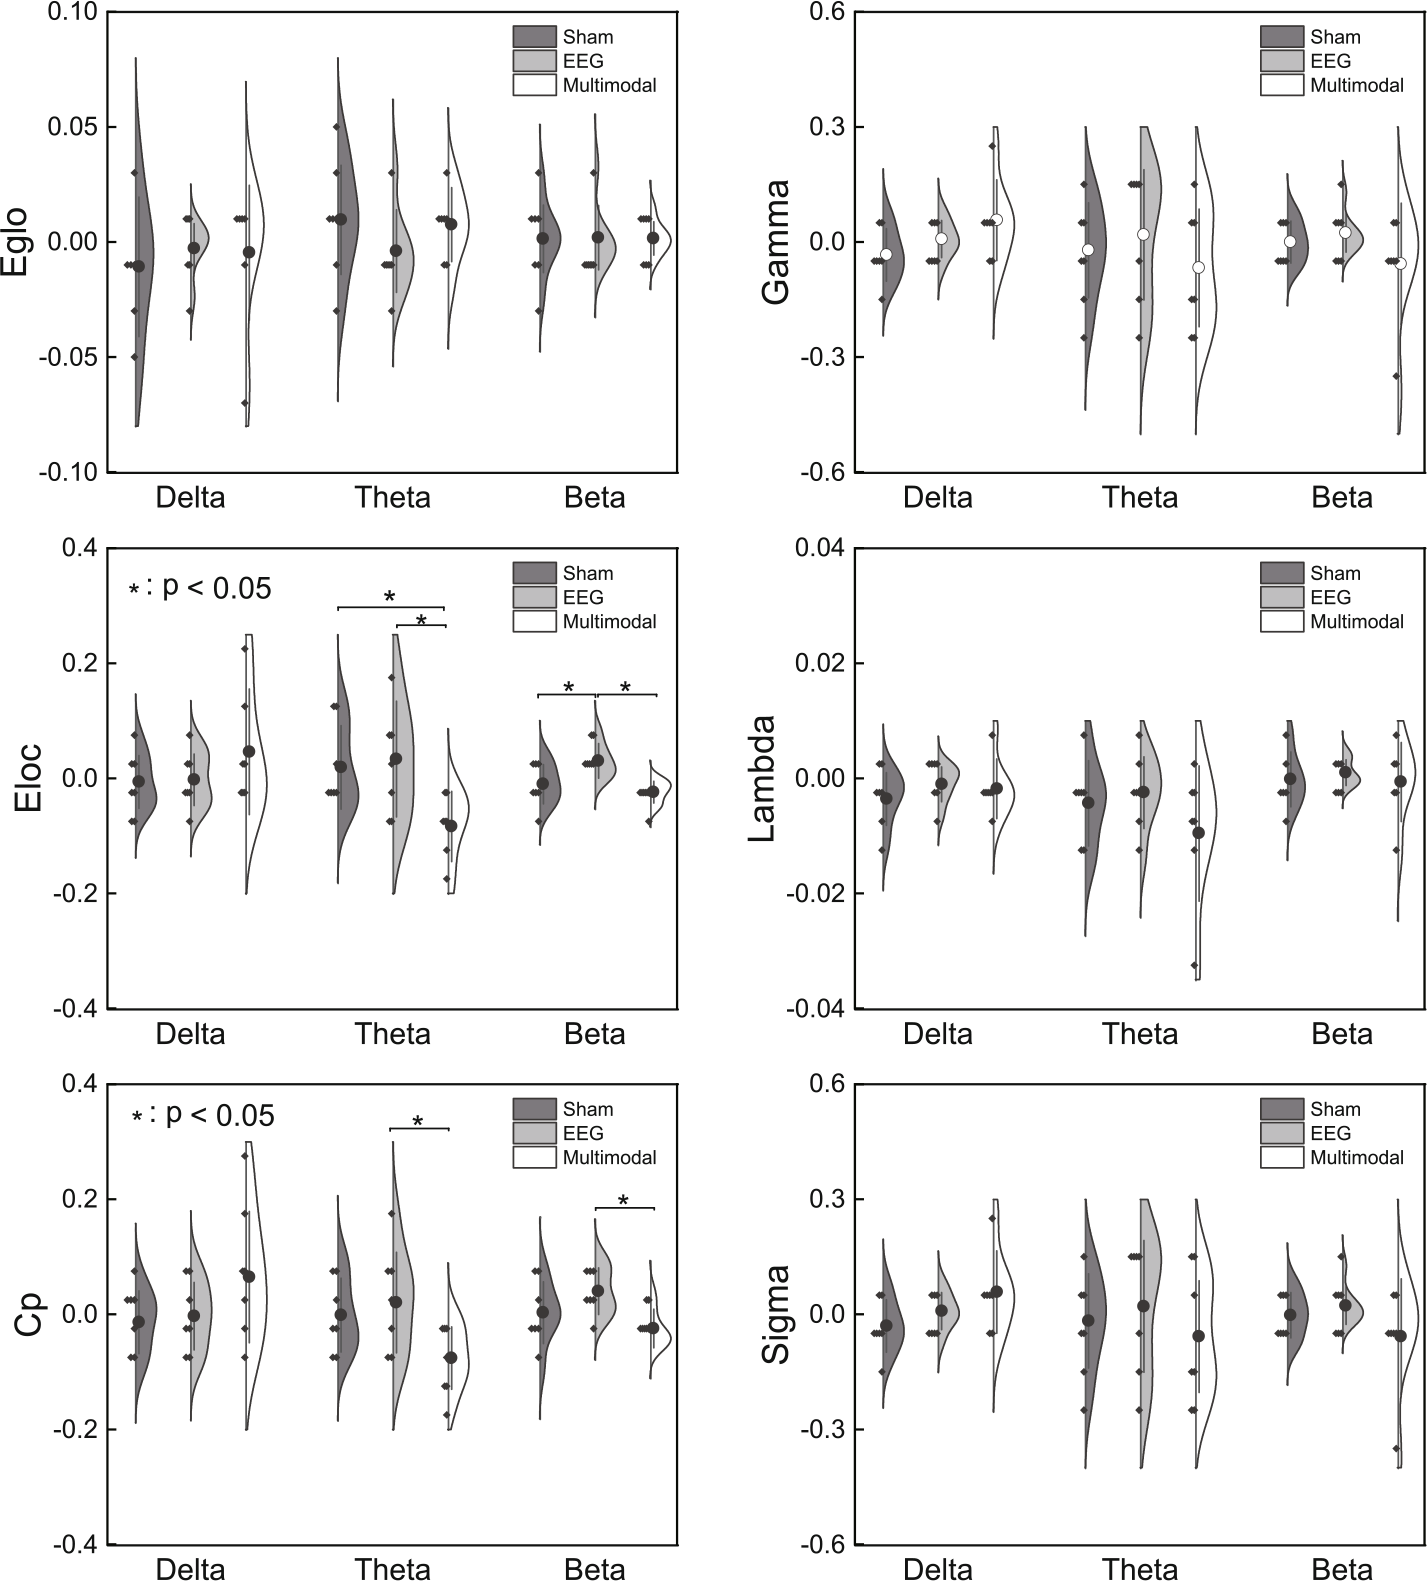
Network metrics of δ, θ, and β bands among the three groups. The network metrics included Eglo, Eloc, Cp, γ, λ, and σ (* p < 0.05, corrected by LSD).
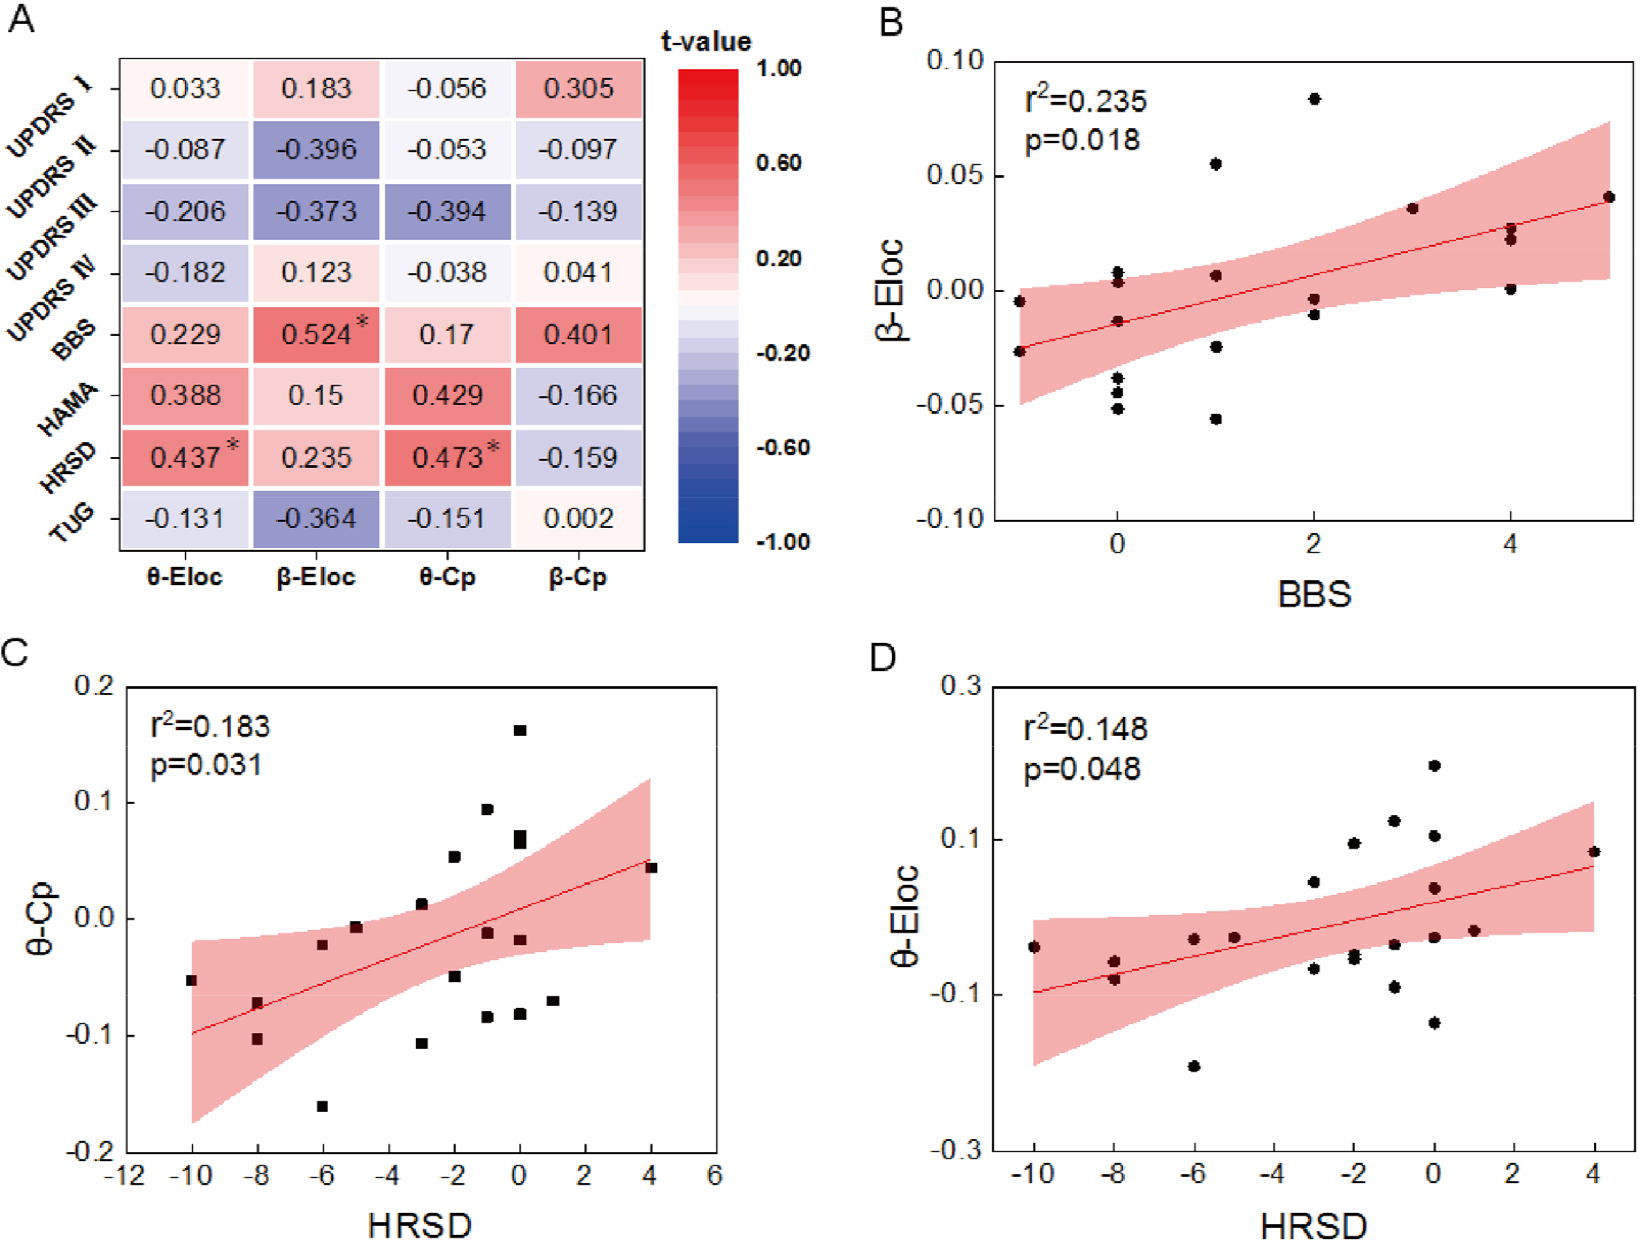
Correlation analysis between PLI parameters and clinical scales. (A) The t-values (* p < 0.05) for the correlations between the parameters of PLI in different frequency bands (θ and β) and clinical scales (TUG, HRSD, HAMA, BBS, UPDRS I, UPDRS II, UPDRS III, and UPDRS IV). (B) – (D) Scatter plots show a significant correlation between β band Eloc and BBS scale scores and θ band Cp, Eloc and HRSD scale scores.
4 Discussion
In this study, we examined the effect of biofeedback training on motor and nonmotor symptoms in patients with PD. The results revealed that multimodal biofeedback improved nonmotor symptoms, particularly depression. Multimodal experiments may modulate neural activity in the frontal and parietal lobe brain regions, particularly in the θ band. Furthermore, motor symptoms improved significantly with EEG biofeedback. EEG biofeedback may modulate neural activity in the β band.
4.1 Mechanism of remission in PD for motor symptoms
Previous studies have demonstrated that patients with PD have lower β energy than normal people [47], which is associated with response suppression and motor symptoms in the β band [48]. Research has shown that stimulation can relieve motor symptoms in patients with PD. For example, deep brain stimulation (DBS) can reduce the oscillation of the β band of the subthalamic nucleus, thereby influencing motor cortex coherence [49]. Consistent with previous studies, the EEG results in this study showed that the EEG group upregulated the β band frequency ratio, which was significantly higher than that of the sham and multimodal groups. Furthermore, research has shown that ECGs are abnormal before motor symptom disorders in patients with PD [50]. In this study, the mean RR for ECG was significantly different. This could be due to subtle changes in the ECG parameter because of improved motor symptoms.
The BBS scale was used to assess balance and motor impairments in patients with PD [51], whereas the TUG scale was used to diagnose the course of PD [52]. The scale results showed that EEG biofeedback training significantly improved the BBS and TUG scale scores in patients with PD. In addition, the BBS scale was significantly positively correlated with the β band Eloc in the relief of motor symptoms in patients with PD. Research has shown that DBS improves rigidity and bradykinesia in the low-β band for functional connectivity [53]. In this study, the improvement in the BBS scale is related to the regulation of the β band Eloc with motor symptoms, whereas the change in the TUG scale is not obvious.
Several neuroimaging studies have demonstrated that the anatomy and function of the brain structure of patients with PD have changed [54], and the resting brain activity of patients with PD has generally decreased [6]. The individualized functional connectivity between the visual and sensorimotor networks in early-stage disease can be used to estimate the severity of motor symptoms [55]. Magnetoencephalogram have been used to show that deteriorating motor function is associated with decreasing Eloc [56]. After treatment, low-β band functional connectivity is increased with improved motor symptoms [53]. This study demonstrated that the EEG group has a significant enhancement in the local parameter of β band efficiency, indicating that the connections with the Eloc brain network were significantly activated, which may have a positive effect on the improvement in motor symptoms.
4.2 Mechanism of remission in PD for nonmotor symptoms
Kuan-Hua stated that impaired startle habituation in patients with PD is a result of attenuated midfrontal θ activity [57]. Patients with PD often experience nonmotor symptoms, such as cognitive deficits, depression, and anxiety. They have less θ power in the dorsolateral prefrontal, inferior frontal, and lateral orbitofrontal cortices [58]. For transcranial alternating current stimulation treatment, the frequency of θ band stimulation can reduce depression and attention deficit disorders in patients with PD [59, 60]. In this study, the multimodal group had an upregulated θ band frequency ratio, which was significantly higher than that of the sham and EEG groups.
According to Armando’s research, the assessment of depressive symptoms is often used in the assessment of patients with PD and is strongly associated with the UPDRS scale, while the HRSD is primarily used for the evaluation of depressive symptoms [61]. The HRSD scores in this study were significantly decreased. The multimodal group had the best intervention result on the HRSD scale, proving that the symptoms of depression improved after the multimodal experiment. In the correlation analysis, the θ band Cp and Eloc had significantly positive correlations with HRSD scores. Previous studies demonstrated that the θ band is associated with a depressive state [62].
In a previous study, Cp, Eglo, and Eloc were significantly higher in the amygdala and anterior cingulate area of the depression group than those of the normal group, and Cp, Eglo, and Eloc decreased after medication treatment [58]. Brain network connectivity between the frontal and parietal lobes is increased with worsening anxiety and cognitive impairment [11]. In addition, Menorca’s research demonstrated that the θ Eglo of the mild cognitive impairment (MCI) group was higher than that of the non-MCI group for attention, working memory, overall cognition, and memory cognitive domains in patients with PD [63]. In this study, the Eloc and Cp parameters of θ band efficiency significantly decreased in the multimodal group, which may have a positive effect on the improvement in nonmotor symptoms. Therefore, the multimodal biofeedback experiment reduced nonmotor symptoms by a θ band.
4.3 Improvement and Prospects
In this study, we still have some improvements to consider in the future. First, there was no significant difference in the regulation of motor symptoms by multimodal biofeedback based on the scale. Although the β frequency ratio of the multimodal group differed, there was no significant difference in brain network analysis. Therefore, whether multimodal biofeedback is effective in regulating motor symptoms remains unknown. This could be due to the difficulty in the design because multimodal biofeedback requires subjects to control EEG, ECG, PPG, and RSP signals simultaneously to achieve high scores, whereas EEG biofeedback only requires subjects to control EEG signals. Thus, we should further improve the experimental scheme of the multimodal biofeedback experiment. To reduce the experiment time, we will update the multimodal biofeedback experiment, which can intervene in motor and nonmotor symptoms simultaneously. In addition, the experiment will be easier, making the biofeedback experiment more user-friendly.
Second, we should keep increasing the number of subjects and conducting related research. The sex ratio of the participants recruited for this study was unbalanced. Although there was no significant difference in the sex ratio among the three groups, we analyzed the differences in the sex of all characteristics. Except for Eglo in the δ band, the results showed no significant gender difference, indicating that gender did not affect the neurofeedback results (Supplemental Table 2). Although some studies have demonstrated gender differences in some symptoms of Parkinson’s disease, some studies have proven that patients with PD have no significant differences in disease progression and partial motor, as well as cognitive functions [64–66], which is consistent with the results of our experiment that gender does not cause differences in EEG, ECG, and other characteristics. We would continue to study whether multimodal feedback increases motor symptoms and whether gender plays a role. Presently, there is a significant improvement in nonmotor symptoms, and whether the significant regulation of multimodal for nonmotor symptoms is specific to PD must be demonstrated further.
Third, Andy’s research studied the effect of biofeedback on rumination and heart rate, which took 6 weeks [67]. Therefore, there are no effective results in the “Parameters of ECG, PPG, and RSP” part, which may be due to the lack of training days. Future multimodal biofeedback training will extend the number of training days to identify mechanistic changes in ECG, PPG, and RSP signals in patients with PD.
5 Conclusion
This study demonstrated the effect of biofeedback on motor and nonmotor function improvement in patients with PD. The results showed that the multimodal biofeedback experiment can intervene in nonmotor symptoms in patients with PD by regulating the θ band. EEG biofeedback experiments can intervene in motor symptoms in patients with PD by regulating the β band. This study confirmed that multimodal biofeedback is effective for treating PD. The experimental protocol can be optimized in the future to treat motor and nonmotor symptoms of PD.
Supplemental Material
Supplemental Material, sj-pdf-1-bsa-10.26599_BSA.2023.9050015 - Multimodal biofeedback for Parkinson’s disease motor and nonmotor symptoms
Supplemental Material, sj-pdf-1-bsa-10.26599_BSA.2023.9050015 for Multimodal biofeedback for Parkinson’s disease motor and nonmotor symptoms by Zhongyan Shi, Lei Ding, Xingyu Han, Bo Jiang, Jiangtao Zhang, Dingjie Suo, Jinglong Wu, Guangying Pei, Boyan Fang and Tianyi Yan in Brain Science Advances
Footnotes
Ethical approval
The study was approved by the Ethics Committee of Beijing Rehabilitation Hospital, Capital Medical University (2020bkky010), and all participants signed an informed consent form before inclusion in accordance with the Declaration of Helsinki.
Consent
Each participant voluntarily provided written informed consent after fully understanding this research.
Conflict of interests
All contributing authors report no conflict of interests in this work.
Funding
This work was supported by the STI 2030—Major Projects (Grant No. 2022ZD0208500); the National Natural Science Foundation of China (Grant Nos. U20A20191, 82071912, 12104049, 82202291); the Key Research and Development Program (Grant No. 2022YFC3602603); the Fundamental Research Funds for the Central Universities (Grant No. 2021CX11011); and the National Key Research and Development Program of China (Grant No. 2020YFC2007305).
Acknowledgements
All the authors thank the participants for their contribution to the research.
Authors’ contribution
Conception and design of the study: Zhongyan Shi. Data acquisition: Bo Jiang, Jiangtao Zhang. Data analysis, manuscript drafting and revising: Zhongyan Shi, Xingyu Han, Lei Ding. Reviewing the manuscript: Guangying Pei, Tianyi Yan, Jinglong Wu, Boyan Fang. All the authors approved the final manuscript.
Data availability
The data that support the findings of this study are available from the corresponding author upon reasonable request.
References
Supplementary Material
Please find the following supplemental material available below.
For Open Access articles published under a Creative Commons License, all supplemental material carries the same license as the article it is associated with.
For non-Open Access articles published, all supplemental material carries a non-exclusive license, and permission requests for re-use of supplemental material or any part of supplemental material shall be sent directly to the copyright owner as specified in the copyright notice associated with the article.