
Abstract
Emotions, formed in the process of perceiving external environment, directly affect human daily life, such as social interaction, work efficiency, physical wellness, and mental health. In recent decades, emotion recognition has become a promising research direction with significant application values. Taking the advantages of electroencephalogram (EEG) signals (i.e., high time resolution) and video‐based external emotion evoking (i.e., rich media information), video‐triggered emotion recognition with EEG signals has been proven as a useful tool to conduct emotion‐related studies in a laboratory environment, which provides constructive technical supports for establishing real‐time emotion interaction systems. In this paper, we will focus on video‐triggered EEG‐based emotion recognition and present a systematical introduction of the current available video‐triggered EEG‐based emotion databases with the corresponding analysis methods. First, current video‐triggered EEG databases for emotion recognition (e.g., DEAP, MAHNOB‐HCI, SEED series databases) will be presented with full details. Then, the commonly used EEG feature extraction, feature selection, and modeling methods in video‐triggered EEG‐based emotion recognition will be systematically summarized and a brief review of current situation about video‐triggered EEG‐based emotion studies will be provided. Finally, the limitations and possible prospects of the existing video‐triggered EEG‐emotion databases will be fully discussed.
1 Introduction
Emotions are the psychological and mental states formed in the process of perceiving and interacting with the external stimuli like environmental changes. Emotions reflect the underlying motivation and consciousness of human behaviors and have a direct impact on the establishment and maintenance of interpersonal relationships, cognition, decision‐making, work efficiency, and other interactive activities [1]. Previous studies found that many diseases, such as depression, autism, gaming disorder, Alzheimer’s, and coronary artery disease are closely accompanied by cognitive and emotional disorders [2 –4]. Disrupted by uncoordinated fast pace of life and high pressure of social competition, increasing number of people have difficulty regulating their affective balance. Being under negative emotions for a long period will eventually affect our physical and mental health, resulting in a sharp decline in the quality of life and happiness index. Therefore, the study of affective computing is of great significance and real‐time emotion recognition has become one of the research hotspots.
With rich media information on both visual and auditory stimuli, video‐based emotion triggering approach offers a favorable technical support for realizing real‐time emotion evoking and recognition in a laboratory environment. Similarly, due to the benefits from the outstanding characteristics of its high time resolution and fast transmission speed, electroencephalogram (EEG) signals have been proven to be a useful tool for human emotion decoding in the field of affective computing. Due to the numerous benefits of EEG signals and video‐based emotion triggering, our paper will mainly focus on video‐triggered emotion recognition using EEG signals. We will first introduce the background of emotion recognition in Section 2. Then, more details about the current available video‐triggered EEG‐emotion databases will be introduced in Section 3. Next, the commonly used methods in EEG signals analysis and emotion recognition modeling will be presented in Section 4 and Section 5, respectively. In Section 6, current limitations and future trends of video‐triggered EEG‐based emotion studies will be fully discussed.
2 Basic information about emotion recognition
2.1 Emotion model
In the existing researches, emotions are usually characterized by two types of models: discrete and dimensional emotion models.
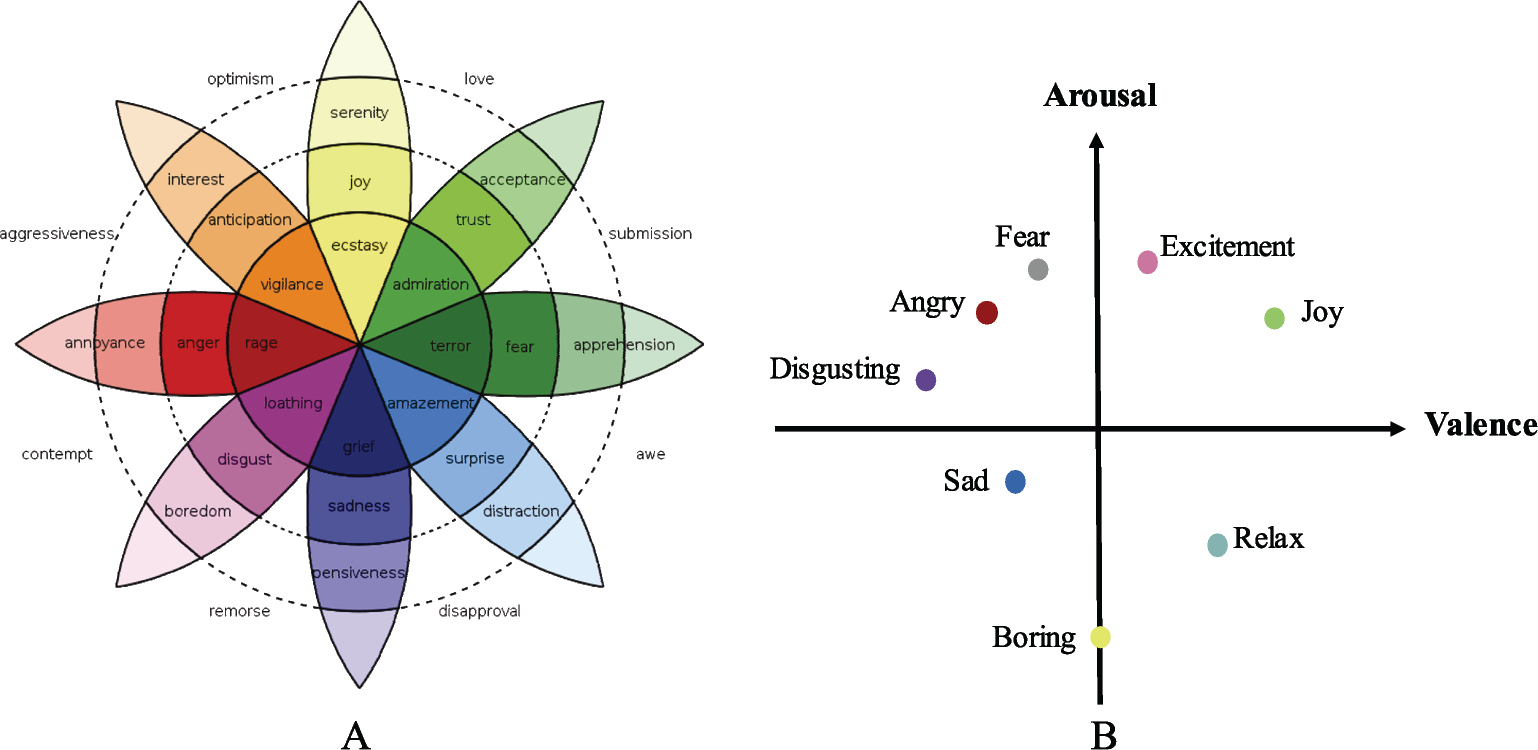
In the discrete emotion model, researchers assume that all types of emotions can be well described by a specific subset of basic emotional states. For example, Plutchik et al. [5] claimed that there were eight basic emotions, namely anger, fear, sadness, disgust, surprise, happiness, trust, and expectation as shown in Fig. 1(A). Ekman et al. [8] also claimed that there were only six basic emotions, namely anger, disgust, fear, happiness, sadness, and surprise. However, the defined basic emotions may fail to reflect the complexity and diversity of emotional states due to its limited numbers. Also, it was found that discrete emotion model has many limitations in practical applications when quantifying the emotional type and intensity [7, 9]. On the other hand, dimensional emotion model provides a more effective way to quantify and characterize the type and intensity of emotions from multiple dimensions (e.g., valence, arousal, and dominance). Here, valence refers to the emotional type of pleasantness or unpleasantness. Arousal measures the intensity of evoked emotions, where excitement is characterized as a high arousal value while boredom with a low one. Dominance reflects the controlling or submissive nature of emotion. In current studies, the most frequently used dimensional model is the Russell’s valence‐arousal (VA) dimensional model [10] shown in Fig. 1(B). In this model, fear could be characterized as an emotion of engative valence and high arousal; joy could be described as an emotion with positive valence and high arousal. Valence‐Arousal‐ Dominance model is another popular dimensional model obtained by adding dominance dimension into VA model [9, 11]. It is evident that dimensional emotion model provides a quantitative expression of emotions, thereby, presenting the emotion information in a more objective and accurate way and providing benefits to emotion recognition modeling.
2.2 Emotion evoking methods
Various emotion evoking methods have been exploited in emotion recognition studies. A properly selected emotion‐evoking method directly affects the quality of the collected data. The selection of appropriate stimulation materials for conducting suitable and effective emotion evoking experiments is one of the key points in emotion recognition. According to the sources of emotion evoking materials, emotionevoking methods can be roughly divided into internal and external stimuli [12, 13]. Table 1 introduces different evoking methods used in emotion recognition studies with their corresponding experimental designs.
Experiment protocol of emotion evocation methods.
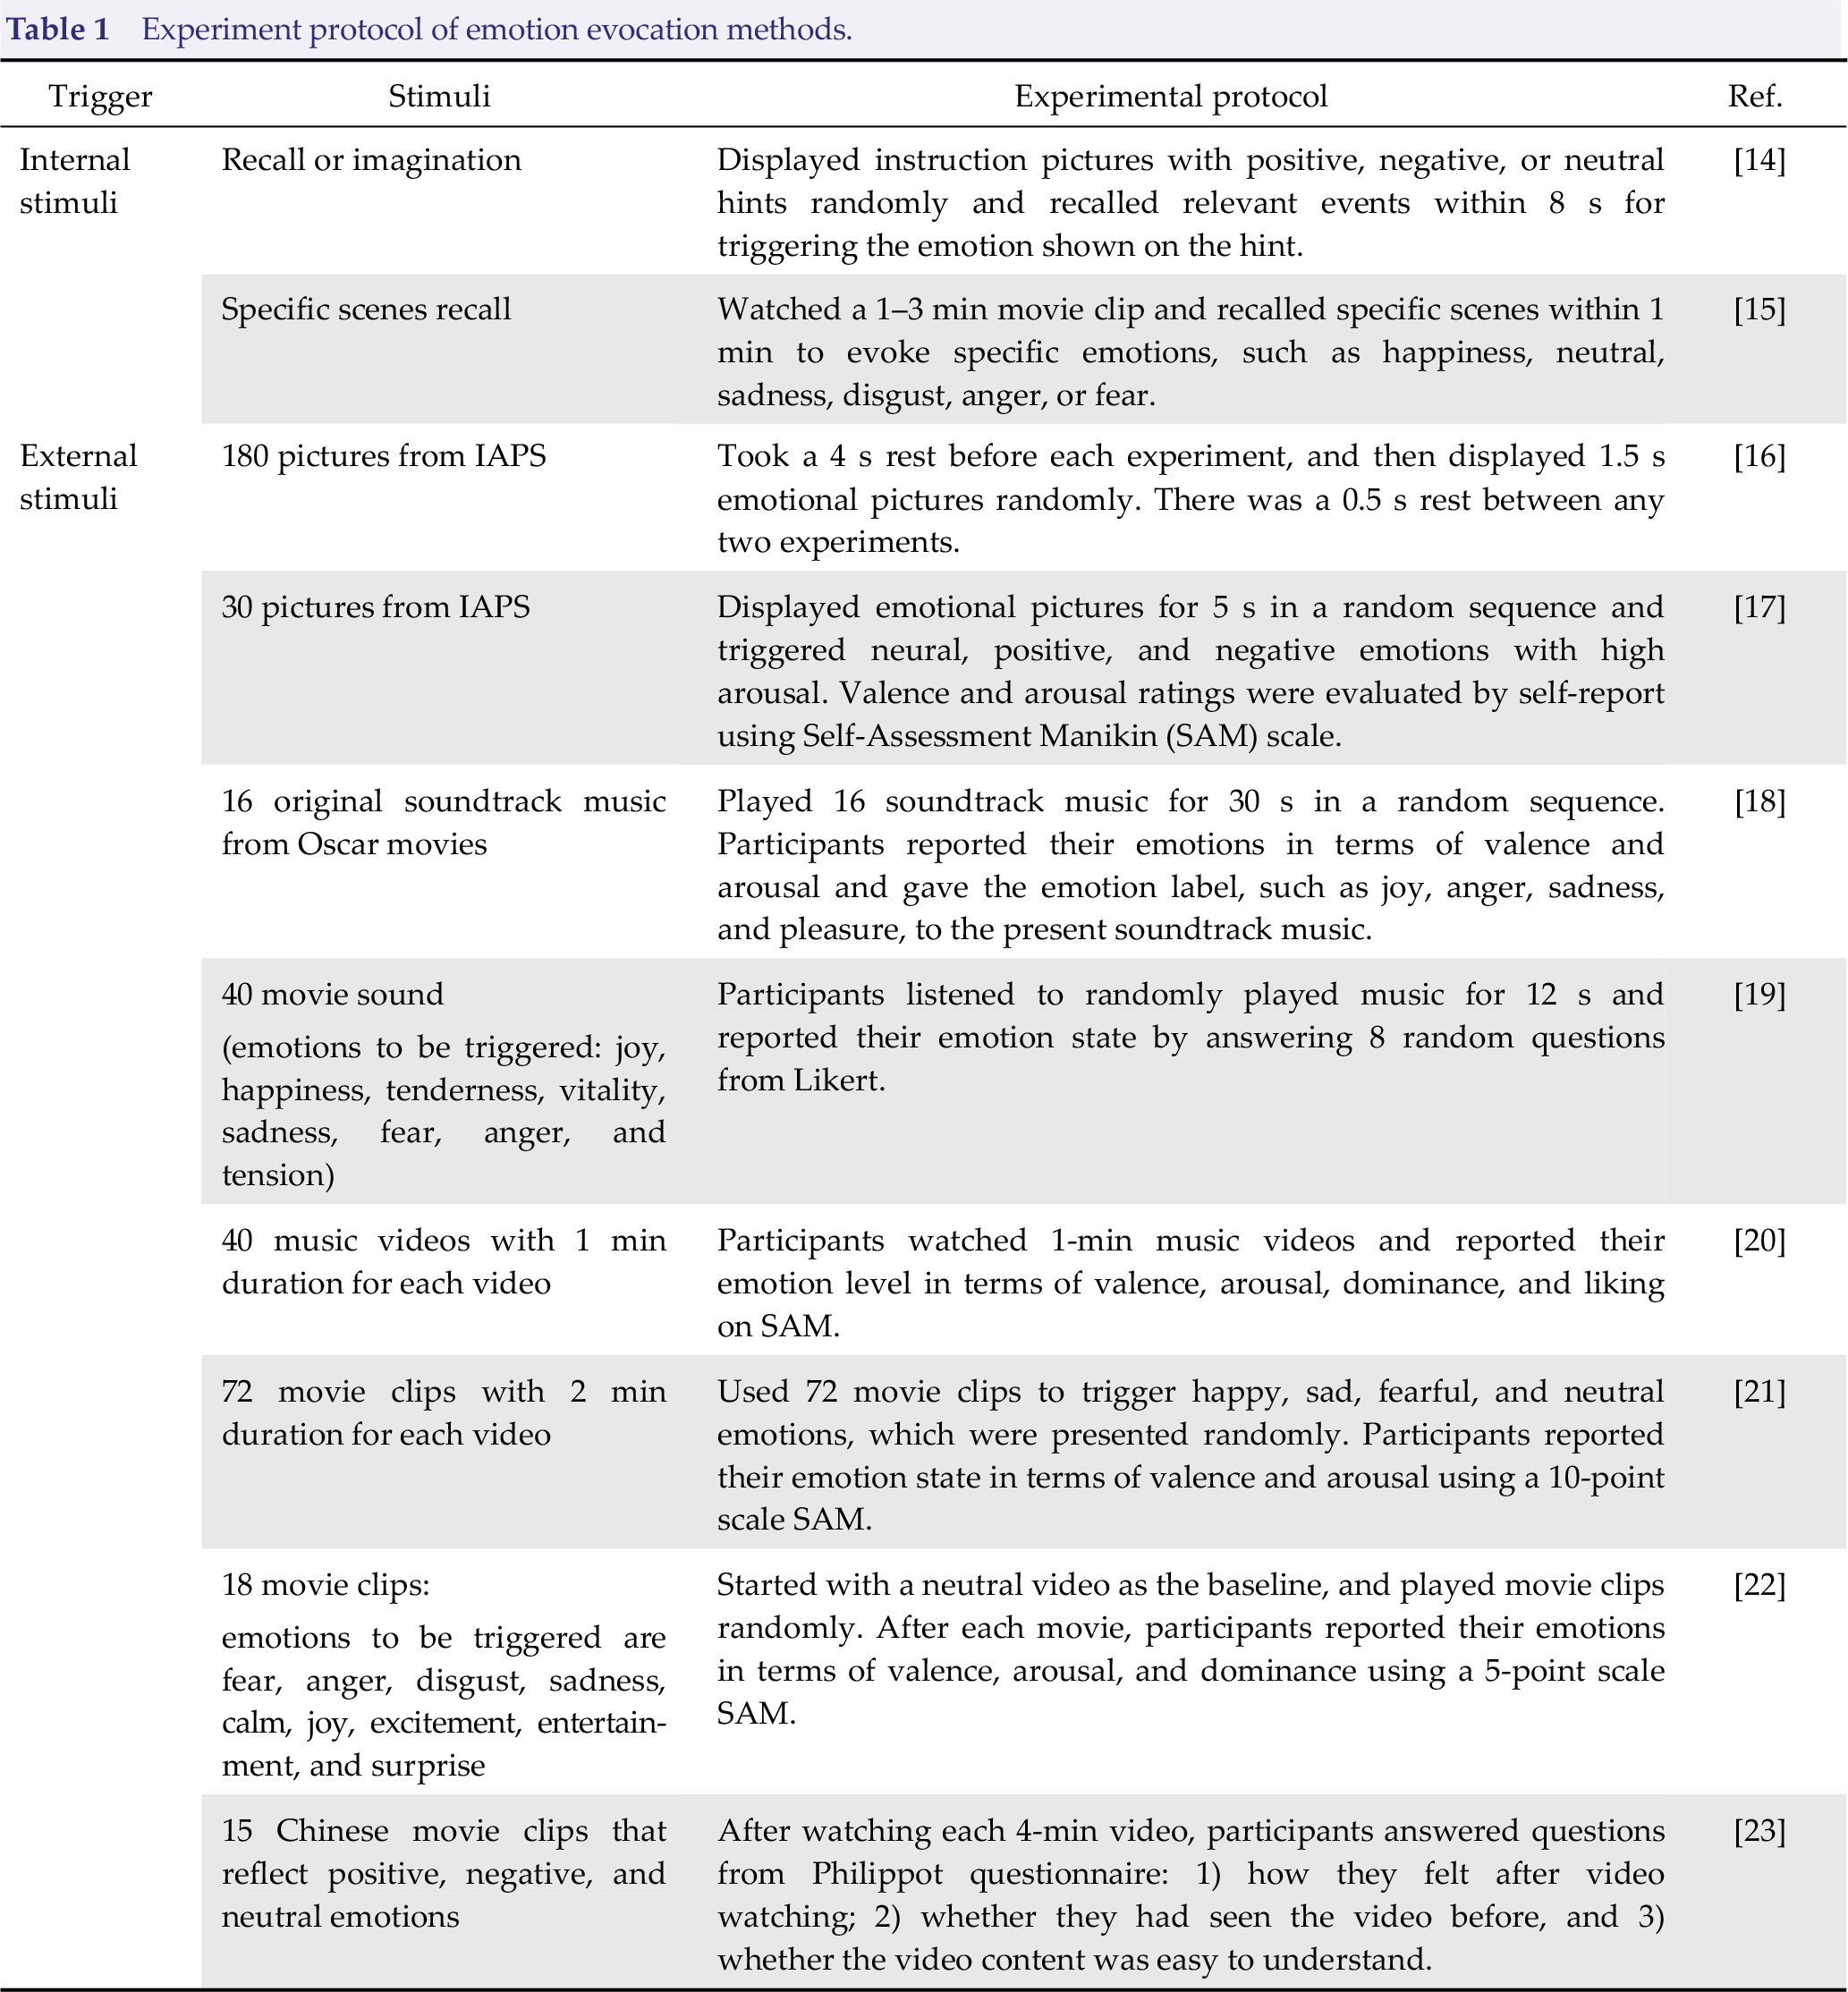
Internal stimuli refer to self‐recall of personal experiences or self‐imagination under the guidance of experimental instructions. For example, Kothe et al. [24] carried out a 3–5 min scene imagination emotion‐inducted experiment. Twelve subjects (25 ± 5 years old) were in a state of deep relaxation with their eyes closed. Under the guidance of verbal instruction, they were instructed to operate scene recall or imagination to induce 12 specified types of negative emotions (e.g., anger, jealousy, depression, fear, sadness, and worry) and positive emotions (e.g., love, happiness, relief, satisfaction, and awe). Based on a sparse feature‐selecting classifier, Kothe et al. achieved the recognition accuracy of 71.3% for binary valence classification. Different from other experimental designs that only relied on self‐induction, Zhuang et al. [15] incorporated external video stimuli into self‐recall experiments to enhance the efficiency of self‐induced emotion responses. Specifically, 30 subjects comprising of 20 males and 10 females between 18 and 35 years old recalled specific scenes of each film with their eyes closed after watching emotion‐induced videos. Specific emotions were triggered, such as happiness, neutral, sadness, disgust, anger, and fear. Zhuang et al. established a cross‐participant emotion classifier based on support vector machines (SVM) and achieved mean accuracy of 54.52% for classification on 6 discrete emotions (i.e., happiness, neutral, sadness, disgust, anger, and fear). An increased cross‐participant classification accuracy of 87.36% was achieved for binary emotion recognition (i.e., positive emotions: happiness; negative emotions: sadness, disgust, and anger).
However, due to the individual differences in age, culture, habits, growth experience, personality, and emotional perception, there are still many limitations of internal stimuli in emotion evoking. Also, it was found that emotions evoked by internal stimuli were mostly negative or mixed emotions [25], hence, it would be difficult to ensure that a specific emotion was accurately triggered.
External emotion stimuli mainly utilize materials like pictures, music (or sounds), and videos for emotion evoking. Since pictures or music can only provide participants with visual or auditory stimuli, the intensity of evoked emotion is limited. On the other hand, videos provide much richer stimulation information with both visual and auditory stimuli, which could be more suitable for triggering specific emotions in a more efficient, accurate, and vivid approach in a laboratory environment [23, 26]. Ellard et al. [27] verified the effectiveness of emotion triggering experiments induced by pictures, music, and movie clips in a laboratory environment. With the ANOVA results of different self‐evaluation indicators like Self‐ Assessment Manikin (SAM) scale, Positive and Negative Affect Schedule (PANAS), and Personal Relevance Scale, Ellard et al. found that video stimuli resulted in better performance of emotion induction in a laboratory environment. Thus, compared with other evoking materials such as pictures and music (or sounds), video‐based external stimuli provide useful technical supports for effective emotion‐inducing in the laboratory and help participants to have a stronger sense of substitution and rapidly respond to the triggering materials.
2.3 Emotional information acquisition
Both computer technology and emotion recognition algorithms could be used to develop an emotional human–computer interaction system for real‐time emotion recognition and regulation. The decoding of emotion information in such human–computer interaction system is mainly based on subjective self‐report from participants (i.e., self‐perception of the emotional state), external expressions (namely tone, volume, facial expression, gesture, etc.) [28 –30], and internal expression (i.e., spontaneous physiological signals) [31]. Here, subjective self‐report refers to individual descriptions and ratings. However, it is difficult to guarantee the validity and accuracy of subjective self‐report as participants may fail to accurately describe their subjective feelings and there may exist individual differences in perceptions of emotions as well [28, 32]. There are similar consciously controlled, restrained, or disguised problems in external behavioral expressions. Due to their low validity and authenticity, external behavioral expressions provide conscious and indirect emotional information [33] and show obvious individual differences influenced by gender, education level, and cultural differences [8]. Different from the weak generalization of subjective experience and external behavioral data, spontaneous physiological signals have relatively higher consistency across cultures and countries [34], which cannot be disguised or restrained consciously. They could be considered as the reflection of realistic emotional information. Therefore, emotion recognition based on spontaneous physiological signals has become an important direction in affective computing [35].
Spontaneous physiological signals can be used to evaluate the activities of the central and autonomic nervous systems and to provide more objective and effective detection of emotional states from the perspective of internal physiology [36, 37]. For example, electrocardiogram (ECG) reflects the activity of the myocardial autonomic nervous system in different emotional states [38]. Galvanic skin response (GSR) measures arousal of emotion by measuring the changes of skin electrical property along with the activity of autonomic nervous systems [39]. Electromyography (EMG) is used to measure the degree of muscle tension in different emotional states by recording bioelectric changes collected on the skin surface [12]. Respiratory signals (RSP) contain a wealth of emotional information and it has been shown that breathing rate and respiratory depth change with different emotions [40]. However, due to the problems of low classification accuracy, lack of reasonable quantitative standards and indirect relationship between emotional states and peripheral physiological signals, it is very difficult to accurately quantify emotions using the spontaneous physiological signals mentioned above [41, 42].
Among the spontaneous physiological signals, EEG signals provide a more direct, comprehensive, and objective approach for emotional recognition from a neurophysiological perspective by measuring the spontaneous physiological activities of cerebral cortex under different emotion states [43 –45]. In comparison with other neuroimaging technologies, such as functional magnetic resonance imaging (fMRI), magnetoencephalogram (MEG), and positron emission tomography (PET), EEG signals have better time resolution, fast data collection and transmission, which could be easily applied to real‐time emotion recognition system [43, 44, 46]. Moreover, EEG acquisition is low cost, noninvasive, and easy to use; there are already different types of wireless portable EEG recording devices developed for various practical and clinical applications. Thus, EEG signals are recommended as a useful tool in emotion recognition and online human–computer interaction system [47].
2.4 Emotion‐related neurophysiological mechanism
Division of brain regions is shown in Fig. 2(A) where each brain region has its dedicated function [49, 50]. Specifically, frontal cortex takes part in conscious thinking activities, language expression, and emotional control; it is the functional area of mental activities. Temporal lobe is responsible for the sense of smell and hearing; it also handles complex stimuli, such as facial recognition, scene recognition, and memory. Participating in the process of attention, body language, and skill learning, the parietal lobe integrates sensory information from various functional systems and plays an important role in the manipulation of objects. The occipital lobe is the visual function area for integration and processing of visual information; it also participates in the process of shape, color, and movement perception. During emotion characterization, particular neural coordination pattern occurred under different emotional states [51, 52]. Schmidt et al. [53] found that left frontal brain region was active under the stimulation of cheerful music, while sad and scary music activated the activities in the right frontal brain region. Schutter et al. [54] found that when participants watched facial expression pictures with angry emotions, the activities in the right parietal brain region increased. Therefore, by detecting the activities in different brain regions, the corresponding physiological response of brain activities in different emotional states can be well characterized.
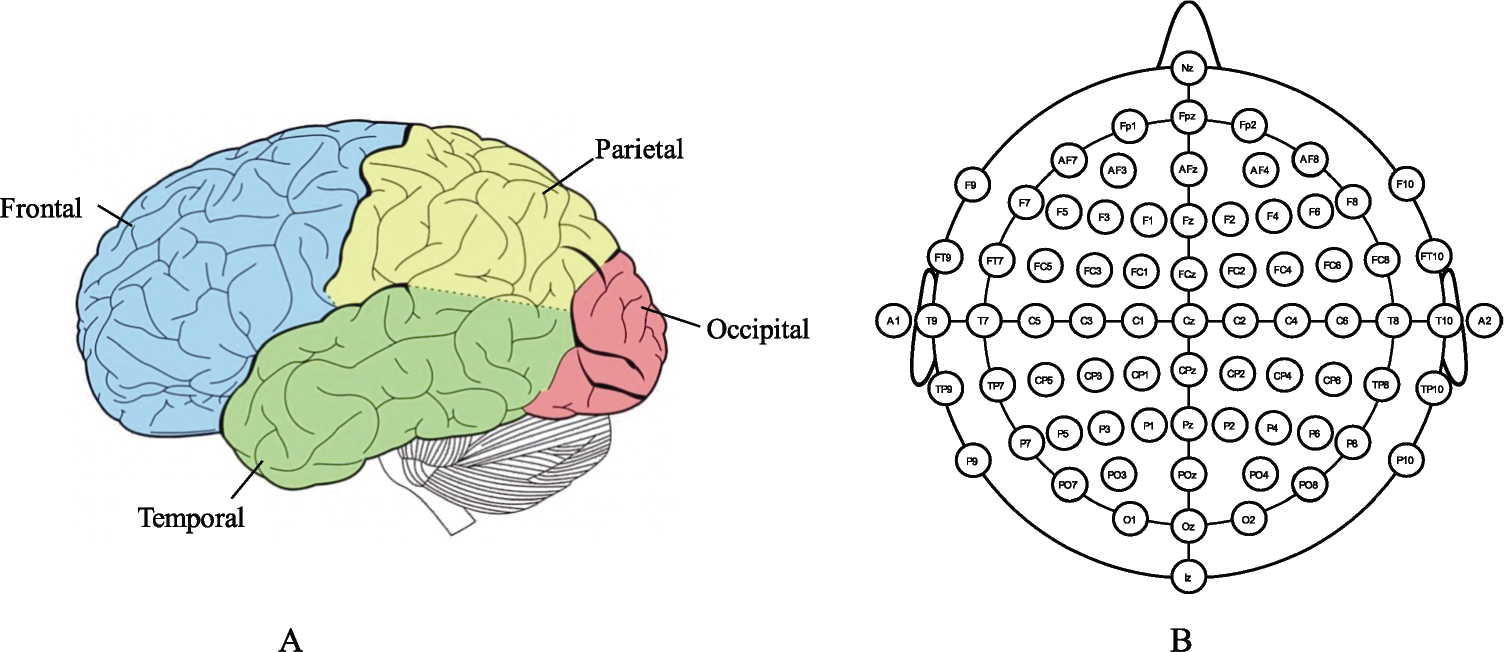
Brain neurophysiological mechanisms. (A) Brain regions. Reproduced with permission from Ref. [48], ©Springer Nature. (B) 64‐electrode system using international 10–20 standard. Reproduced with permission from http://www.mariusthart.net/downloads/eeg_electrodes_10‐20.svg, ©Marius ’t Hart ‐ http://www.beteredingen.nl.
EEG is a non‐invasive monitoring technique for electrophysiological activity of the brain. Using multiple electrodes placed on surface of the scalp [as shown in Fig. 2(B)], the frequency and amplitude of spontaneous electrical activity of cerebral cortex are recorded, and the changes in brain electrophysiology are detected. EEG signals contain rich brain electrophysiological information which are significantly important for the direct and accurate interpretation of emotion from the perspective of neurophysiology [55, 56]. The oscillation characteristics contained in the EEG signals and the rhythms of brain activities in specific frequency bands play a guiding role for better understanding the brain activities such as emotion induction, thinking, cognition, and memory formation [57
–60].
3 Video‐triggered emotion recognition with EEG signals
3.1 Available video‐triggered EEG‐based databases for emotion recognition
With the rapid development of emotion recognition, a series of standardized emotion‐triggering databases with pictures and music materials have been established with the corresponding emotion labels provided by psychologists. They include the International Affective Picture System (IAPS) [74], Nencki Affective Picture System (NAPS) [75] and International Affective Digital Sound System (IADS) [76]. However, current studies with the video‐based emotion-evoking approach are still limited without a generally accepted standard. In this paper, a survey on the available video‐triggered EEG‐ based databases for emotion recognition will be conducted to provide instructive guidance on the establishment of video‐based emotion databases as well as choosing a proper dataset for future emotion recognition researches.
In order to promote the progress of emotion recognition, a number of video‐triggered EEG‐ emotion databases have been developed. As benefits of these publicly available databases, the emotion classification performances using different algorithms or classified models could be verified in a more standard approach. Here, a brief summary of available video‐triggered EEG‐emotion databases is presented in Table 2, including details of the number of participants, video duration, self‐assessment method, and triggering emotion types. Currently, the most commonly used video‐triggered EEG‐emotion databases are Database for Emotion Analysis using Physiological Signals (DEAP), MAHNOB‐ HCI, and SJTU Emotion EEG Dataset (SEED) series EEG databases (i.e., SEED, SEED‐IV, SEED‐VIG).
Details of the existing video‐triggered databases for EEG‐based emotion recognition.
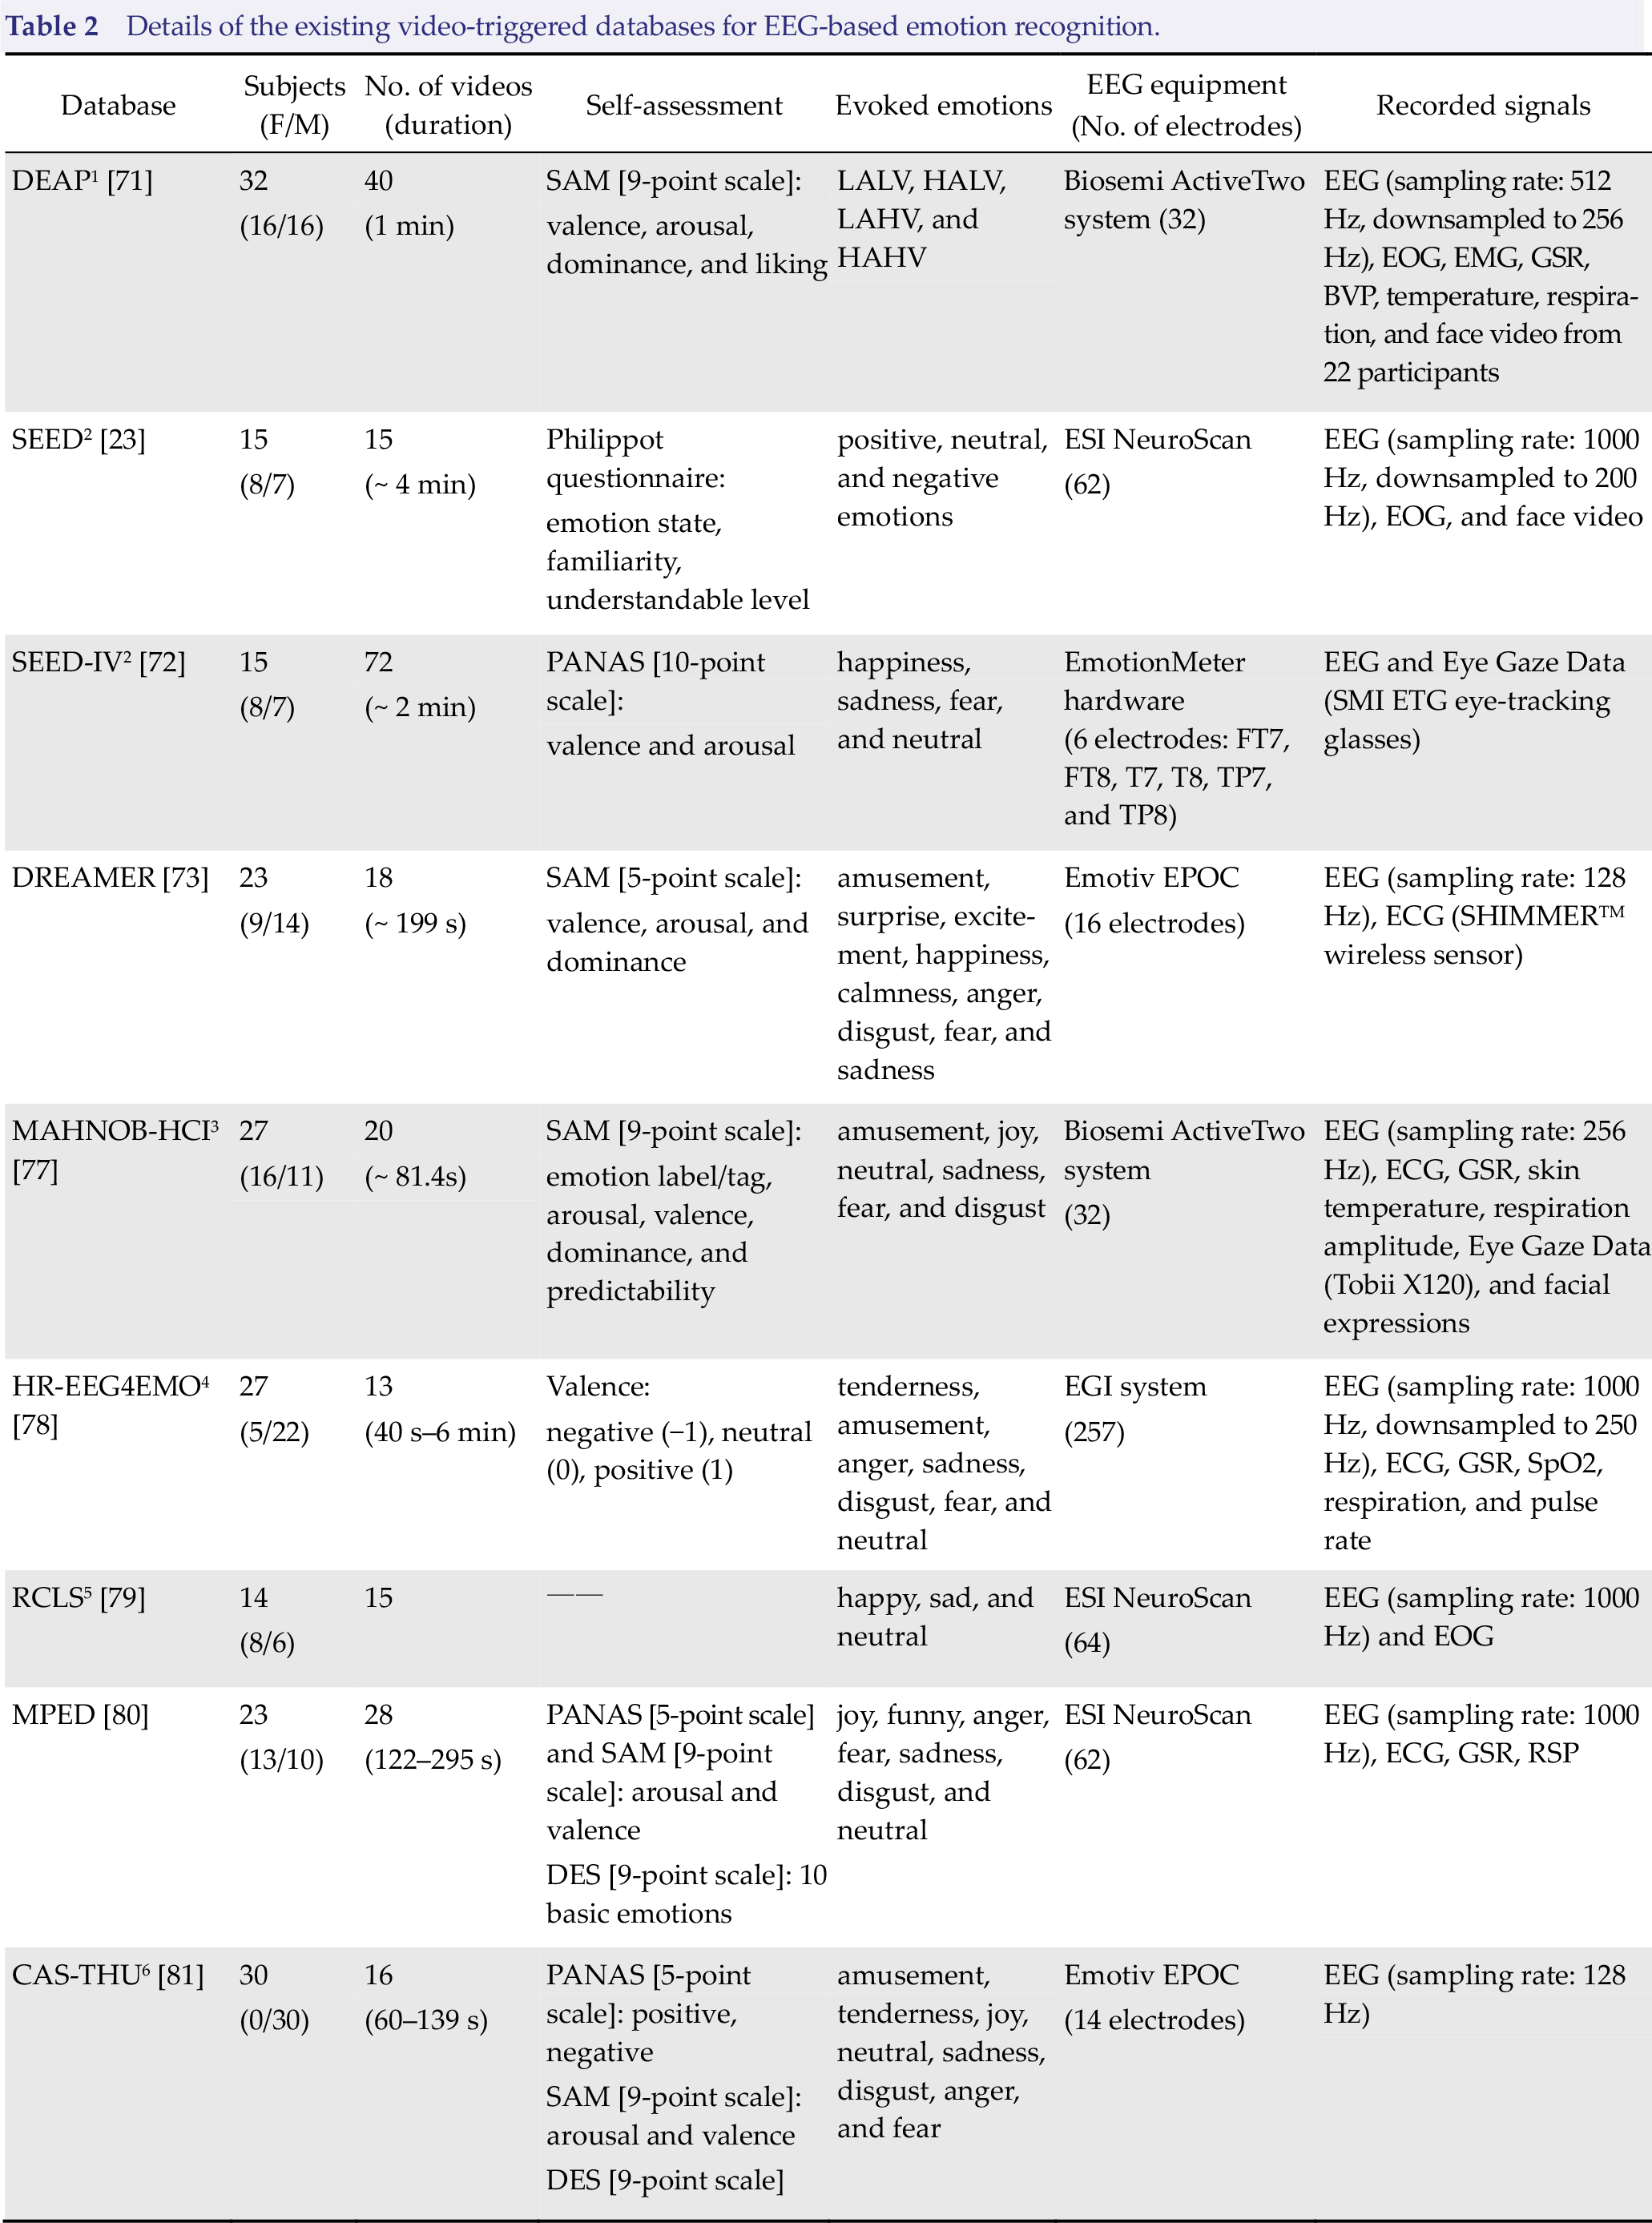
(1) SEED database: Emotion‐related EEG signals from 15 participants were recorded. 15 Chinese movie clips were used for positive, neutral, and negative emotions triggering [82].
(2) SEED‐IV database: This database contains simultaneously recorded EEG signals and eye gaze data for emotion decoding. This database used a 6‐electrode wearable wireless Emotion Meter hardware to record the EEG signals from 15 subjects when watching movie clips. The evoked emotions include happiness, neutrality, sadness, and fear. The simultaneously recorded eye gaze data can be used to interpret the emotion state from external searching behavior. Moreover, combining EEG and eye movement signals with different modality fusion strategies will be of great value for emotion recognition [83].
(3) SEED‐VIG database: This experiment recruited 23 participants and asked them to monotonously repeat straight road driving tasks in a simulated driving system, which could easily induct fatigue and change their vigilance [84]. Then, the vigilance level of each participants was evaluated based on the simultaneously collected EEG signals, EOG signals, and eye gaze data.
LALV, low arousal low valence; HALV, high arousal low valence; LAHV, low arousal high valence; HAHV, high arousal high valence; EEG, electroencephalogram; ECG, electrocardiogram; EOG, electrooculogram; GSR, galvanic skin response; EMG, electromyogram; RSP, respiration; SpO2, pulse oxygen saturation; BVP, blood volume pressure.
Due to the benefits of these publicly available emotion databases, video‐triggered emotion recognition has received extensive attention. For example, Tripathi et al. [85] compared the performance differences between simple deep neural networks and convolutional neural networks in emotion classification based on the EEG signals from DEAP database. The recognition accuracies of simple deep neutral network were 75.78% for valence and 73.13% for arousal. Whereas, the corresponding accuracies of valence and arousal increased to 81.41% and 73.36% respectively when the convolutional neural network was adopted. Liang et al. [86] proposed an EEG‐based emotion decoding system using the hypergraph theory and verified the effectiveness of emotion recognition on DEAP database. More, it’s an unsupervised learning method for emotion‐related EEG features extraction and multi‐dimensional emotion recognition. In addition, Chai et al. [87] proposed a new unsupervised learning method, known as Subspace Alignment Auto‐encoder (SAAE), and verified the emotion recognition performance on SEED emotion database by comparing with other classification algorithms, such as SVM, logistic regression (LR), Geodesic Flow Kernel (GFK), Transfer Sparse Coding (TSC), Transfer Component Analysis (TCA), Auto‐encoder (AE), and Subspace Alignment without Auto‐encoder (SA). In cross‐subject emotion classification, SAAE algorithm obtained the best accuracy (i.e., 77.88%) for positive, neutral, and negative emotions recognition. The recognition accuracies of SVM, LR, GFK, TSC, TCA, AE, and SA algorithms were respectively 53.06%, 55.64%, 45.19%, 69.69%, 73.82%, 60.46%, and 74.74%.
3.2 A general video‐triggered emotion recognition process
Generally, a video‐triggered EEG‐based emotion recognition pipeline mainly includes four parts (as shown in Fig. 3).
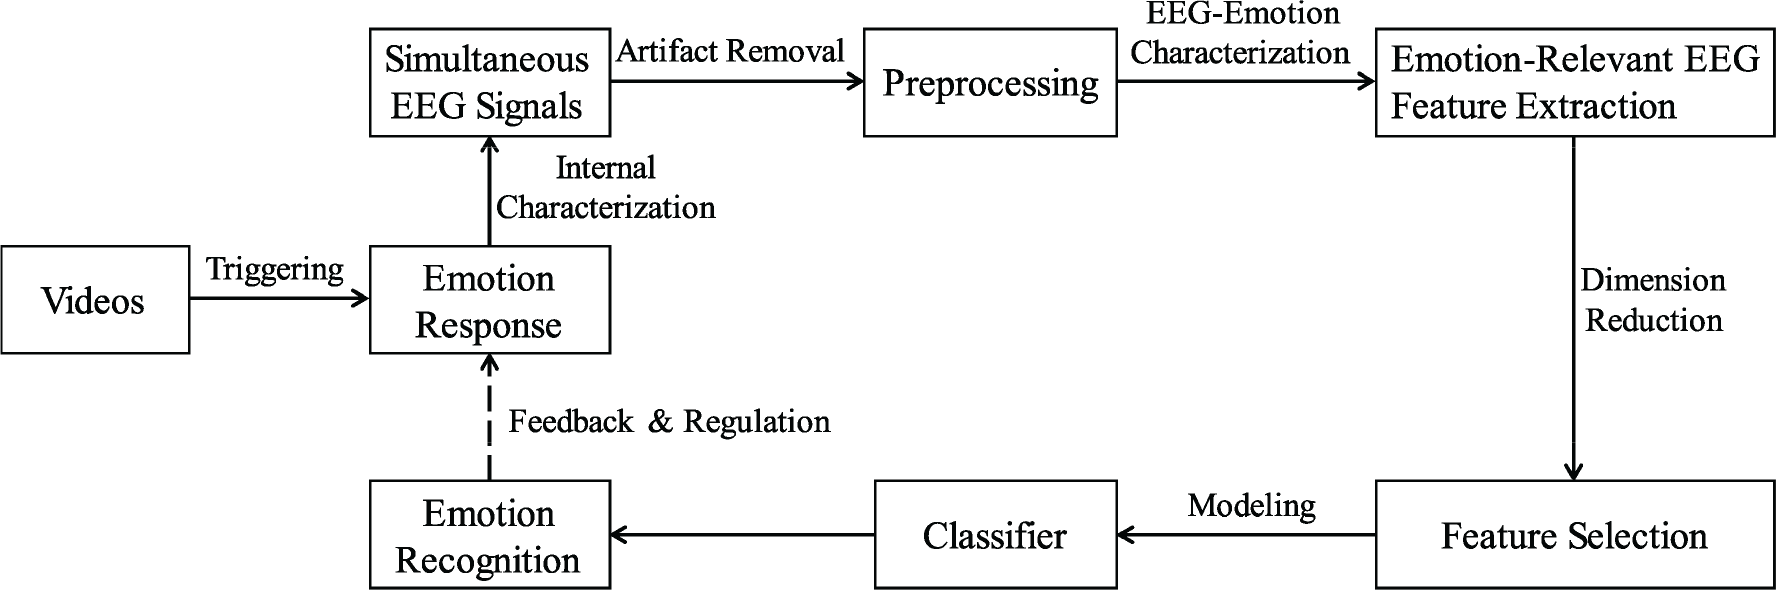
A standard processing pipeline for video‐triggered emotion recognition using EEG signals.
Therefore, commonly used feature extraction, feature selection, and modeling methods in video‐triggered emotion recognition system with EEG signals will be presented with full details, providing a brief review of the current situation about video‐triggered EEG‐based emotion studies. Then, the shortcomings and future possible improvements of the existing video‐triggered databases for EEG‐based emotion recognition will be discussed.
4 EEG feature extraction and selection methods
In this section, more details about typical EEG feature extraction and selection methods used in emotion recognition will be reported (as shown in Table 3 and Fig. 4).
Commonly used EEG feature extraction and selection methods for video‐triggered emotion recognition.
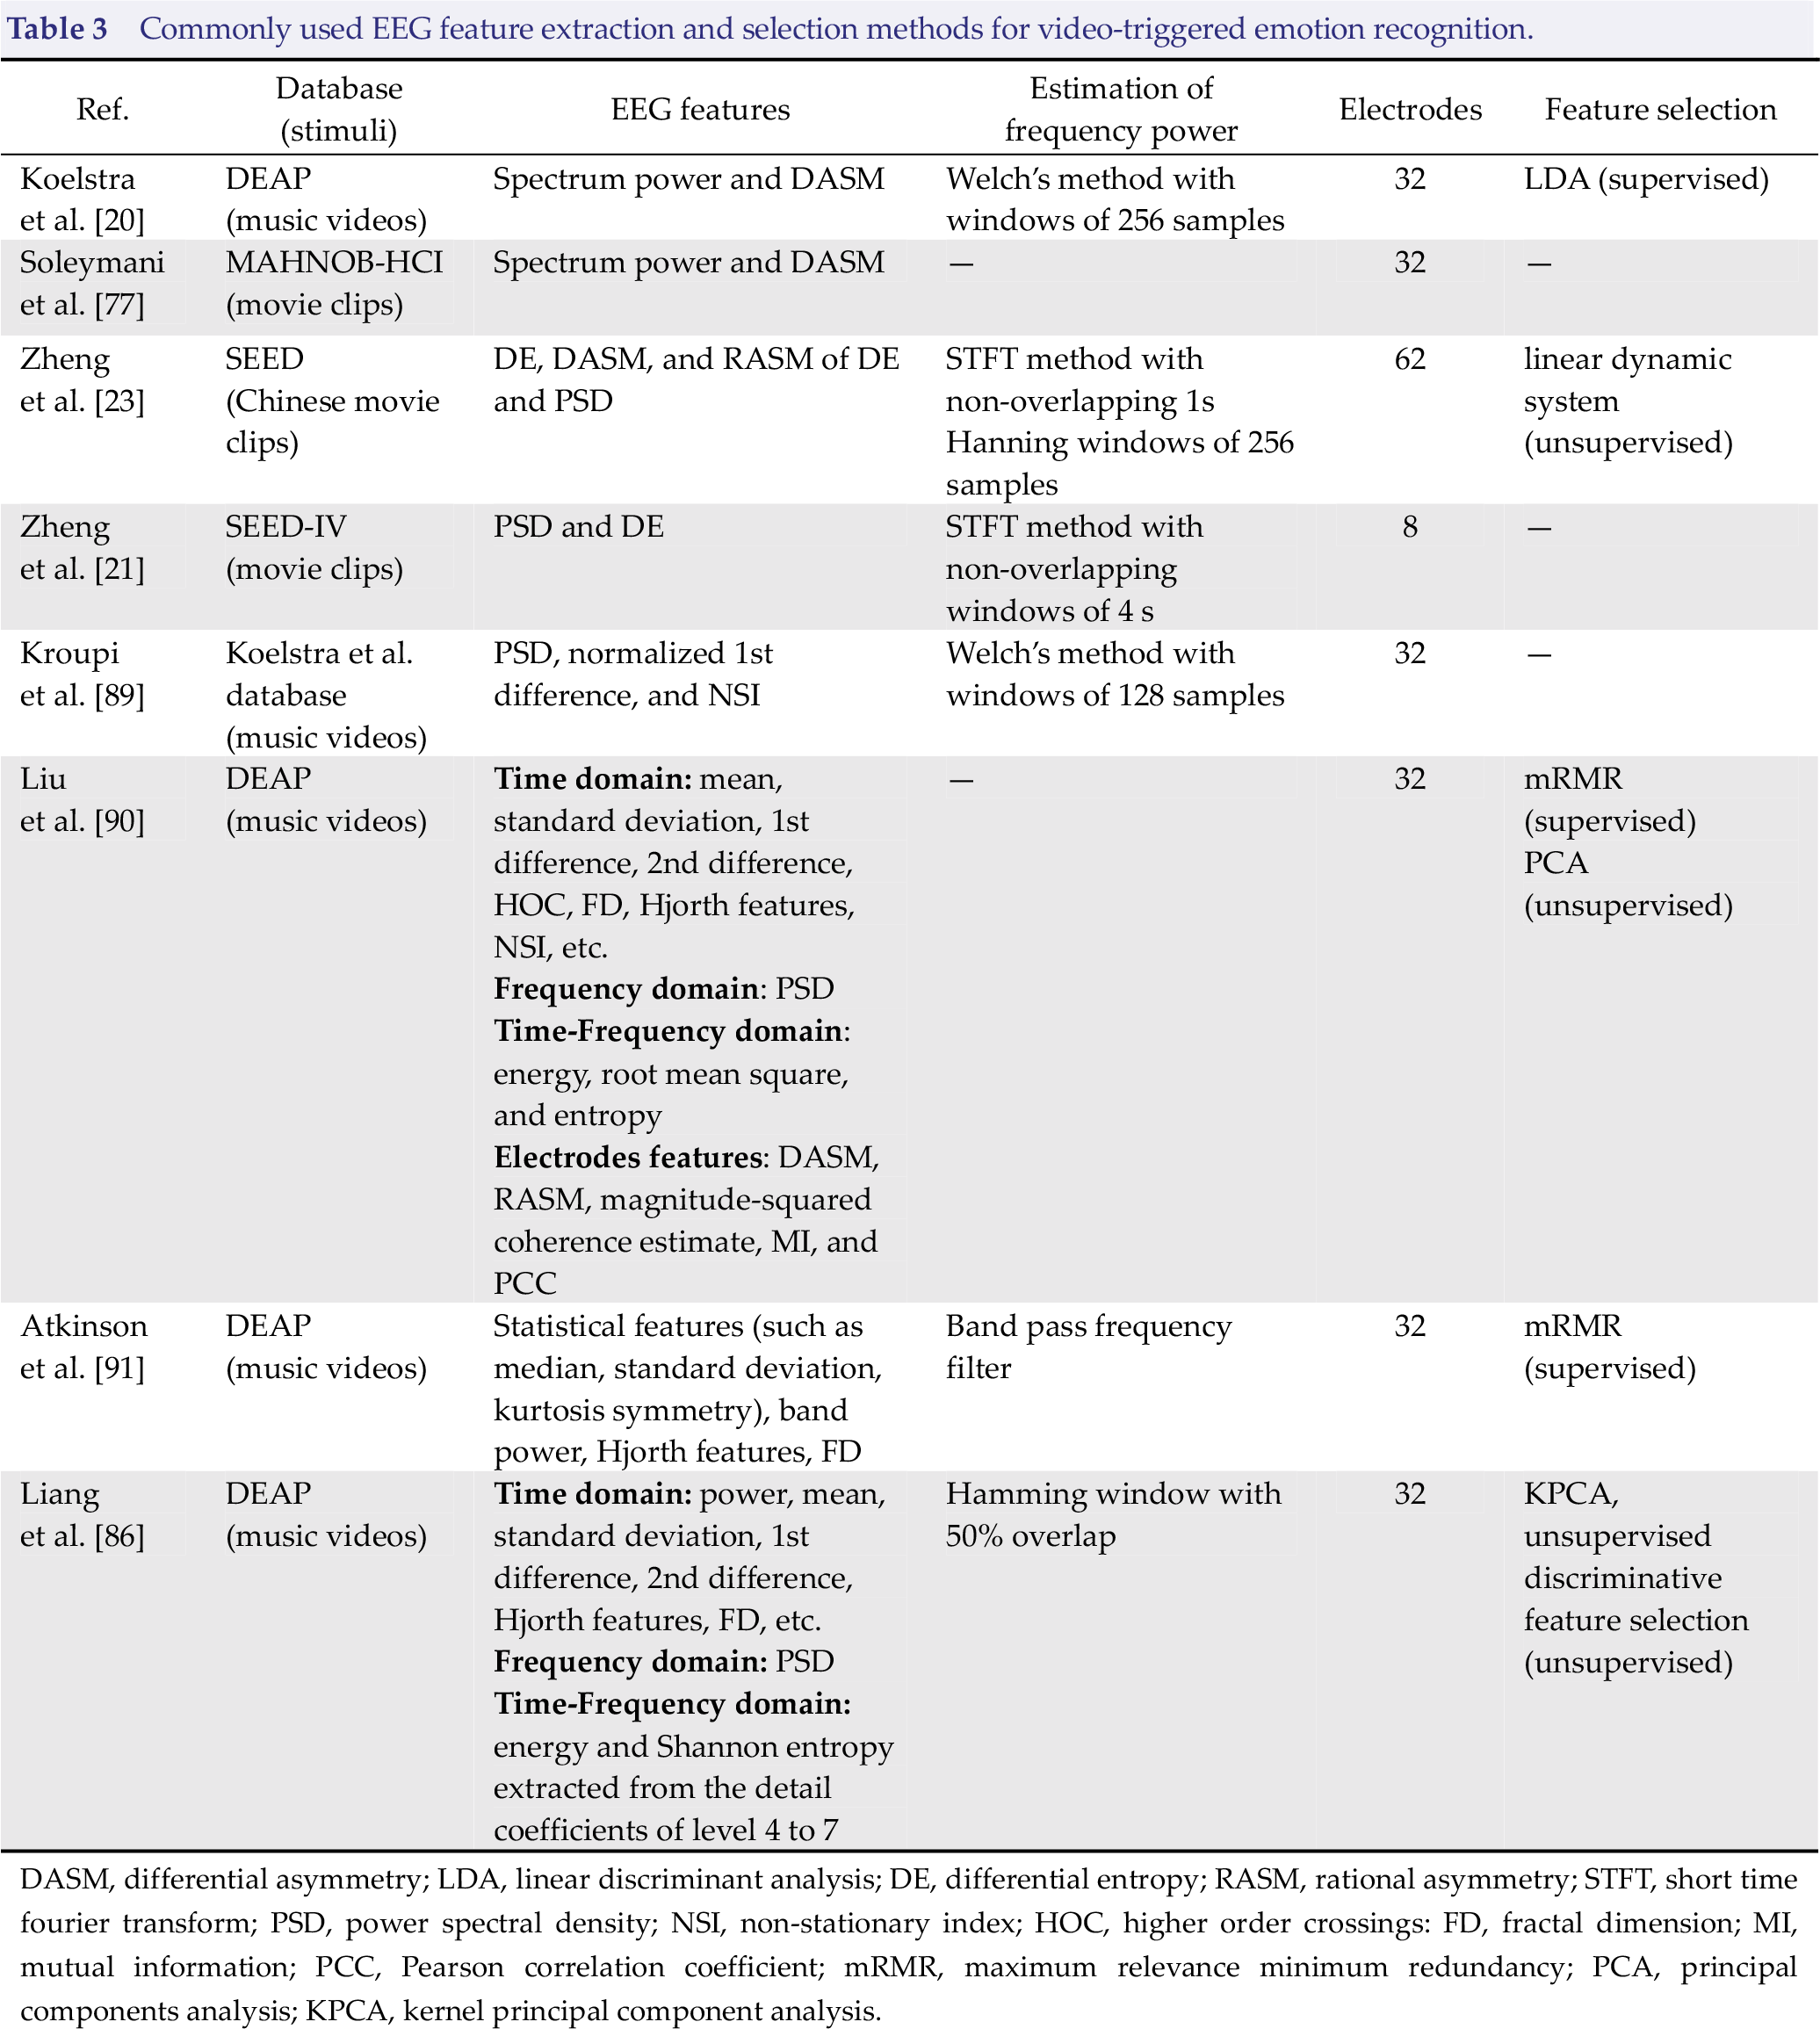
DASM, differential asymmetry; LDA, linear discriminant analysis; DE, differential entropy; RASM, rational asymmetry; STFT, short time fourier transform; PSD, power spectral density; NSI, non‐stationary index; HOC, higher order crossings: FD, fractal dimension; MI, mutual information; PCC, Pearson correlation coefficient; mRMR, maximum relevance minimum redundancy; PCA, principal components analysis; KPCA, kernel principal component analysis.
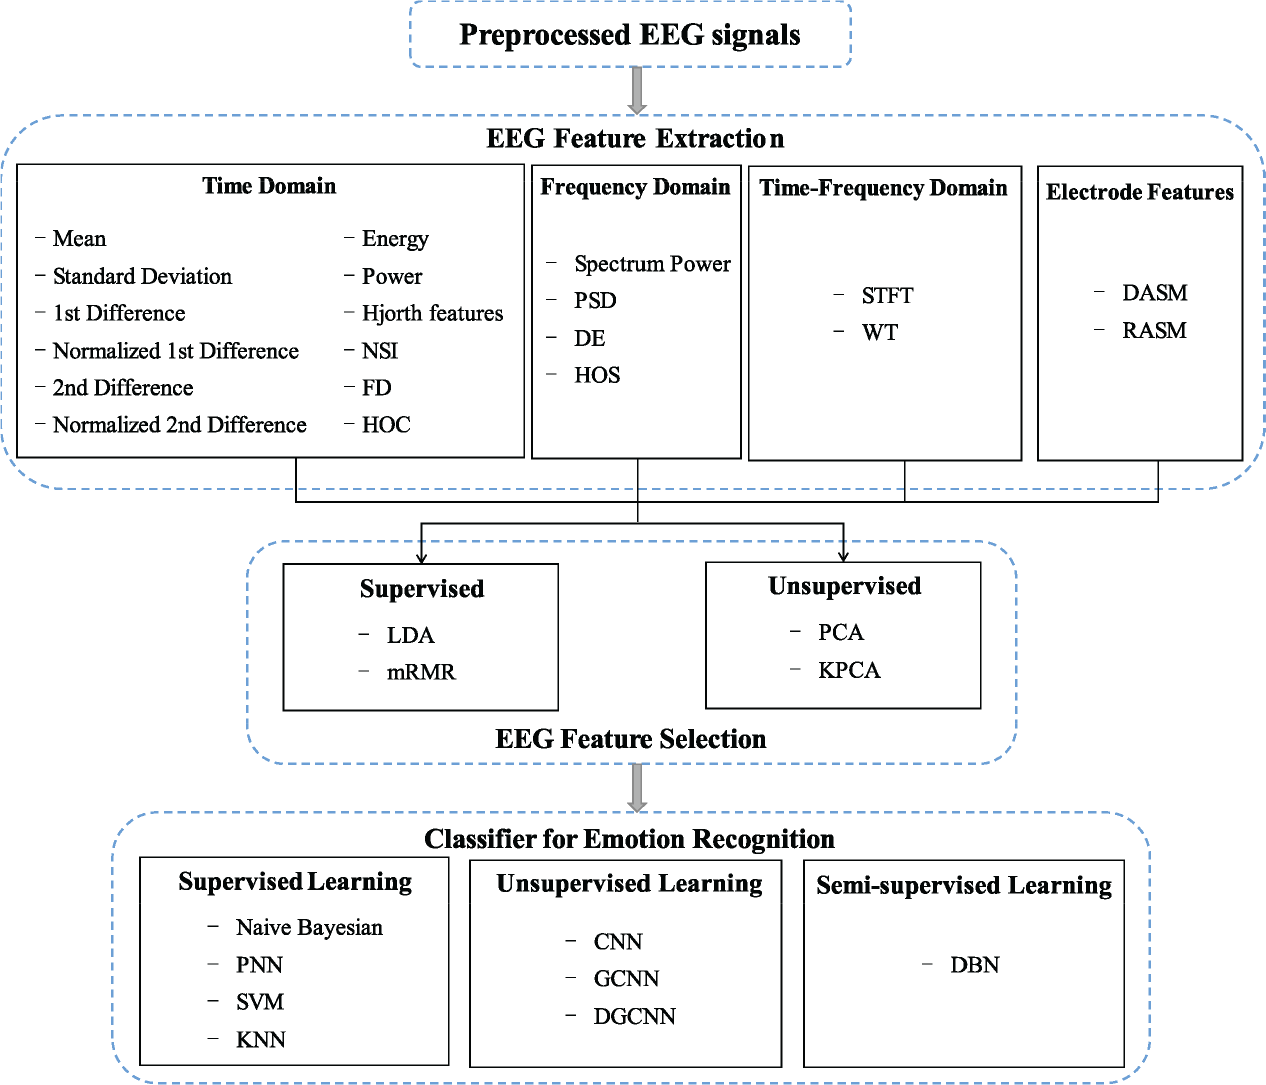
Commonly used EEG analysis methods in video‐triggered emotion recognition.
4.1 EEG feature extraction
EEG features are commonly extracted from time domain, frequency domain, and time‐frequency domain. By computing the asymmetrical brain activity distribution of pair‐wise electrodes, interconnections between brain regions are used to represent the spatial characteristics of brain activity under different emotions. Recently, researchers also found that connectivity features showed promising performance in emotion decoding. A list of the typical EEG signal feature extraction methods in video‐triggered emotion recognition research are exhibited in Fig. 4.
4.1.1 Time domain feature extraction
Time‐domain EEG features represent the amplitude changes over time. Here, the preprocessed EEG signals are denoted as x(n), n = 1, 2,…, N , where N is the total number of EEG samples. The commonly used timedomain based feature extraction methods are listed as follows.
(1) Event related potentials (ERPs): By recording the changes of brain response potentials over time, ERPs have good time resolution and provide the time‐locked relationship with the stimulation events [92]. ERPs have been used to decode the process of emotion inducing and cognition [92, 93]. Martini et al. [94] found that both P300 and late positive potential increased when participants were stimulated by negative pictures compared to when they were stimulated by neutral pictures. Soroush et al. [95] used pictures from IAPS database for positive and negative emotion evoking. Their experiment found that the P200 and P300 components collected at parietal and occipital lobe could effectively decode emotions in valence dimension.
However, in the video‐triggered emotion recognition, it is difficult to determine and control the emotion‐inducing time point because of individual differences. Thus, the ERPs feature is not suitable for video‐triggered emotion recognition.
(2) Statistical features:
1st difference:
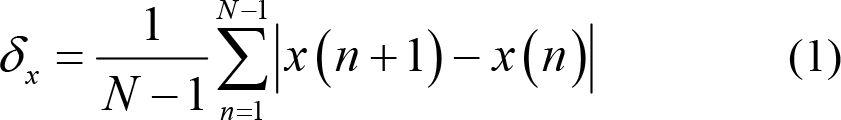
Normalized 1st difference: This is also known as normalized length density, which can measure the self‐similarity of EEG signals [89]. Specifically, when the standard deviation is defined as

2nd difference:

Normalized 2nd difference:

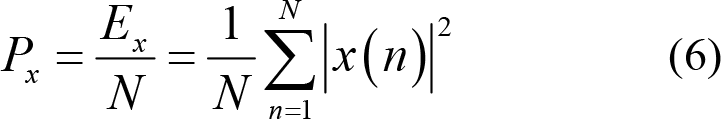
Energy:

Power:
(3) Hjorth features: Hjorth et al. [96] introduced features of Activity, Mobility, and Complexity to characterize time domain pattern of EEG signals from the aspects of amplitude, time scale, and complexity. Specifically, Activity measures the deviation of EEG time series from its mathematical expectation and reflects the dispersion degree of EEG signal amplitude. Thus,

Mobility calculates the ratio between the standard deviation of slope and the standard deviation of EEG time series. x′(n) stands for the first derivative of EEG signals, which is numerically equal to the first difference while σ[x′(n)] represents the variance of the first derivative. Thus,

Complexity, in the other hand, measures the number of standard slopes that occur within the time required for a standard amplitude to be generated. Hence,

(4) Non‐stationary index (NSI) evaluates the transformation of the local average over time. NSI reflects the non‐stationarity and complexity of EEG signals by measuring the consistency of local average values [89, 97]. The higher value of NSI signifies higher complexity of the given EEG signals. The specific calculation process is as follows. Firstly, divide the EEG signal x (n) into k segments with equal length and calculate the mean of each segment s (m), m = 1,2,…,k . Then, NSI is defined as

where
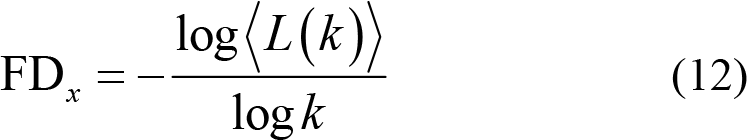
(5) Fractal dimension (FD) quantifies complexity of EEG signals [98, 99] by measuring variations of reconstructed EEG series with fixed time interval, which is expressed as
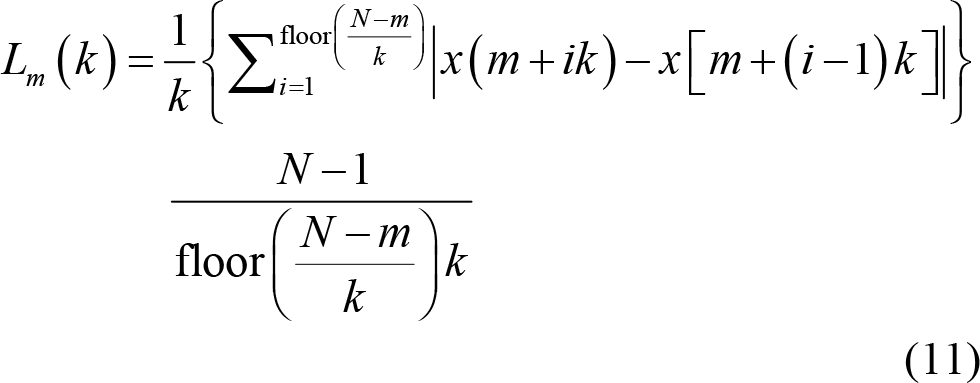
Then, calculate the averaged curve length
4.1.2 Frequency domain feature extraction
EEG signals record the spontaneous and rhythmic nerve potential activity of the brain. Frequency domain feature extraction can obtain more rhythm information about brain neural activity. In many researches of affective computing and neuroscience, it has been found that changes in physiological and psychological states would cause corresponding changes in EEG data at different frequency bands: Delta (1–4 Hz), Theta (4–8 Hz), Alpha (8–13 Hz), Beta (13–30 Hz), and Gamma (30–45 Hz).
(1) Power spectral density (PSD) reflects the change of EEG spectral power with frequency. Since Welch’s spectral density estimation method uses smoothing window for noise reduction, it has become one of the most commonly used spectrum‐based estimation methods in video‐triggered EEG‐based emotion recognition [73, 100].
Frequency domain features not only reflect the rhythm of brain activities but also correlate with self‐assessment of valence, arousal, and dominance. Liu et al. [11] found that when participants are in a state of high dominance, the power ratio of Beta band to Alpha band collected from frontal lobe increased. Meanwhile, the power of Beta band recorded in the parietal lobe also increased.
(2) Differential entropy (DE): This is the extension of the Shannon entropy of discrete random variables to calculate the entropy of continuous random variables. It is expressed as
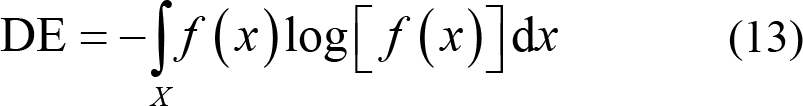
Shi et al. [101] found that the EEG signals preprocessed by bandpass filtering obeyed Gaussian distribution N (μ, σ2). Therefore, the calculation formula of DE can be simplified as
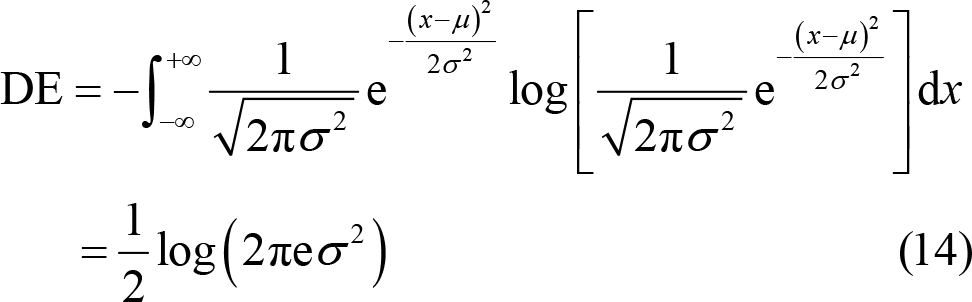
Their study proved that for a fixed‐length EEG signal, DE was approximately equal to the logarithmic value of spectral spectrum in a certain frequency band [102]. Generally, the power of low frequency band is much higher than that of high frequency band. DE can balance such difference by taking logarithm into consideration. Hence, DE feature has the ability to distinguish EEG patterns between low frequency band and high frequency band, thus, improving the recognition accuracy [28]. Duan et al. [101] used DE in emotion recognition research for the first time and found that DE features had a better emotion classification accuracy (of 84.22%) than the tradition spectral feature (with accuracy of 76.56%). Zheng et al. [72] compared the performance of DE and PSD features in recognizing happy, sad, scared, and neutral emotions based on SEED‐IV database. Using SVM with linear kernel, it was found that the recognition accuracy was much better when the classifier was modeled by DE feature, with accuracy of 70.58%, than that modeled by PSD feature, with accuracy of 56.34%.
(3) High‐order spectrum: This represents the higher order moments or cumulants of EEG signals, which has been widely utilized in phase information extraction for emotion distinguishing. Third order spectrum analysis, namely quadratic phase coupling, has promising characteristic of recognizing the nonlinear coupling between phases f 1 and f 2.

where E (•) represents the expectation calculation. X ( f ) is the Fourier transform of EEG series x (n). * represents the complex conjugate operation.
4.1.3 Time‐frequency domain feature extraction
EEG is a non‐stationary signal and it is very difficult to accurately describe the changes of frequency over time using only single time domain or frequency domain information. Joint time‐frequency domain analysis can dynamically reflect the changing characteristics of EEG signals over time and has been successfully used for emotion‐related EEG features extraction.
(1) Short time Fourier transform (STFT): The sliding time window ω (n − τ ) with fixed length L is utilized for dynamically processing the EEG data within the time range of [τ − L / 2, τ + L / 2] . Fourier transform is performed on the data extracted by the sliding time window for local information analysis of non‐stationary signals. Thus,

The length of the sliding time window in STFT typically affects the resolution in time domains and frequency domains. Information overload is caused when the sliding window is too long, resulting in low time resolution. On the contrary, low frequency resolution occurs when the sliding time window is too short to fully maintain information. In essence, it is very important to select an appropriate window size for STFT.
(2) Wavelet transform: Once the sliding time window function is determined, its length and shape are fixed without adaptability and cannot be adjusted according to changes in the frequency. For non‐stationary and slow-changing low‐frequency signals, a long sliding window needs to be selected to improve the time resolution; however, for fast‐changing high‐frequency signals, selecting a short sliding window improves the frequency resolution.
Using the function
Wavelet transform is an effective method that describes the underlying frequency changes over time for emotion recognition [103]. Candra et al. [104] used discrete wavelet transform to extract wavelet entropy from the DEAP database. Their research revealed that the wavelet entropy extracted from 3–12 s sliding time window yielded a recognition accuracy of 65% in the classification of valence and arousal using SVM classifier. Related research found that Daubechies fourth‐order wavelet transform (db4) had the property of feature smoothing and time‐frequency positioning, which was suitable for detecting changes in EEG signals [104]. Mohammadi et al. [105] applied the db4 mother wave function to discrete wavelet transform on the five pair‐wise data (i.e., F3‐F4, F7‐F8, FC1‐FC2, FC5‐FC6, and FP1‐FP2) collected from DEAP database. They fed entropy and energy of Theta (4–8 Hz), Alpha (8–16 Hz), Beta (16– 32 Hz), and Gamma (32–64 Hz) bands into SVM and k‐nearest neighbor (KNN) models. Classification results showed that EEG signals extracted from high frequency bands, such as Beta and Gamma bands, could better classify valence and arousal.
4.1.4 Pair‐wise electrodes features
Pair‐wise electrode features can be used to interpret the underlying spatial distribution pattern in different emotional states [28, 82, 90]. For example, the asymmetric spatial pattern of Alpha band between left and right hemispheres of the brain is related to emotion. Negative emotions, such as fear, disgust, and sadness, produce withdrawal stimuli that activate the right prefrontal lobe and cause the decrease of Alpha band power. Positive emotions, such as happiness and excitement, produce approaching stimuli that activate the left frontal lobe and cause the decrease on the power of Alpha band [106]. Therefore, the asymmetry of power in Alpha band can be used to evaluate the emotion changes [12, 69]. Similarly, the power changes of other frequency bands also show similar asymmetric pattern under different emotional states [46, 107].
According to the spatial symmetry of electrode distribution, pair‐wise electrode features can be extracted by calculating the differences and ratio features of spatial paired electrodes.
Differential asymmetry (DASM):

Differential caudality (DCAU):

Rational asymmetry (RASM):

where C L and C R represent the symmetrically pair‐wise electrodes of the left and right hemisphere, while C frontal and C posterior represent symmetrically pair‐wise electrodes of the frontal and posterior hemisphere. F (•) is the specified feature of the selected electrode for further calculation.
4.1.5 Connectivity features
As a complex and dynamic cognition process, emotion has been further investigated with globally coordinated information transmitting as well as functional connections and interactions within specific brain regions [108, 109]. Connectivity features from EEG signals offer a deeper insight into emotion‐related decoding of neural activities, which demonstrated the outstanding performance in emotion recognition.
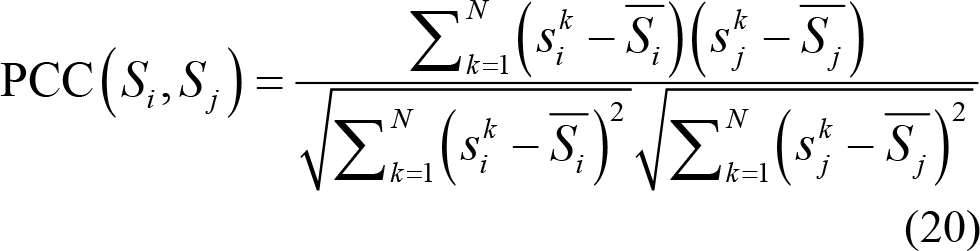
Typically, connectivity features are calculated using the multi‐electrode EEG signals from time and frequency domains, namely Pearson correlation connectivity (PCC), mutual information (MI), and phase locking value (PLV).
(1) Pearson correlation connectivity: This measures the linear correlation between two EEG signals from different electrodes, ranging from −1 to 1. PCC shows negative and positive connectivity relationship, where a PCC value of 0 means no linear correlation between two separated EEG time series Si and S j from different electrodes or brain regions. The PCC between EEG signals Si and S j is calculated as
(2) Mutual information: This quantifies the information interaction between two different electrodes EEG signals in term of entropy, defined as

(3) Phase locking value (PLV): This describes the phase synchronization of different frequency bands. PLV is a nonlinear measure of phase correlation used to characterize specific brain rhythms and couplings. PLV value is between 0 and 1, where 0 represents no phase coupling between two time series within 0 and π, while 1 represents identical phase synchronization. Thus,

Here, ϕx (t) is the Hilbert phase of Sx
and calculated as the ratio of Hilbert transform of the signal Sx
to itself:
Recently, increasing number of researches have proven the effectiveness of EEG connectivity features for emotion recognition. Chen et al. [110] extracted PCC, MI, and phase coherence connectivity for emotion recognition using the DEAP database. A binary SVM classification was performed and the results showed that the best accuracies of 76.2% for valence and 73.6% for arousal were obtained using mutual information with all frequency bands. Moon et al. [111] fed brain connectivity features into convolutional neural networks for emotion recognition. Based on PCC, PLV, and transfer entropy extracted from DEAP database, an outstanding recognition accuracy of 80.7% for valence was obtained when convolution kernel sizes was 5 and connectivity matrix of PLV was used as the input data. In order to explore the dynamic emotion‐related neural mechanism, Liu et al. [112] proposed a dynamic functional connectivity method by separately sorting the static networks constructed from phase lag index and then feeding them into temporal brain network. They validated the effectiveness of this dynamic functional connectivity analysis on SEED database and achieved recognition accuracy of 87.0% in Beta band.
4.2 EEG feature selection
High dimension EEG features may contain large numbers of unnecessary features. In order to avoid the curse of dimensionality and improve classification performance, it is necessary to select out emotion‐related EEG features prior to emotion classifier modeling.
According to whether label information is used, feature selection can be simply classified into supervised and unsupervised based feature selection.
4.2.1 Supervised feature selection
(1) Linear discriminant analysis (LDA) is a supervised linear dimensionality reduction and feature selection method. The main idea of LDA is to find a suitable projection direction based on the class discriminatory information. Projection direction is determined when minimal intra-class variance and maximal inter‐class variance are simultaneously achieved [20]. Thus, projection points from the same class should be as close as possible and the distance of points from different classes should be as far as possible.
The ratio of the intra‐class variance to the inter‐class variance is recorded as a Fisher score. The higher the Fisher score, the higher the discrimination between two groups of features. LDA selects out the feature subset with the largest Fisher score to achieve the purpose of feature selecting.
(2) Maximum relevance minimum redundancy (mRMR) adopts MI to select out emotion‐related EEG features that satisfy both maximum correlation and minimum redundancy [91].
Selecting the feature subset in high relevance with labels can reduce information redundancy. First, the correlation between EEG features F and emotional label c is calculated with the help of MI.

The maximum correlation is obtained first by calculating the average mutual information between features Fi and class c in each feature subset S [82]. The feature subset S has high correlation with class c . It is calculated as:

The features selected by the maximum correlation may have redundant information. Therefore, the dependence between features is large. When the correlation and dependence of feature Fi and Fj is large, removing one of them will not affect the recognition performance [113].
Therefore, the features with low dependency can be further filtered using the minimum redundancy calculation, which can effectively reduce the redundancy and dimensionality of features. Thus,
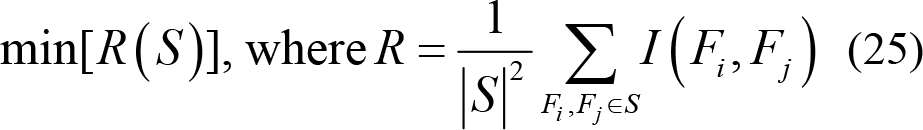
The purpose of mRMR feature selection is to find the feature subset that simultaneously satisfies maximum relevance and minimum redundancy. Hence,

or

Here, feature subset Sk −1 that satisfy the objective function mentioned above is filtered first. Then, forward search method [113] is used for next feature searching from the remaining feature set {F − Sk −1} . Feature subset Sk is finally selected as follows:

4.2.2 Unsupervised feature selection
(1) Principal components analysis (PCA) is one of the commonly used unsupervised feature selection methods. Orthogonal transformation is used for linear transformation. By projecting samples into a low‐dimension space, a series of linearly independent principal components are obtained. PCA preserves as much data information as possible by minimizing the reconstruction error during feature selection.
(2) Kernel principal component analysis (KPCA) is a nonlinear extension of PCA. Nonlinear mapping function Γ is used to map the data to a higher dimensional Hilbert space to make them linearly separable. Then, PCA is applied for further dimension reduction. The process of KPCA calculation is as follows: a) Feature dataset b) The kernel matrix c) The transformation matrix d) Finally, feature subset is selected as
5 EEG‐based emotion classifiers
Modeling is one of the significant processes in affective computing, where machine learning algorithms can effectively learn the underlying relationship between different emotional states and EEG features. The commonly used supervised learning, unsupervised learning, and semi‐supervised learning classifiers on video-triggered EEG‐based databases for emotion recognition are reported in Table 4.
Emotion classifiers and recognition accuracies in databases for video‐triggered EEG‐based emotion recognition.
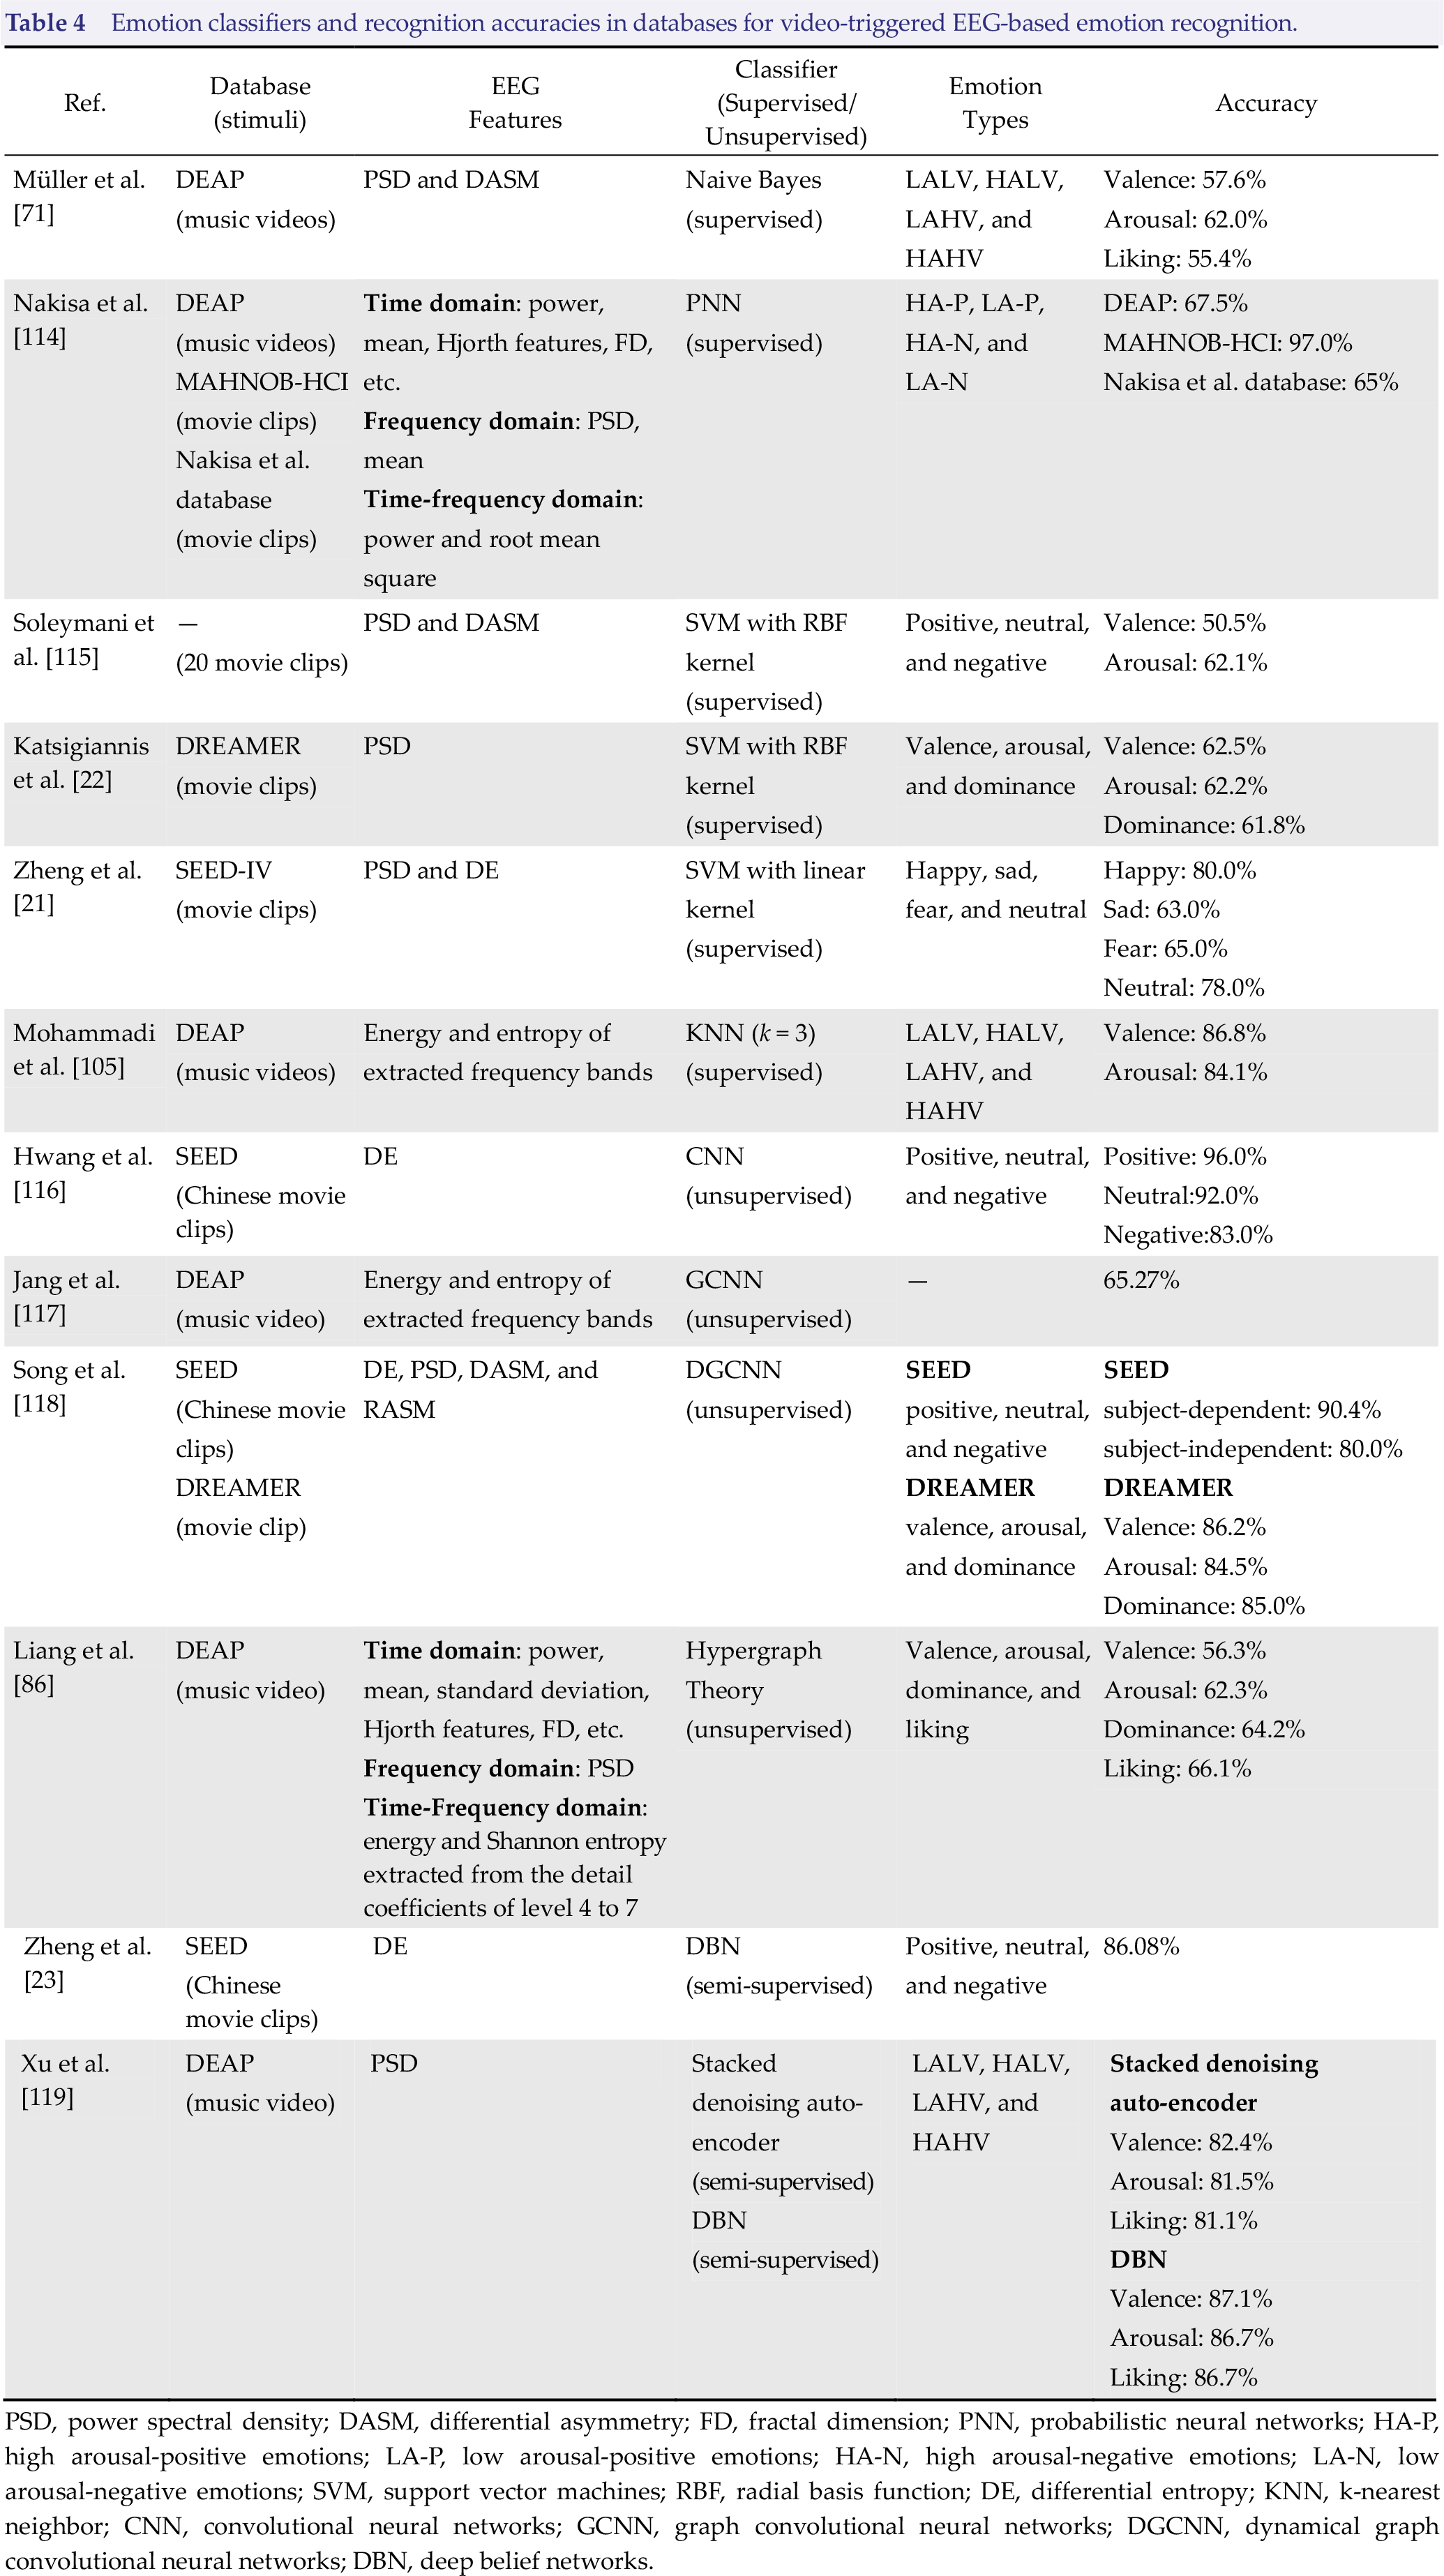
PSD, power spectral density; DASM, differential asymmetry; FD, fractal dimension; PNN, probabilistic neural networks; HA‐P, high arousal‐positive emotions; LA‐P, low arousal‐positive emotions; HA‐N, high arousal‐negative emotions; LA‐N, low arousal‐negative emotions; SVM, support vector machines; RBF, radial basis function; DE, differential entropy; KNN, k‐nearest neighbor; CNN, convolutional neural networks; GCNN, graph convolutional neural networks; DGCNN, dynamical graph convolutional neural networks; DBN, deep belief networks.
5.1 Supervised learning classifiers
Supervised learning classifiers establish the feature‐label mapping relationship and modify the parameters of classification model under the guidance of label information. Generally, higher recognition accuracy can be obtained by using supervised learning‐based classification models. Emotion classification with supervised learning algorithms such as naive Bayes, Probabilistic neural networks (PNNs), SVM, and KNN have been widely verified on the publicly available video‐triggered EEG‐emotion databases.
5.1.1 Naive Bayes
Naive Bayes is a probabilistic classification model for supervised learning. This algorithm learns the joint probability distribution between features of the training set and labels by assuming that the feature data are independent from each other. Test data are fed into the probability distribution model and then predicted labels are obtained according to posterior probability. The advantages of naive Bayes include its simple algorithm, high computational efficiency, high accuracy, and less sensitivity to missing data [120]. Considering the outstanding performance of naive Bayes on imbalanced data size within categories in small datasets, Koelstra et al. [100] used naive Bayes classifier to train emotion recognition model using DEAP database they established. The recognition accuracies of valence, arousal, and liking were respectively 57.6%, 62.0%, and 55.4%.
5.1.2 Probabilistic neural network
Based on the Bayesian decision‐making rules of Bayesian network, Specht proposed a supervised learning algorithm known as the PNN [121]. PNN is a feedforward network consisting of input layer, pattern layer, summation layer, and output layer with great characteristics of better generalization and fault tolerance for outliers [114]. Using radial basis function kernel as the activation function of pattern layer, PNN is closely equivalent to Bayesian optimal classification. Thus, PNN are often applied to emotion decoding on EEG signals from different modalities [114]. In addition, PNN, simple in structure and fast in training, is very suitable for real‐time emotion recognition [122]. Based on EEG signals from MAHNOB‐HCI, DEAP, and their own emotion database, Nakisa et al. [114] used PNN to verify the effectiveness of evolutionary computation algorithm for EEG feature selection. Zhang et al. [122] compared the performance of PNN and SVM in emotion recognition on the DEAP dataset. Their research results showed that PNN reached a comparable classification accuracy of SVM, but has much simpler network structure and faster training process.
5.1.3 Support vector machine
SVM classifier is less sensitive to outliers and can also achieve considerable performance on small‐sample training sets. With better robustness and generalization, SVM is one of the most efficient and alternative classifiers for emotion recognition [41, 123]. Katsigiannis and Ramzan [22] adopted SVM with radial basis function (RBF) kernel for emotion recognition on data from the DREAMER database, which were collected by wireless and portable EEG recording devices. The classification results of DEAP (with accuracy of 57.6% for valence and accuracy of 62.0% for arousal), MAHNOB‐HCI (with accuracy of 57.0% for valence and accuracy of 52.4% for arousal), and DECAF (a MEG‐based multimodal dataset for decoding user physiological responses to affective multimedia content, with accuracy of 59.0% for valence and accuracy of 62.0% for arousal) databases collected by non‐portable devices were applied for comparison. In conclusion, their results revealed that there was no significant classification difference of EEG signals collected by wireless and portable devices in emotion recognition (with accuracy of 62.5% for valence and accuracy of 62.2% for arousal). To verify the effectiveness of portable EEG recording devices in emotion recognition experiment, this research explored the application prospects of wireless portable devices for emotion recognition and provided supportive guidance for the construction of portable emotion‐based human–computer interface systems.
5.1.4 K‐nearest neighbor
K‐nearest neighbor is a non‐parametric supervised learning classifier, and often used as a baseline method for evaluating the performance of other classifiers. Mohammadi et al. [105] utilized SVM and KNN to build the emotion recognition model using the EEG signals from DEAP database. When k = 3, KNN classifier reached the highest recognition accuracy of 86.75% for valence, and 84.05% for arousal. Similarly, Li et al. [124] applied KNN (k = 3) for valence and arousal classification on DEAP database. Their research result showed that promising recognition result was achieved when using EEG features extracted from Gamma band (with recognition accuracy of 95.70% for valence and 95.69% for arousal). Thus, they inferred that Gamma band may contain more emotion‐related information comparing to other frequency bands of EEG signals.
5.2 Unsupervised learning classifiers
Contrary to supervised learning, no label information is available in unsupervised learning. By adopting clustering or feature analysis methods for unlabeled data, unsupervised learning classifiers detect and learn the underlying connections and regulation among EEG features, and then infer possible category information from these unlabeled EEG features. Thus, it can better adapt to individual differences in cross‐subjects classifier building [125]. Unsupervised learning model is specifically designed for unlabeled data classification, which is of great significance in solving practical problems, such as classification of EEG signals with missing labels, difficulties in obtaining label set, and time‐consuming manual labeling.
5.2.1 Convolutional neural networks
Convolutional neural networks (CNN) is a feedforward network with convolutional layers and deep structure. Excellent in fault tolerance, self‐adaptability, and generalization, CNN can detect the underlying mapping relation between category and raw data and extract class‐related deep features from large numbers of unlabeled raw data. It has been widely used in image recognition and achieved remarkable results. Researchers seldom directly feed multidimensional EEG data into CNN model for emotion classification due to the limitation that EEG signals are spatially discrete and temporally non‐stationary. Hwang et al. [112] innovatively proposed a topology‐preserving DE feature‐based CNN classifier for emotion recognition. The new proposed method was evaluated on SEED database. Firstly, topology-reserving DE images were generated while keeping the spatial information among electrodes. Specifically, Hwang et al. first calculated DE features of each electrode in the Delta, Theta, Alpha, Beta, and Gamma bands from SEED database. Then, Azimuthal Equidistant Projection (AEP) [126] was performed to generate an EEG topology map that represented DE features. Finally, the generated topology map was fed into CNN for emotion recognition to learn the spatial information within multiple electrodes. The EEG topology map generated by AEP can well preserve the spatial information of EEG signals, thus, solving the problem of low spatial resolution and achieving a promising classification on the SEED database. The accuracies for positive, neutral, and negative emotions were 96%, 92%, and 83% respectively.
5.2.2 Graph convolutional neural networks
Graph convolutional neural networks (GCNN) is a deep learning network that combines CNN and spectrogram theory to find the relationship within different nodes from graph signals. GCNN is an effective method to extract features from discrete spatial signals [127, 128], which can be used to explore the spatial connection of multi‐dimensional EEG signals for emotion recognition [118]. Jang et al. [117] utilized GCNN for emotion recognition based on DEAP database. First of all, intra‐band graphs for each electrode were created by calculating the power and entropy of Delta (0–3 Hz), Theta (4–7 Hz), low Alpha (8–10 Hz), high Alpha (10–12 Hz), low Beta (13–16 Hz), middle Beta (17–20 Hz), and high Beta (21–29 Hz) while considering the relationship between electrodes. Then, they merged all intra‐band graphs into a larger graph and fed this larger graph into the GCNN classifier for emotion recognition. Compared with traditional algorithms of KNN (with highest recognition accuracy of 48.5%) and random forest (with highest recognition accuracy of 51.3%), GCNN obtained the higher recognition accuracy of 65.27%.
5.2.3 Dynamical graph convolutional neural networks
To further promote the development of GCNN, Song et al. proposed dynamical graph convolutional neural networks (DGCNN) for multidimensional EEG‐based emotion recognition [118]. On the basics of GCNN, DGCNN dynamically calculate and update adjacency matrix of graph nodes according to the changes of graph signals. Song et al. [118] pointed out that dynamically learning the inner relationship of multi‐electrode EEG signals would efficiently improve the emotion recognition accuracy of EEG signals. Their research results showed that DGCNN achieved better classification performance on DREAMER and SEED databases. Classification accuracies of valence, arousal, and dominance were respectively 86.23%, 84.54%, and 85.02% on DREAMER database. Based on the DE feature of SEED database, classification accuracy of 90.4% was achieved in subject-dependent classification model and the accuracy of 79.95% for subject‐independent validation. Similarly, based on the EEG signals from SEED database, Wang et al. [129] compared DGCNN with SVM (86.08% ± 8.34%), DBN (83.99% ± 9.72%), GCNN (87.40% ± 9.20%). Unsurprisingly, DGCNN achieved better emotion recognition performance in multi‐channels EEG signals with classification accuracy of 90.40% ± 8.49%.
5.3 Semi‐supervised learning classifiers
Semi‐supervised learning is a classifier that combines the benefits of both unsupervised learning and supervised learning. By simultaneously feeding in a small amount of labeled data and large numbers of unlabeled data for model training, semi‐supervised learning classifier can improve the classification accuracy of unlabeled data, and deal with the problem of time-consuming manual data labeling. At the same time, semi‐supervised learning algorithm makes up for the poor generalization of supervised learning classifiers and the low classification accuracy of unsupervised learning classifiers with significant practical applications.
Deep belief networks (DBN) is a probabilistic generation model with deep structure that can be used to extract high related features from EEG, and is one of typical and state‐of‐the‐art semi‐supervised learning classifiers. DBN mainly follows unsupervised pre‐training, unsupervised fine‐tuning, and supervised fine-tuning [38, 130]. Firstly, a deep model with a stacking structure is generated by performing unsupervised greedy layer‐wise pre‐training. Secondly, in the processing of unsupervised fine‐tuning, parameters of n restricted Boltzmann machines (RBM) that make up DBN are updated with backpropagation. The main purpose of unsupervised fine‐tuning is to make the reconstructed visible unit as close as possible to the input visible unit by adjusting the connection weight and bias between each layer. Finally, label information is added to the highest layer and the weights will be updated through error backpropagation to realize supervised fine‐tuning of parameters.
DBN can efficiently combine feature extraction with feature learning to obtain better classification performance and has been widely applied to the research of EEG‐based emotion recognition [120, 131]. Based on SEED database, Zheng et al. [23] established positive, neutral, and negative emotion recognition models using DBN to explore the critical frequency bands and crucial channels for improving the performance of emotion recognition. Their research discovered that Beta and Gamma band might contain more information that better characterized electrophysiological changes of the brain under different emotional states. In comparison with the classification results of SVM (83.99%), logistic regression (82.70%), and KNN (72.60%), DBN with accuracy of 86.08% could effectively recognize positive, neutral, and negative emotion from multi‐channels EEG signals.
6 Summary and outlook
Based on the current video‐triggered EEG‐based emotion recognition databases, this paper mainly summarized EEG‐based emotion recognition methods in recent years. According to the typical processing pipeline, different emotion evoking methods were compared and the details about publicly available databases for video‐triggered EEG‐based emotion recognition were introduced. Moreover, a systematic introduction of EEG features extraction, selection, and modeling methods used in the existing video‐triggered EEG‐emotion public databases was presented.
With the beneficial contributions of these public video‐triggered EEG‐emotion databases, great progresses on emotion recognition using EEG signals have been made in recent years. However, there are still several limitations about the public databases that requires further improvement.
In addition, emotion classification from multi‐modal physiological signals is of guiding significance for proper decoding of physiological responses to emotions. Most of the existing databases used the individual self-assessment as ground truth. However, ratings from self‐assessment have obvious individual differences. Thus, the reliability cannot be guaranteed. Multi‐modal physiological signals (such as ECG, and eye gaze data) can be used as an index to provide more evidences about the evoked emotions. The development of multimodality physiological signals‐based emotion recognition model can improve the classification performance with promising results.
Promoting the development of emotion recognition has great application significance. EEG‐based emotion recognition with videos has attracted wide attentions in many fields including psychology, cognitive science, medicine, and information technology. However, the current video‐triggered EEG‐based emotion recognition only tackles the recognition problem with specified emotion states. However, in real life, human emotion is complex, diverse, and dynamic. To realize the real‐time emotion recognition with an online emotion monitor system, the dynamic changes of emotions from the perspective of neuro-phyiology should be further studied, and the underlying neurophysiological mechanism of emotion regulation should be further explored.
Also, the establishment of robust emotion recognition models is indispensable in affective computing. However, the existing video‐triggered EEG‐based emotion recognition researches are mainly based on supervised learning classifiers. The lack of labeled data and low reliability of self‐assessed labeling seriously affect the classification performance. It is worth noting that unsupervised learning and semi-upervised learning have better self‐adaptation and self‐learning capabilities in dealing with such problems as individual differences, inaccurate label information, and lack of labels.
To sum up, improving and unifying the construction of video‐triggered EEG‐based emotion databases could further promote the development of emotion recognition, which benefits the development of emotion classificaion with a more robust and generalized EEG model. Further, the quality of life and mental health could be greatly improved with the application of real‐time emotion detection and regulation.
Footnotes
Conflict of interests
All contributing authors have no conflict of interests.
Financial supports
This work is funded by the National Natural Science Foundation of China (Grant No. 61906122).