
Abstract
The present work describes the use of noninvasive diffuse optical tomography (DOT) technology to measure hemodynamic changes, providing relevant information which helps to understand the basis of neurophysiology in the human brain. Advantages such as portability, direct measurements of hemoglobin state, temporal resolution, non‐restricted movements as occurs in magnetic resonance imaging (MRI) devices mean that DOT technology can be used in research and clinical fields. In this review we covered the neurophysiology, physical principles underlying optical imaging during tissue‐light interactions, and technology commonly used during the construction of a DOT device including the source‐detector requirements to improve the image quality. DOT provides 3D cerebral activation images due to complex mathematical models which describe the light propagation inside the tissue head. Moreover, we describe briefly the use of Bayesian methods for raw DOT data filtering as an alternative to linear filters widely used in signal processing, avoiding common problems such as the filter selection or a false interpretation of the results which is sometimes due to the interference of background physiological noise with neural activity.
Keywords
1 Introduction
Functional neuroimaging can refer to the study of cerebral function to localize the spatial distribution according to a task or stimulus using technology. Neuroimaging technology provides information which allows an improvement in cerebral function knowledge in a noninvasive manner, unlike invasive methods such as surgical interventions. Additionally, neuroimaging technology can have a potential use in the prognosis and diagnosis of pathologies.
Many research groups have developed and perfected noninvasive neuroimaging techniques to study the human brain "in vivo" [1 –3]. Many years of research has resulted in the development of imaging techniques such as functional magnetic resonance imaging (fMRI), magnetoencephalography (MEG), and encephalography (EEG), which are commonly used in both research and clinical fields.
Functional near infrared spectroscopy (fNIRS) is a technique in which the physical medium is near infrared light. This technique has gained popularity and can be used to build functional human brainimages [4 –6]. fNIRS provides portability, null magnetic interference with ferromagnetic objects or other metals, nonmovement restrictions, high temporal resolution, hemoglobin state (oxyand-deoxy‐hemoglobin) measurements, no ionizing, and low cost compared with other neuroimaging techniques such as fMRI or MEG. With fNIRS technique, it is possible to reconstruct bidimensional [7] or tridimensional functional brain images according to the approach selected. The topographic approach has been widely used to perform cerebral mapping during a task or stimulus [8], in functional connectivity studies [9] or clinical applications [10 –12], and also provides bidimensional images. The tomography approach or diffuse optical tomography (DOT) provides functional cerebral 3D images with the use of complex mathematic and physical theories, improving the image resolution and positional accuracy of optical brain imaging [13].
1.1 Neurovascular coupling
From a neurophysiology point of view, the brain consumes around 20%–25% of the oxygen and glucose consumed by the organism [14]. Neurometabolic regulation must be quick and effective to provide metabolites to the brain through the cerebral blood flow (CBF). CBF is regulated by a local intrinsic mechanism, myogenic and metabolic, allowing a constant flow rate in normal conditions. Cerebral blood vessels interact with the neurons creating a close relationship between them [15]. As a result of this relationship known as neurovascular coupling, there is a CBF increase generated by a neuronal activity increase. In 1890, Roy and Sherrington [16] defined neurovascular coupling as local changes in CBF as a product of localneuronal activity allowing the release of carbon dioxide (product of oxygen metabolism) and excess heat along with the nutrient contribution in a continuous process. This continuous process is held up by the neurovascular coupling and occurs in a short temporal‐spatial scale.
Spatial resolution of the vascular response depends on the tissue vascularization which is to be measured. In other words, a dense capillary network needs a greater spatial resolution than the large blood vessels which are less confined in the brain [17]. Initial studies have tried to separate the larger vessels from capillary signals using the optic density technique [18]. Posterior studies have estimated where the vascular response is localized at a submillimeter level [19], at 1–2 mm [20] or at 3.5 mm [20]. The spatial resolution estimation depends on the technique used and the cerebral region measured.
Temporal resolution of the vascular response shows an initial dip generated by the oxygen metabolism during the neuronal activations. Then, CBF increases around 1–2 s after the initial dip, the maximum peak appears around 2–4 s as a result of vasodilation [21]. These hemodynamic changes are the basis of the neuroimaging techniques to represent functional cerebral activations.
The hemodynamic measurements vary according to the neuroimaging technique used, e.g., blood oxygen level dependence (BOLD) signal has been modeled as a linear function of the CBF response during neuronal activity [22]. First MRI data showed an increase in the BOLD signal during a stimulus, followed by a decrease in the BOLD signal when the stimulus had stopped [23]. This dynamic process was described using optical techniques [24, 25] which also measure oxyhemoglobin (HbO) and deoxyhemoglobin (HbR).
1.2 Absorption and diffusion
Human tissue is a turbid medium which contains an inhomogeneous distribution of particles such as cells or molecules. Photons are scattered or absorbed during the light propagation in the human tissue. Near infrared (NIR) light can be absorbed by natural chromophores such as the hemoglobin states (HbO & HbR) in the cerebral tissue. Light propagation in the tissue is scattered due to inhomogeneities, e.g., the reduced scatter coefficient for the scalp was 7.1 cm−1 while the absorption coefficient was 0.164 cm−1. The scattering coefficient for cerebral cortex was 11.6 cm−1 and the absorption coefficient was 0.170 cm−1, using a wavelength of 780 nm [26].
Despite the photon scattering in the human tissue, optical imaging is governed by the NIR light absorption due to the presence of hemoglobin (HbO & HbR) in the blood system. Each hemoglobin state absorbs NIR light in a range of wavelengths from 690 to 750 nm for the detection of HbR, and from 830 to 850 nm for the detection of HbO. Absorption values and the extinction coefficients [26] for both wavelengths are transformed into changes in the concentration of HbO and HbR by applying the modified Beer‐Lamber law [5].
1.3 Photon behavior in a turbid medium
Given a source and a detector, photon behavior while traveling inside a turbid medium like human tissue [27] (Fig. 1), can be:
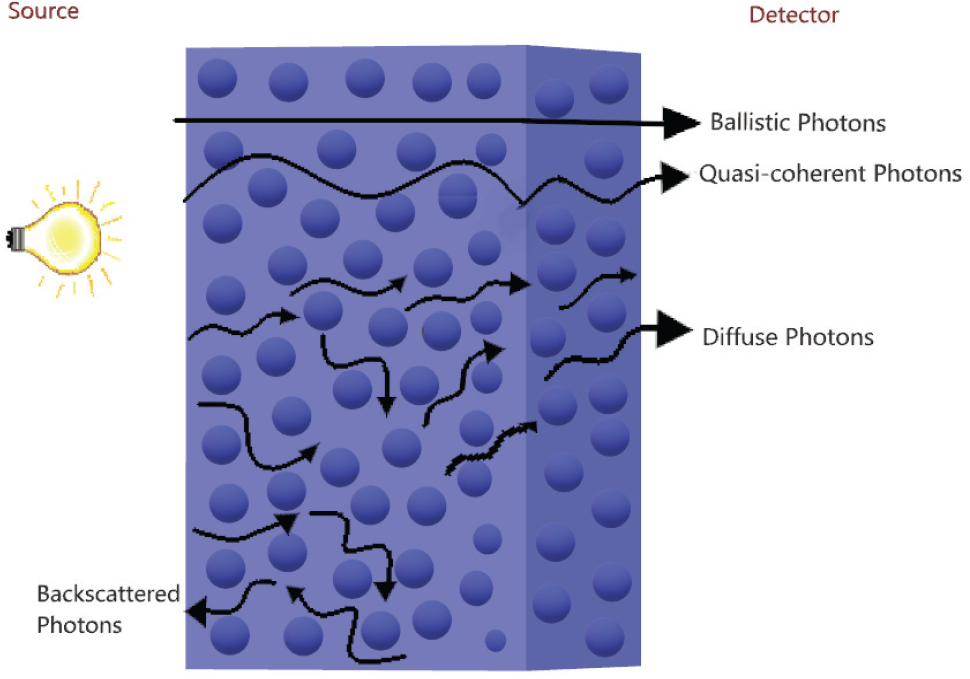
Scheme of the photon behavior in a turbid medium. The ballistic and quasi‐coherent photons reach the detector earliest compared to the diffuse photons, for which the trajectory is changed with respect to the initial direction.
During the light–tissue interaction, both the absorption and scattering processes can be related to the blood system and blood cell volume, respectively in the cerebral tissue. The absorption process may be described as an irradiative process transforming the power energy into thermic energy [28], or as a radiative process emitting fluorescence at longer wavelengths than the absorbed wavelengths [29].
2 Biomedical applications of the NIR light
The first biomedical application of NIR light in human tissue was published in 1977 by Jöbsis [30], showing blood oxygenation measurements using NIR light from approximately 700–1300 nm, known as the optical window, because the NIR light can pass through the tissue to a depth of around 3–4 cm [31]. Due to the presence of natural chromophores in the tissue (HbO & HbR) which absorb NIR light, both are used as cerebral activation markers [32].
NIR light is applied on the subject’s head through LEDs or optical fibers, which are combined as a source–detector pair recording the changes in the optical density generated by changes in the optical properties in each tissue layer of the human head. Photon distribution inside the head from a source–detector pair placed on the head surface follows a concave curve trajectory known as the banana shape [33]. The banana shape gives an approximation of the depth where the optical properties change.
It is possible to measure the optical properties for each tissue layer in the human head, according to the distance between source– detector pairs placed on the head surface. Therefore, at a distance of around 3–4 cm between a source–detector pair, the photons contain information about the optical properties from both intracerebral and extracerebral layers, with the portion of cortical signals to be only around 8%. While at a distance of 1–2 cm between the source–detector pair, the photons contain mostly information from extracerebral layers. Here, we can define the closest separation as “first–nearest neighbors”, and increasing distance as second–third‐, and fourth–nearest neighbors (Fig. 2). Changes in NIR light attenuation between source–detector pairs collocated on the scalp are transformed into HbO and HbR concentration changes by the modified Beer– Lambert law [34].
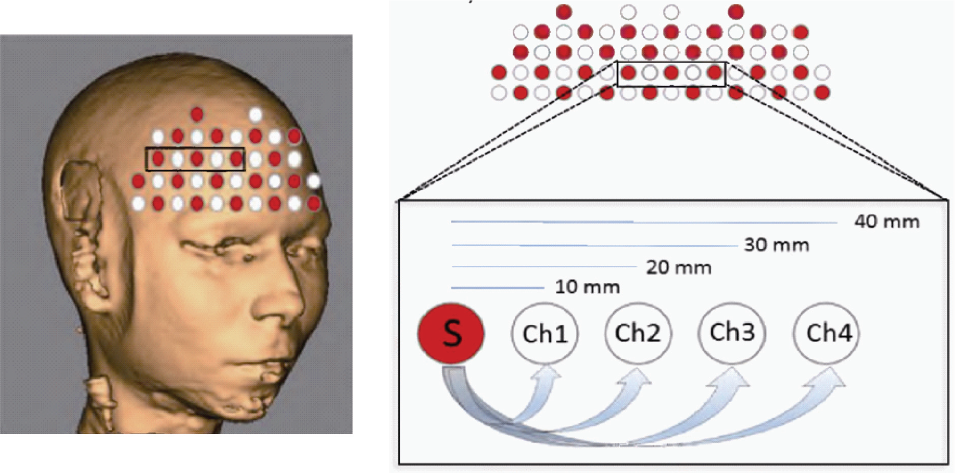
Representation of the optical fibers on the boundary of the frontal cortex in a real space (left). Definition of nearest neighbor measurements (right): The photon trajectory following a banana path (arrows), is detected to a 10–20 mm distance from a source (S) providing information from intracerebral layers. A 30–40 mm distance from a source (S) provides information from extracerebral layers.
From the neuroimaging point of view, the optical imaging technique used to measure the functional cerebral activity provides two modalities described in the bibliography as the topographic and tomographic approaches. Fig. 3 shows the topographic approach using a distance of around 2 cm between source– detector pairs to mainly detect changes in the optical properties at the cerebral cortex level. Optical path lengths are interpolated and represented in a bidimensional cerebral activity image [7]. While the tomography approach provides tridimensional cerebral activity images by the use of multi‐distance approach [35]. The multi‐distance approach uses high density source–detector pairs allowing the recording of a greater quantity of optical path lengths at different depths inside the head to reconstruct high quality 3D images [36].
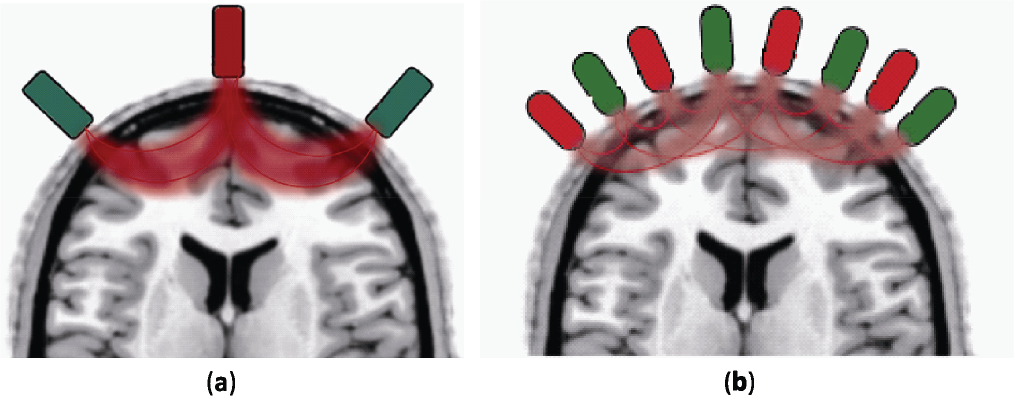
Images depict source (red)–detectors (green) pairs placed on the head surface in: (A) Topography approach at a distance of 2–4 cm between source‐detector pairs. Optical path ways (red lines) contain information of depth regions which are transformed in 2D activity images. (B) Tomography approach using a multi‐distance approach to acquire a high density of the optical path lengths at different depths building 3D activity images.
2.1 Technology used in DOT
The existence of three instruments used in the optical imaging is widely known nowadays and their main characteristics are reviewed below.
Continuous wave (CW) systems source emits light at a constant intensity into the tissue and the transmitted and back scattered light intensities are measured. To prevent environmental interferences, the amplitude can be modulated by a few kHz. The CW system measures the decreases of the detected light intensity compared with the emitted light intensity (Fig. 4). Because the hardware is simple and low cost, CW technology is the most used in neuroimaging research [31]. The following are some commercial CW systems: NIRO‐200NX (Hamamatsu, Japan), ETG‐4000 (Hitachi, Japan), CW4‐6 (TechEn, USA) and DYNOT (NIRx Optical Neuroimaging, USA).
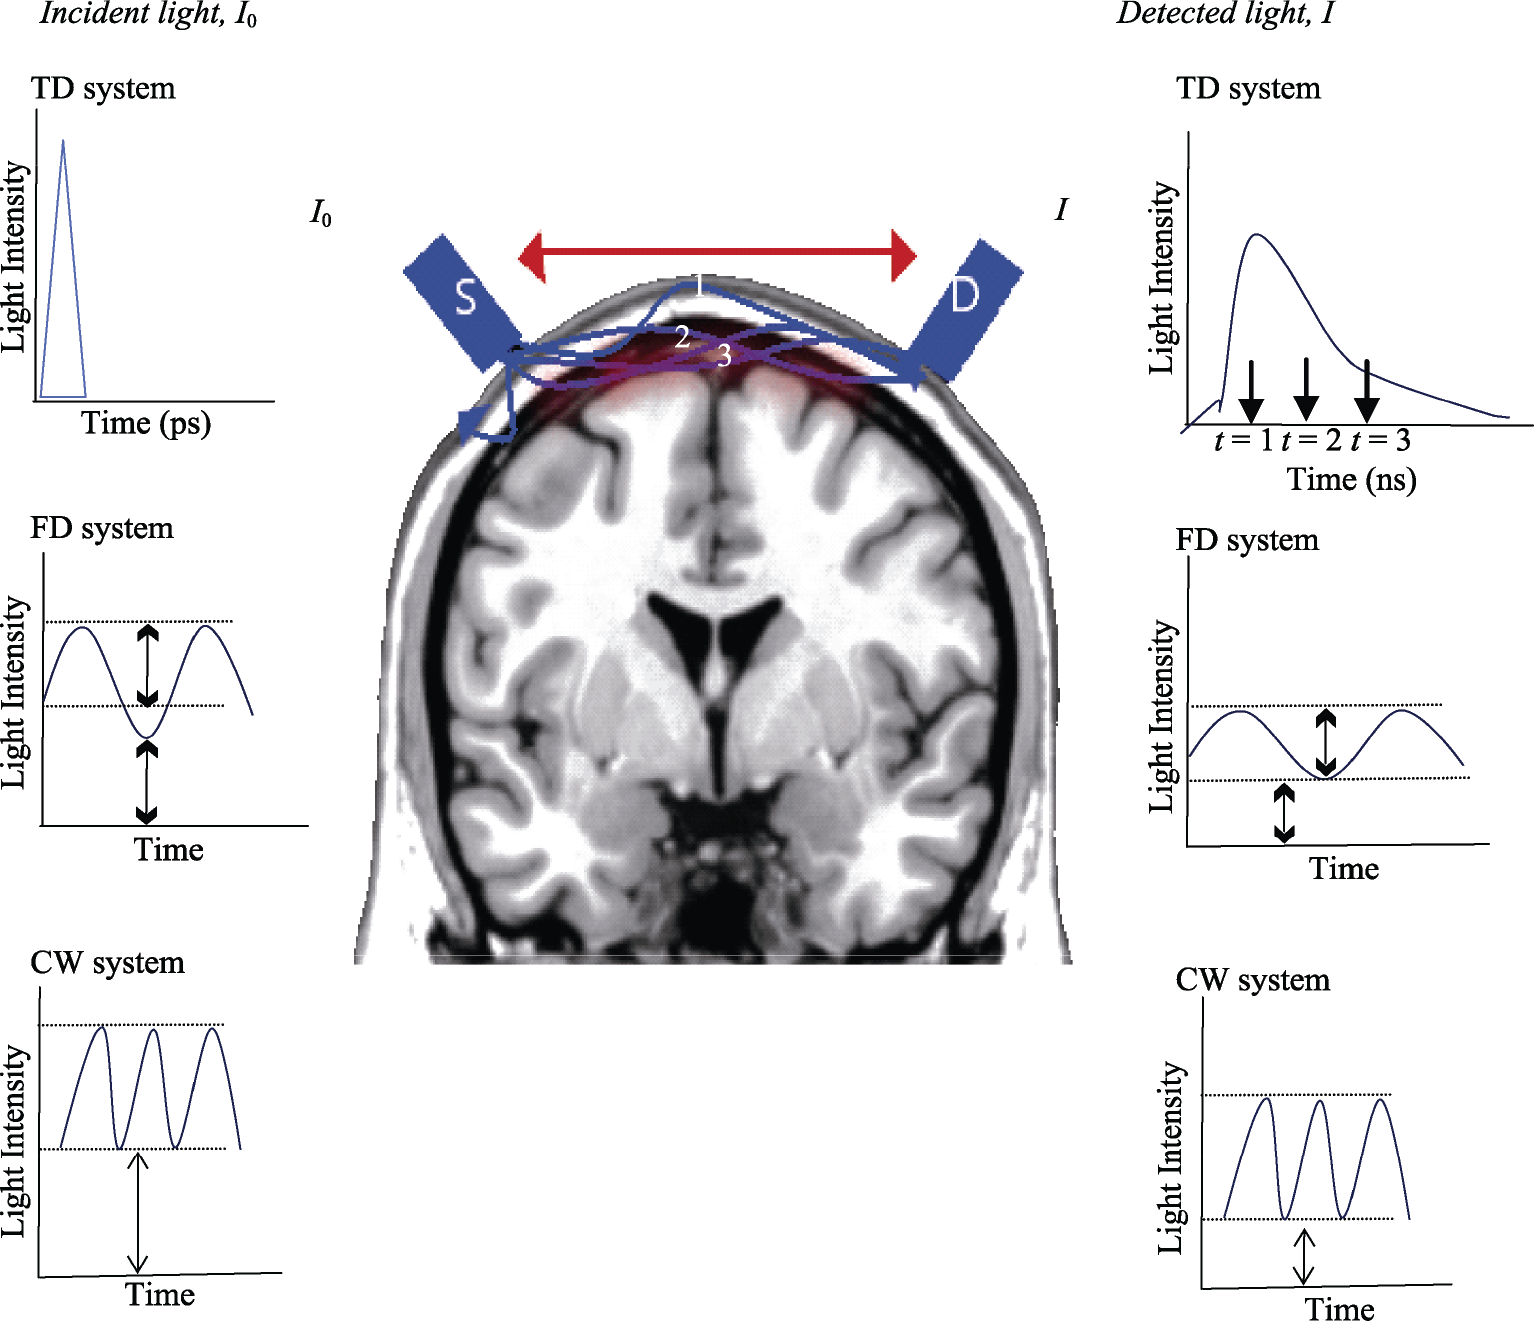
Incident light (I 0 ) is emitted from a source (S) and detected (I) by a detector (D) placed on the head surface at a distance between source–detector pair (red arrow) measuring local hemodynamic changes (brain red area). In the TD system, the photons travel inside the tissue and are detected at different times (t, time of flight: t = 1, t = 2, t = 3) according to the traveled depth inside the head from ultrashort emitted light pulses. In the FD system, the detected light amplitude is less than the incident light, which provides information about hemodynamic changes by its phase shift. In the CW system, the detected light intensity is attenuated with respect to incident light, which provides relative values of concentration changes; however, this system cannot measure the optical pathlength (absolute values). TD, time domain; FD, frequency domain; CW, continuous wave.
Frequency domain (FD) systems emit light sinusoidally with intensity‐modulation at radio frequencies around 100–200 MHz [37]. Changes in the tissue optical properties are obtained by the phase difference between the detected signal and the emitted signal [38] (Fig. 4). FD systems use the same source–detector pair distribution as the CW system and can combine both instruments [39], providing qualitatively similar reconstruction for all source–detector pairs [40]. E.g., OxiplexTS (ISS, USA).
Time domain (TD) systems emit extremely short light pulses (on the order of picoseconds) inside the tissue. While the light pulses are propagated through the tissue, the temporal distribution of the arrival of photons to the detector are represented by the temporal point spread function. The TD system provides information from different depths inside the head according to the arrival time of the photons to the detector. Therefore, photons which arrive in picoseconds contain information from shallow regions, while photons which arrive in nanoseconds provide information from deep regions [38] (Fig. 4). E.g., tNIRS‐1 (Hamamatsu, Japan).
2.1.1 Components of DOT imaging technology
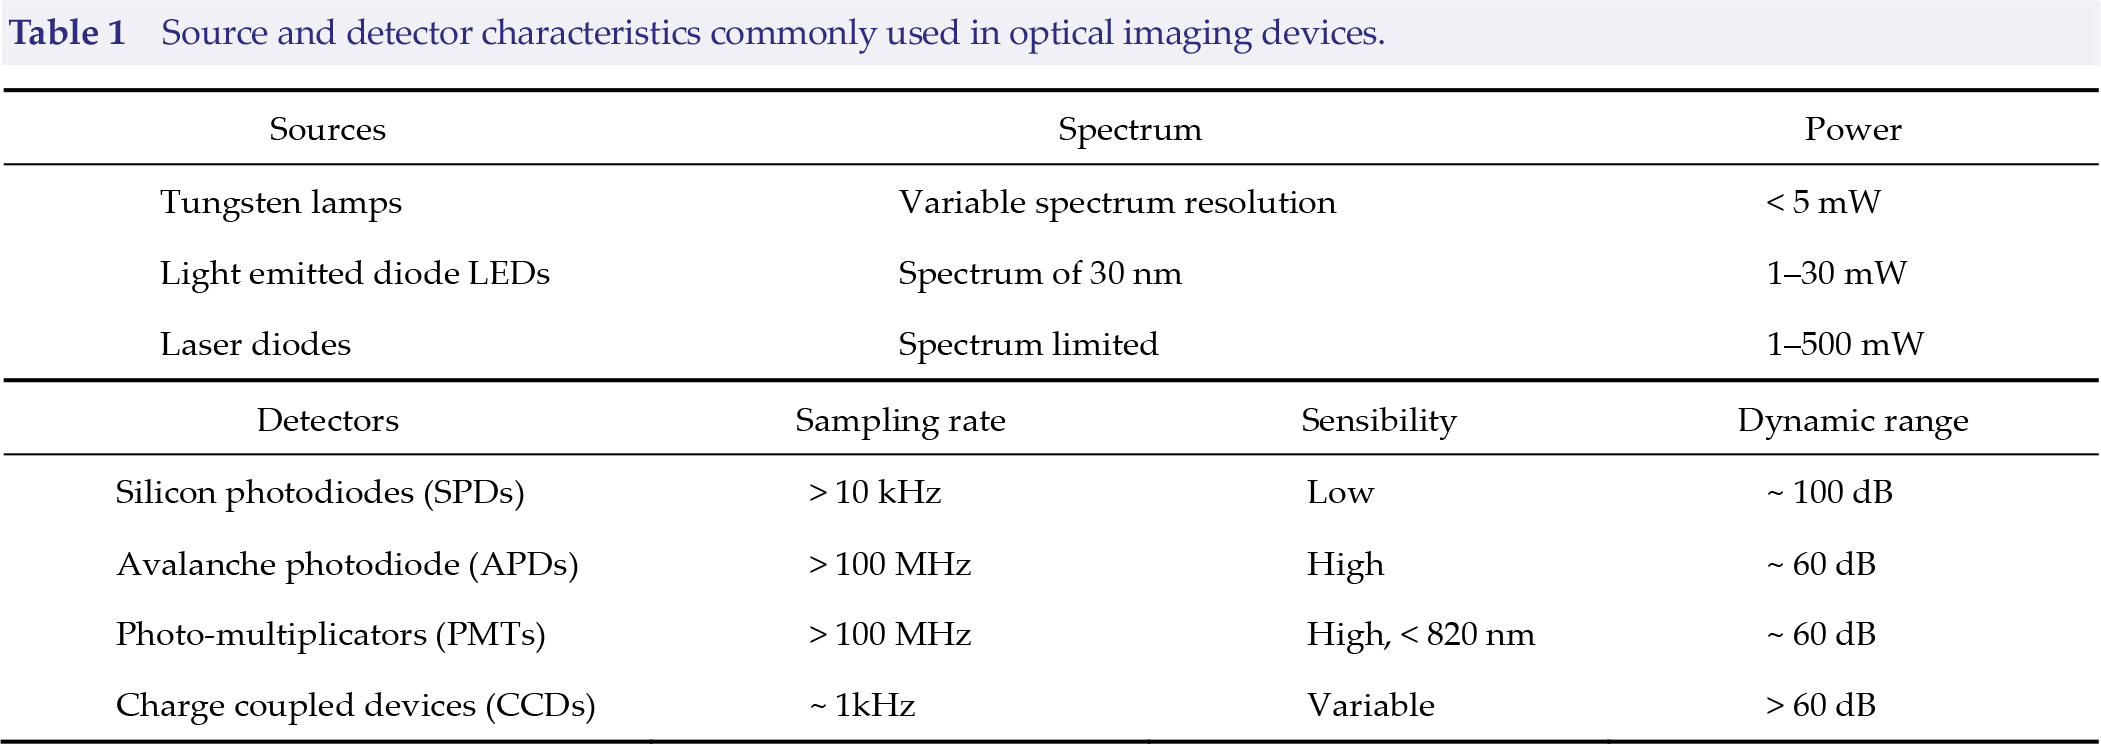
Source and detector characteristics commonly used in optical imaging devices.
2.1.2 Source–detector pair configuration
In optical imaging the matrix containing the source–detector pairs is important because the configuration will affect the quality of reconstructed images, as has been shown in previous studies. A high density of source–detector pairs with ≤ 1 cm distance between them will improve the reconstructed images in resolution and localization spatial means [45]. Moreover, a high density configuration gives a decrease in errors [46], SNR increase [47] and allows the separation of the systemic noise from superficial noise [48].
In optical imaging, the distance between source–detector pairs depends on the task applied and the instrument used. The distance between source–detector pairs can be minimized if a matrix of thin design is applied and providing many measurements of optical pathlengths will lead to more information in depth during the image reconstruction. Furthermore, other factors which improve the reconstructed image quality are: the co‐localization (if sources and detectors are made of optical fiber, they can act as source and detector simultaneously) or the optical fiber–scalp coupling which must be minimum to increase the recorded signal quality. The use of optical fibers required a rigid structure that maintains the optical fiber positions and minimizes torque on the fibers during the experimental session. DOT systems must use rigid structures to hold the fiber weight, e.g., the fibers are suspended above the subject’s chair and organized into a “double‐halo” configuration or using a two layers structure. Recently, a wireless system has been developed to minimize the use of optical fiber and its associated problems [49].
3 Light propagation in the human head
3.1 Forward modeling
The optical field has a discrepancy in the interpretation of the light as a wave or particle. The Maxwell equation assumes the light as electromagnetic radiation, while the Boltzmann equation assumes the light as a particle flow. If the light is interpreted as particles (photons), then it is possible to describe the particles flow inside a volume taking into account the time t, position r and direction
In functional neuroimaging, the goal is to model the changes in the light attenuation y measured from the boundary volume δΩ, generated by changes in the optical properties μ within a volume Ω :

Given a volume, y depicts measurements onto boundary volume, μ optical properties (absorption μ
a and scattering μ
s ) in a position r within Ω .
3.1.1 Light propagation simulation in variable geometry
When the light is emitted from the head surface it needs to cross the extra‐cerebral layers such as the scalp, skull or meninges, before and after reaching the cerebral cortex. Light propagation inside the head is estimated using mathematical models because the head geometry is variable in each subject.
Optical properties are calculated in simulation models which mimic the head geometry. Simulation models are generally formed by epoxy resin and can contain titanium oxide (scattering) and colorants (absorption) to mimic the tissue optical properties. Light propagation has been estimated using homogeneous geometry to test the compensation algorithms [51] or the image reconstruction using FD vs. CW systems [52]. Over time, heterogenous tissue simulating phantoms based on three or four layers which contain homogeneous medium for each layer have been designed. These heterogeneous tissue simulating phantoms mimic the head layers such as the scalp, skull, cerebrospinal fluid and gray and white matter [53].
However, heterogeneous tissue simulating phantoms do not follow the curvature of the human head [45]. To solve this, semi‐sphere models were created whose surface is adjusted to the head contour holding the heterogenous medium to mimic the tissue layers of the human head [54].
3.1.2 Mathematical model
The mathematic model which describes the light propagation and is used in the DOT technique is the RTE and its simplification, the diffusion approximation (DA). Before the description of the mathematical model it is necessary to define the energy radiance R (r, t,

where θ is the angle that the unit direction vector
RTE describes the energy changes R(r, t,
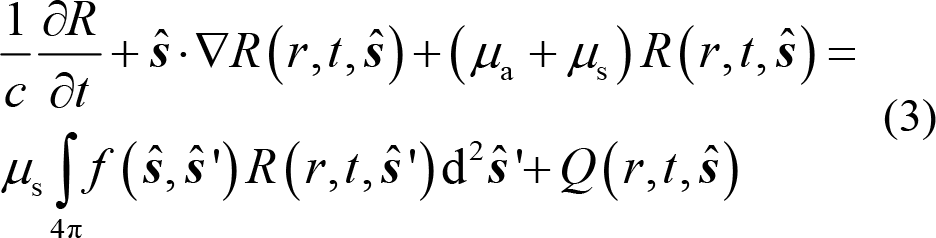
where changes in the energy R (r, t,
Solving RTE requires long computational time and large storage capacities [57]. Therefore, the light propagation in a turbid medium can be described under general assumptions [58]. RTE can be simplified using its first spherical harmonics, P1 approximation to arrive at the diffusion approximation equation (DA):
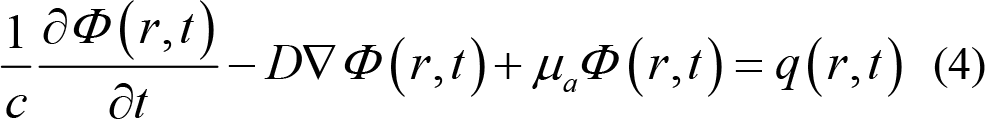
where Φ (r,t) is the photon density in time t and position r , q(r,t) is an isotropic source, absorption coefficient μ a , c is the speed of the light in the medium, D is the diffusion coefficient.
The CW system can only measure one parameter (absorption changes) to model the optical properties, unlike the TD and FD systems which can measure both scattering and absorption in the tissue.
3.1.3 Forward modeling solution
Forward model solutions as defined in the bibliography are analytical, stochastic and deterministic modeling.
Analytical modeling, also called Green’s function, can be used as a numerical model as well as to solve partial differential equations such as the DA in both time and frequency domains involving a source condition: if the source is a Dirac delta function, the Green’s function has the approximated solution. The pulsed laser source systems (TD systems) provide enough approximation to the source can be computed using convolution methods [59]. Green’s function has been used to solve DA in both homogeneous and simple geometries [60].
Stochastic modeling provides a statistic model of the photon behavior inside a heterogeneous medium and irregularly shaped geometries. The most commonly used technique is Monte Carlo modeling, which estimates the light trajectory using a model of minimum variance and increasing the estimation confidence. Basically, the model consists of photon injection into the medium, whose trajectory is modeled until it leaves the medium or is absorbed. The process is repeated many times to obtain a probability density function which estimates the photon trajectory. The method allows light propagation modeling in complex geometries [59] to acquire significant statistics and provide information on the light propagation depending on photon– medium interactions. Stochastic methods have recently been improved for light propagation modeling onto planar multi‐layered tissue [61] or onto arbitrary boundaries [62]. Another less used stochastic method to estimate the light propagation in a turbid medium is the random walk theory [59].
Deterministic modeling is widely used to solve the DA equation, and involves describing the equation in a finite matrix which can then be solved using matrix algebra [63]. The finite element model (FEM) discretizes the continuous domain into a finite number of elements based on basis functions. FEM requires the mesh generation formed by tetrahedral elements connected between one another by nodes without overlapping. During the light propagation modeling an important aspect is the anatomy model which adds more accuracy to the spatial distribution of the optical properties [64]. Also, the change in the optical properties inside the medium impacts the boundary measurements. Therefore, the light propagation modeling in the anatomy model impacts the reconstructed image quality. Anatomy images from MRI are used for light propagation modeling at the layer level. Previously, anatomy images are segmented in layers (scalp, skull, cerebrospinal fluid, gray and white matter) and a mesh is then created by each layer, improving anatomical details at a submillimeter scale. In a 3D volume such as an anatomy image, the first step is to create the boundary mesh using triangular elements covering and closing the volume surface. After which, the volume is filled with tetrahedral elements. There are packages available to create FEM such as NIRFAST, TOAST++, Mimic or Simpleware.
Light propagation modeling in human brain functional imaging is computationally expensive due to the iteration algorithms, which impedes practical and clinical applications. Recently, researchers have focused on reducing the computation time during the forward modeling calculation. For example, Green’s function approximation within cylindric geometry will allow a fast simulation of light propagation and accelerate the image reconstruction process [65]
3.2 Inverse problem
During the image reconstruction from a turbid medium, the relationship between photon density (or light intensities) Φ and optical properties μ is nonlinear. In DOT measurements, changes in the light intensity ΔΦ generated by changes in the inner optical property Δ μ can be assumed as relatively differential changes, therefore the problem can be considered as linear [74].
Two methods have been widely described in the bibliography to solve the inverse problem, the Levenberg–Marquardt (LM) method [75] and the perturbation method [76] allowing the construction of the changes in the optical properties according to the measured light intensities on the surface.
3.3 Tikhonov regularization
The Jacobian matrix represents the sensitivity of measured light intensity on the head surface with the underlying optical properties. During image reconstruction, the Jacobian matrix is directly inverted as it is ill‐conditioned and ill‐posed.
In DOT measurements, it is assumed that: the distribution of the optical properties inside a volume can be explained from measurements on the surface and, as the depth from the surface increases, NIR light is attenuated leading to a disperse matrix whose values are close to zero. As a result, the number of measurements on the surface is less than the number of FEM nodes. Therefore, the Tikhonov parameters are used to extract more information about the optical properties from an inverse matrix:
Let
A widely used method to invert the Jacobian matrix is the singular value decomposition (SVD) algorithm. SVD decomposes
4 Filtering methods
The DOT devices mentioned above measure hemodynamic changes correlated with neural activity. Hemodynamic changes are caused by dynamics in blood volume, blood flow, and blood oxygenation. Certain physiological signals such as heart rate or ventilation rate are involved in systemic blood oxygen and cerebral hemodynamics which influence the scalp layer [78]. These physiological signals create background physiological noise during functional DOT neuroimaging experiments which is stronger than those in anatomical regions and is mixed with absorbed signals from the cortex, thereby generating short‐term variability involving spatial and temporal changes throughout the brain and scalp [79]. Some researchers have devised methods to separate out the background physiological noise of the signals generated by neural activation. The most common methods are linear filtering of the signal, such as the application of band pass filter [40, 80, 81], low [82] or high pass filter [83]. Other less used methods are Kalman filter [81, 83], adaptive filter [84], principal component analysis [85] or envelope [86] depending on the tasks or study area. A problem during the processing of DOT data which generally occurs during signal filtering is that the judgment of the researcher may lead to an error in the cutoff frequencies selected. The application of the Bayesian algorithm as a filter method on the raw DOT data could allow an independent procedure, without the influence of the researcher, paradigm or cerebral area for study, which is more accurate than the linear methods. Most sophisticated methods for filtering DOT data are based on simulated functional response modeling [87, 88], instead of physiological data modeling mixed with the neural response. Background physiological activity such as the cardiac cycle and respiration can be modeled and removed from raw data as has been done in fMRI data [89 –91], and can be briefly explained as:
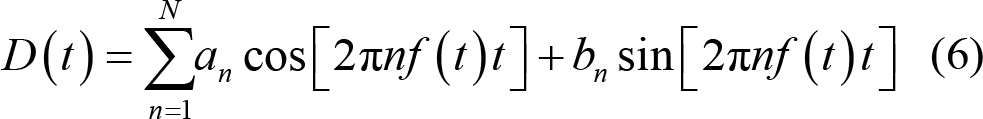
Assuming that there is a reference sensor to measure the cardiac cycle and respiratory rate, both signals can be modeled as a quasi‐periodic signal which can be expressed as expanded Fourier series:
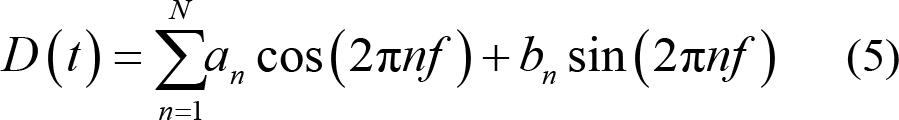
where n refers to the physiological signals in terms of the frequency or the phase in time t. If the physiological signal is considered in phase φ (t) = 2π (t − t 1 ) / (t 2 − t 1 ) , then a and b coefficients are not considered time‐varying providing a constant amplitude. If the physiological signal is considered in frequency, it acts as a function of time:
Two studies have showed the reliability of Bayesian‐filtering on raw DOT data, one based on hemodynamic response measurement during a cognitive task [72], and another during repetitive transcranial magnetic stimulation [92]
5 Applications in functional brain imaging
DOT has been used in a wide variety of applications in neuroimaging studies to measure functional changes associated to a visual, motor, somatosensory or cognitive stimulus or paradigm compared with fMRI measurements to validate the DOT system. The most common paradigms used to validate the DOT technology are based on somatosensory and/or motor [93, 94] and visual stimulus or paradigms [95, 96], unlike cognitive or language paradigms whose complexity makes comparison with fMRI difficult.
The most commonly used somatosensory or motor tasks are based on finger tapping or tactile stimulation [93, 94] in neuroimaging studies, because the cerebral activation amplitudes are higher than in other paradigms such as cognitive paradigms. Additionally, the cerebral activation spatial distributions are known and are reproducible
Cognitive paradigms are less used in DOT validation studies, due to the fact that cerebral activations are subtler than other tasks such as visual or motor tasks. In other words, the cerebral activation amplitudes generated during a cognitive task are less than the cerebral activation amplitudes produced by visual or motor tasks. Moreover, the cerebral activations are localized in the frontal lobule where scalp–brain distances vary between subjects and the cerebral activations are difficult to reproduce because they vary between subjects. Despite the complexity, DOT technology has been used for measuring hemodynamic changes during a cognitive paradigm based on an arithmetic task [72] and during risk‐decision‐making response based on Balloon Analogue Risk Task (BART) paradigm during which the participants could decide if they would like to keep playing the risk task or only observe while performing the task without making any decisions [97]. As occurs with the language paradigms which cover the parietal, temporal and frontal cortex making DOT measurements difficult due to the optical fibers and FEMs, if they are used for light propagation inside the head, they generally cover one cerebral lobule or region of the head. This limitation is produced by the computational time spent during the light propagation modelling in the whole head. Even with this limitation, DOT technology has been validated during a language paradigm execution [44].
As DOT technology is still being used in research, the use of optical imaging in clinical application is less, unlike topography mode which is widely used in the diagnosis and prognosis of disease [98]. However, there are articles reporting the use of DOT technology to monitor hemodynamic changes in neonate brain injury [99 –101]. Advantages, such as non‐movement restrictions, portability, direct measurements of HbO, HbR and HbT, make the DOT system an alternative to fMRI in populations such as children [81] or the elderly which have different optical pathlengths than in young brains [102]. The use of DOT technology in a clinical environment will open new ways of studying awake patients, mainly in movement diseases such as Parkinson’s or dystonia in children or could be used as a monitoring system during deep brain stimulation studies.
6 Conclusion
The present review describes the physical principles underlying neuroimaging optical technologies emphasizing the mathematical model commonly applied in light propagation modeling inside a turbid medium such as human tissue. Moreover, it is noteworthy that the filtering method based on Bayesian algorithms is little used in the DOT data signal processing, showing the differences between both raw DOT data Bayesian‐filtering method and raw DOT data linear‐filtering method widely applied in the treatment of optical signals. Noninvasive DOT imaging provides complimentary information to other modalities such as fMRI, however the BOLD signal hemoglobin components are still unclear, unlike DOT technology that measures hemoglobin states individually. Furthermore, DOT provides a low‐cost alternative to serve populations often unable to receive MRI or PET scans such as young infants or the critically ill, although one notable limitation is that NIR light penetrates 3–4 cm only reaching the cerebral cortex level.
Footnotes
Conflict of interests
The authors declared that they have no conflict of interests.