
Abstract
Xeric sites with scleromorphic vegetation appear to have higher gall-inducing arthropod richness as revealed in studies of local faunas across the world, and the harsh environment hypothesis (HEH) was proposed to explain this. However, plant richness also seems to influence galling arthropod richness positively, which appears paradoxical on a biogeographical scale. To test the HEH in southern Brazil, a sampling regime distinct from the usual local survey was adopted: eight transects were sampled during 90 min counting all galls; this was repeated three times over one year for the same transects. Xeric espinilho savannah (five transects) and mesic Uruguay River riparian forests (three transects) in subtropical Brazil were compared. Fifty-nine gall morphotypes on 15 host families were recognized out of 12,355 individual galls. Riparian forests were richer (individual-based rarefaction) and had higher gall equitabilities (boot-strapped 95% CIs); this contradicted the HEH. The plant richness hypothesis was generally supported because forests were recorded as richer in both plants and host plants. Vegetation types had different galling and host plant composi-tions; the latter may drive the former. Species pools appear distinct among environments, even adjacent ones, given the low similarities found. This further negates the ecological process of preference for xeric sites proposed in the HEH.
Introduction
Studies on the biodiversity of arthropod gall-makers have increased in numbers in later years, with work in many geographical regions and with different approaches to measure diversity (Wright and Samways 1996, 1998; Price
The hygrothermal stress or harsh environment hypothesis considers that xeric sites harbour higher local gall-inducing insect richness than mesic sites because of a combination of abiotic stress such as a dry climate would benefit endophytophages such as gallers, decrease predators and parasitoid attack (Fernandes and Price 1992) and the suite of morphological and physiological characters shown by scleromorphic plants in these sites, such as resistant and long-lived leaves, low levels of plant defence investment. The plant richness hypothesis explains differences in gall-inducing taxa diversity among sites by arguing that the more plant species are in a site, the higher the number of gall-inducing species can be. Some sources give credit to this view (Wright and Samways 1996, 1998; Veldtman and McGeoch 2003; Gonçalves-Alvim and Fernandes 2001a; Dalbem and Mendonça 2006), while the pattern seen by Price
Comprehensive hypotheses on the origin of arthropod galler species diversity, especially including speciation and extinction processes, must depend on a series of assumptions about population and community ecology of such gallers, along with explicit treatments of the spatial scales considered (Mendonça 2001). Thus, a hierarchical view of hypotheses for species richness, with evolutionary explanations initiating at behavioural and population levels up to community factors is needed, along with more detailed information on diversity at local, regional and global scales; this is a recently adopted framework to attempt producing a general theory for biodiversity (Hubbell 2001). Localized small-scale biodiversity surveys will rarely be able to test wide-scale hypotheses; however, insights can be gained for general patterns.
Gall-inducing arthropod diversity was evaluated for two contrasting vegetation types, the xeric espinilho savannah and the adjacent mesic riparian forests of the western portion of the state of Rio Grande do Sul, southern Brazil, within a Conservation Unit (Espinilho State Park). Diversity was evaluated through different variables and with two distinct analytical approaches: comparing individual samples and pooling samples for sites. The expectation under the harsh environment hypothesis is that species richness would be higher in xeric than in mesic sites; abundance was also expected to be higher in xeric sites, accompanying species richness, although data on this aspect has been rarely gathered in the literature; perhaps the only example in this case being Fernandes and Price (1992), but only considering species found on both environments. Gall identification by morphotyping allows analysis of beta diversity patterns among vegetation types, an essential aspect for the understanding of galling species richness that only recently has been given attention (Gonçalves-Alvim and Fernandes 2001b; Dalbem and Mendonça 2006).
Materials and Methods
Study area
The Espinilho State Park is located on the westernmost part of Rio Grande do Sul state in southern Brazil (30°13'S 51°13′W) and was established to protect the rare espinilho savannah vegetation at the only spot it occurs in Brazilian territory (SEMA 2002). The Park used to be smaller than today and only recently (2002) the area of the Park has been increased to its current 1617 ha. Under the ecoregion classification of WWF Conservation Science (Olson
Riparian forests run alongside most of the medium to large-sized rivers in this region, although most brooks have been deprived of them by human influence. The vegetation is semi-deciduous; canopies rarely reach higher than 10 m. These forests are richer in plant species than the savannah and some of the most common thorny shrub species in the latter formation also occur in the riparian forests (Galvani and Baptista 2003).
Sampling
Representative sampling sites of the two vegetation types were chosen (espinilho savannah: 30°11′16″S, 57°27′07″W; 30°12′07″S, 57°29′41″W; 30°03′50″S, 57°23′ 02"W; 30°11′06″S, 57°29′54″W; 30°11′50″S, 57°29′42″W; riparian forest, 30°10′14″S, 57°33′14″W; 30°11′03″S, 57° 35′41″W; 30°11′07″S, 57°35′47″W). However, logistic reasons prevented reaching an ideal sampling balance: there were three sites for forests and five sites for espinilho. The same sites were visited three times along a year covering all seasons but winter, but three of the five espinilho sites had only two visits.
Sampling consisted of transecting through the sites for 1h 30min searching the vegetation for galls (as used by Dalbem and Mendonça 2006). All galls found in the field were attributed to provisional morphotypes and counted; a few galls from each morphotype were collected and brought to the laboratory. Sampling was always carried out by the author, so sampling experience was not an issue. Because the vegetation types sampled here were not very tall (see above), the question of galls up in the canopy being missed during sampling is minimised. Collected galls were used to confirm morphotyping, being photographed and described in terms of external and internal morphology, considering aspects such as organ attacked, gall and chamber size, shape, colour, and other characteristics, and occupants. Gallers were identified to family level, however many gall types were found unoccupied and thus taxonomic identification was impossible, although undoubtedly such galls were caused by arthropods. Host plants were identified to the lowest level possible as well, however, the lack of comprehensive plant surveys and botanical specialists in the region means identification is difficult and tentative. Plants, galls and its occupants are kept in the reference insect collection of the Federal University of Rio Grande do Sul, Porto Alegre, RS, Brazil.
Analysis
Vegetation types were compared for galling diversity using two methods: samples (visits) as units and transects (samples pooled) as units. Diversity with sample as unit was analysed through a MANOVA (calculated with SPSS 13.0) with field trip order (first, second or third sample on a site) and vegetation type as factors, with gall species density (sensu Gotelli and Colwell 2001), overall gall abundance and equitability as variables.
Site diversity comparison was hampered by the differing sampling efforts among sites (some with two and some with three visits). To provide an illustration of the regional species density, data from each vegetation irrespective of site and sampling date was pooled with sample-based rarefaction (using EstimateS 8.0, Colwell 2005). Species richness between vegetation types was compared with an individual-based rarefaction with all samples and sites pooled for each vegetation type; bootstrap-generated confidence intervals for equitability were compared (both performed by PASt 1.86, Hammer
Beta diversity patterns were illustrated for each vegetation type with non-metric multidimensional scaling analysis (nMDS), a preferred form of ordination for best showing in few dimensions the relationships among sites in species composition studies (Legendre and Legendre 1998). Simpson and Morisita similarity indexes were used (also performed by PASt 1.86) for both individual samples and pooled samples for each site. The Simpson index is recommended among presence/absence indexes (Koleff
Results
After 21 samples (31.5 h of sampling) on eight sites, 59 gall morphotypes were found out of 12355 galls counted. On average, there were 10.5 (±0.51 SE) gall morphotypes per sample, of 588.3 galls counted per sample (±145.70 SE). One morphospecies was dominant, with 5,820 galls: this is an unknown small Eryophidae gall on the leaflets of
Fifty-three of the host plants were identified to family level resulting in 23 host plant species. Fifteen plant families were found galled (Anacardiaceae, Asteraceae, Bignoniaceae, Euphorbiaceae, Fabaceae, Flacourtiaceae, Malvaceae, Mimosaceae, Myrtaceae, Rhamnaceae, Rubiaceae, Sapindaceae, Smilacaceae, Tiliaceae, and Verbenaceae). Only 24 of the gallers were identified to order level, most belonging to the Diptera (eight spp., six of these are Cecidomyiidae), followed by Hemiptera, Acari, Hymenoptera (two being Cynipidae, an infrequent group for the Neotropics), Lepidoptera and a single Coleoptera (Curculionidae).
There were no differences between the two vegetation types (MANOVA, Pillai's Trace=0.162, F3,13=0.835, P= 0.498), for any of the variables: abundance, species richness and equitability. Sampling order was non-significant either (Pillai's Trace=0.415, F6,28=1.223, P=0.324), indicating no effect of sampler experience: the repeated visits to the sites did not lead to detection of more galls or gall types as time went by. However, pooling samples reveals a different picture. Sample-based rarefaction shows mesic riparian forests having significantly more species (Fig. 1A) than xeric espinilho savannah, and a steeper accumulation curve as well. The individual-based rarefaction confirms a significantly higher species richness for forests than savanna (Fig. 1B), and the bootstrap shows forests to have significantly higher equitabilities for gallers than savanna (Fig. 1C).
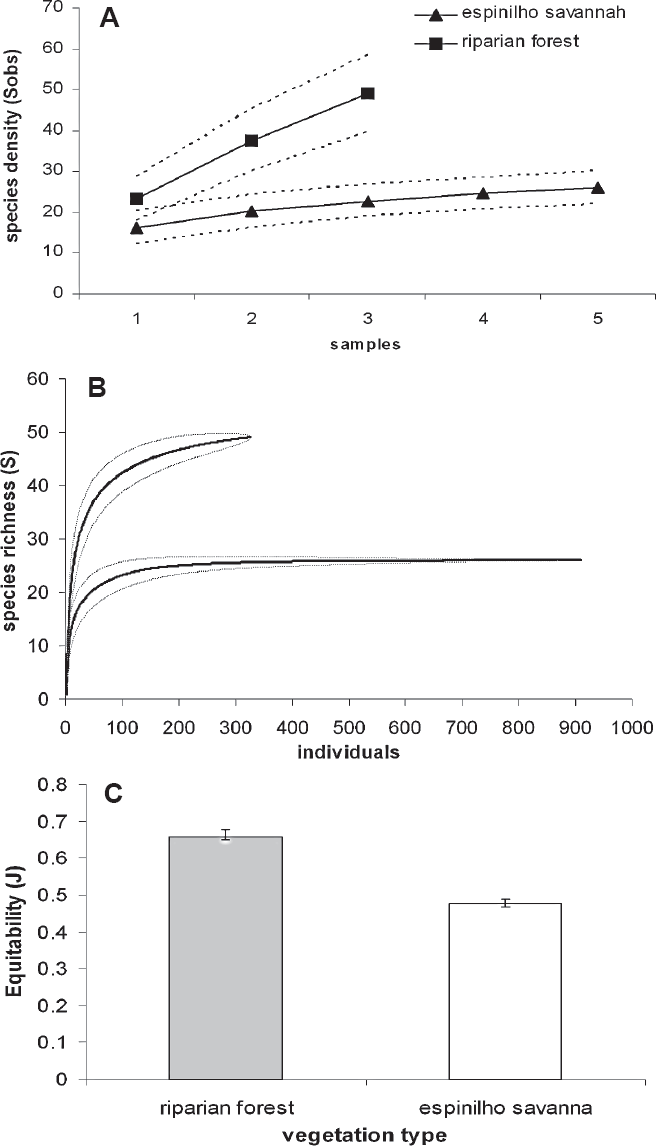
Galler diversity comparing adjacent vegetation types: A) sample-based rarefaction curve (calculated with EstimateS 8.0, Colwell 2001) for observed species density (Sobs) in riparian forest (open squares) and espinilho savannah (closed squares) vegetation types; B) individual-based rarefaction, riparian forest is the curve above and espinilho savannah the curve below; C) community equitability (Pielou's J) for riparian forests (grey bar) and espinilho savannah (open bar). Dotted lines (in A and B, analytical solution) and error bars (in C, obtained by bootstrapping) are 95% confidence intervals.
Of the 59 galling morphospecies, only 16 were common to the two vegetation types, 33 were exclusive to the forest and 10 to the savanna. The qualitative comparison of species composition (Simpson index) shows two separate clouds for the vegetation types but two riparian forest samples close to the savannah cloud (Fig. 2A). When a quantitative index is used (Morisita), the result is analogous but now the two clouds slightly overlap each other (Fig. 2B). With samples pooled for each site, both indexes show quite separate clouds (Fig. 2C, D), with espinilho sites quite close together. The ANOSIM tests confirm the above picture of vegetation type as the important factor segregating sites in terms of species composition to be statistically significant (Table 1) for both individual and pooled samples, for both qualitative and quantitative indexes.
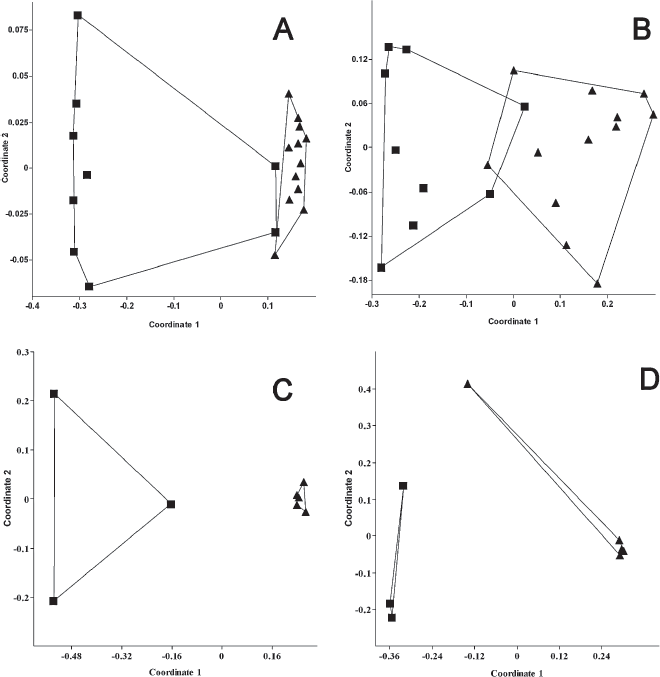
Non-metric multidimensional scaling analysis for galling arthropod species composition among sampling sites in different vegetation types (riparian forest: triangles; espinilho savannah: squares): A individual samples for each site, qualitative similarity index (Simpson); B individual samples for each site, quantitative similarity index (Morisita); C samples pooled for each site, qualitative similarity index (Simpson); D samples pooled for each site, quantitative similarity index (Morisita). Polygons are convex hulls drawn through outermost points of a group.
ANOSIM test results for galling arthropod species composition and host plant family and species composition differences between riparian forest and espinilho savannah vegetation types (with either individual samples or pooled samples, for details see text) for two similarity indexes, Simpson (S, qualitative) and Morisita (M, quantitative). Calculations done with PASt software v. 1.86 (Hammer et al. 2001).
Of the 15 host plant families, only eight appeared on the savanna, whilst all appeared in the forests. Considering host species, 22 were found in the forest and only 11 in the savanna. Host plant family and host plant species composition with samples pooled for each site returns the same picture as for the gallers above, with visible (Fig. 3) and significant differences between the two types of vegetation (Table 1). The analyses at the sample level (no pooled samples) were very similar in pattern and values and are thus not shown, there were clear differences between vegetation types, although not between sites, as happened for gallers. The Mantel tests revealed a high correlation between site similarity for galling species and for host plant families (R2= 0.654; P=0.008) and a very high correlation for galling species and for host plant species (R2=0.969; P<0.001), as expected.
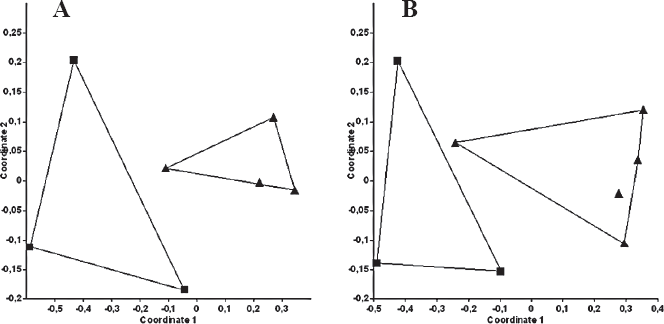
Non-metric multidimensional scaling analysis for host plant family composition among sampling sites in different vegetation types (riparian forest: triangles; espinilho savannah: squares): A) qualitative similarity index (Simpson); B) quantitative similarity index (Morisita).
Discussion
Most information on arthropod galler diversity come from species richness gathered from local samples, even for different research groups, for example Fernandes and Price (1991), Yukawa
Although for samples considered as units no differences were detected for either arthropod galler species richness, overall abundance or community equitability between two contrasting adjacent vegetation formations, the pooling methods showed these differences to exist. The mesic riparian forest has more species of arthropod gallers and equitabilities were higher for these galler communities than for adjacent xeric espinilho savannah. The latter can be attributed to the strong dominance exerted by the Eryophid species in espinilho, an unreported pattern perhaps common to xeric vegetation types. Data on overall abundance and relative abundance among species (equitability) are rare in the gall-inducer literature, and this paper probably constitutes the first analytical comparison of these variables in diversity studies.
Under the hygrothermal stress hypothesis (Price
The remaining question is the generality of this pattern for arthropod gallers, an apparent paradox raised by Mendonça (2001) in which xeric sites could have more species "locally" but not "regionally". This led Espírito-Santo and Fernandes (2007) to predict that tropical forests would probably have in a large scale more species of gallers than savannas or equivalent xeric tropical vegetation formations, although on a very local scale the latter are richer. This equates to saying that alpha diversity is high but beta diversity is low for xeric sites compared to mesic environments. There are increasing amounts of data on mostly mesic tropical systems showing beta diversity to be lower than expected for insect herbivores (e.g. Novotny
The results for host plants indicate that plant richness is also a component of the pattern found. Although no standardised plant survey was employed to demonstrate differences in plant richness on the sampled sites, there are large differences in family and species richness of host plants between vegetation types. The literature also indicates riparian forests to be richer (Galvani and Baptista 2003), but no standardised methods were used in this case either. These data seem to support the plant richness hypothesis in this case.
Gall morphotyping across sites requires a more intense sampling effort, but it also allows analysis of beta diversity, that is, comparisons of the species composition of the sites and vegetation types besides species richness. The analysis of similarity showed species composition to significantly differ between vegetation types at the two scales used here, with sites in the espinilho savannah quite similar among themselves. This may seem obvious given that there are always differences in plant composition among vegetation types, as detected in the Mantel test. Compositional differences between vegetation types can be interpreted either as differences in galls or in host plants, but nevertheless they demonstrate that the differences detected for galling species richness are not due to differential environment preference, as suggested by Fernandes and Price (1988). These authors demonstrated that in six insect gall-inducing species most perform better on hygrothermical stressed plants, and thus they suggested female preference for xeric sites as one possible mechanism to explain the higher richness of gallers on xeric sites. However, in the case presented here the difference in galler species composition between the two vegetation types contradicts the idea of a single galler species pool with most species having a preference for xeric sites, that is, an ecological process as chance or directional dispersal may not be involved.
Developing a spatially and temporally multi-scale perspective on arthropod galler species richness and other diversity variables such as overall community abundance and equitability is perhaps a necessary step in the direction of a better understanding of the ecological patterns of these organisms. Since complete taxonomic identification would be too cumbersome for wide scale work, especially in the Neotropics, using at least explicitly defined morphospecies at all scales would also allow a deeper exploration of beta diversity patterns, largely unknown. Analyses at larger spatial scales than those used here may also help to define which processes may be responsible for these patterns, generating more insights into speciation and colonisation/extinction dynamics.
Footnotes
Acknowledgements
I would like to thank Helena Romanowski and the people of the entomology laboratories of UFRGS for help in the field and lab and for useful discussions. Sincere thanks to G. Wilson Fernandes for helpful comments on an earlier version of this paper. Thanks to ProDoc-CAPES and CNPq (Brazilian National Science Council) for funding. This is contribution no. 495 to Departamento de Zoologia, UFRGS.