
Abstract
Background
Respiratory virus infections are involved in asthma exacerbations. However, there are no reports of the relationship between respiratory virus infections and Japanese cedar pollinosis.
Objective
We studied the relationship between respiratory viral infection and the appearance of preseasonal symptoms and the severity of seasonal symptoms in Japanese cedar pollinosis.
Methods
In 36 patients with asthma and with no symptoms (PreAsyP) and 54 patients with asthma and with symptoms (PreSyP) before the cedar pollen shedding commenced (preseason), and 37 patients with mild-to-moderate severity (InMild/Mod) and 45 patients with severe to extreme severity (InSev/Ext) after cedar shedding commenced (in season), the occurrence of respiratory viruses and nasal smear cytology were examined.
Results
In total, seven infections with respiratory viruses were detected among the subjects. Human rhinovirus (HRV) C infection was detected in one subject in each of the PreAsyP and PreSyP groups, and one HRVA infection occurred in the InMild/Mod group. In the InSev/Ext group, one HRVA, one HRVC, one respiratory syncytial virus, and one human metapneumovirus were detected. There was no significant difference in the rate of detection of viral infections between the PreAsyP and the PreSyP groups (p = 0.077), and between the InMild/Mod group and the InSev/Ext group (p = 0.24, Wilcoxon rank sum test). When cells types in nasal smears were identified and their abundance examined, the rate of neutrophilia in the subjects in the PreSyP group was 54%, which was statistically higher (p < 0.01) than the subjects in the PreAsyP group (25%). Interestingly, in the subjects in the InSev/Ext group, the proportion of eosinophils (40%) was larger (p < 0.05) than in the subjects in the InMild/Mod group (19%).
Conclusion
These results provided no evidence that respiratory virus infections contributed to preseasonal symptoms and severity in season of Japanese cedar pollinosis. Nasal neutrophilia was related to preseasonal symptoms, whereas nasal eosinophilia was related to severity of symptoms during the pollen season.
Previous studies showed the involvement of Staphylococcus aureus and Moraxella catarrhalis in preseasonal nasal symptoms, and in a poor response to prophylactic treatment in Japanese cedar pollinosis.10,11 These observations raised the question about whether respiratory viruses can be involved in preseasonal nasal manifestations. In this study, we compared the detection rates of respiratory viruses between asymptomatic and symptomatic groups in preseason, and mild-to-moderate and severe-to-most severe groups after the beginning of pollen shedding.
Methods
Patients
This study was done between early January and early May, 2014. Thirty-six patients with asthma and who had no symptoms (preseasonal patients without symptoms [PreAsP]), 54 patients who visited our clinic had one or more symptoms of sneezing, nasal discharge, and/or nasal obstruction (preseasonal patients with symptoms [PreSyP]) before the beginning of marked pollen shedding (February 22, 2014), and 37 patients had nasal symptoms with mild or moderate severity (InMild/Mod), and 45 patients had nasal symptoms with severe-to-extreme severity (InSev/Ext) during the pollen season (patients with in-season symptoms) (Fig. 1). Patients were assigned to the four groups according to symptom severity when they first visited our clinic in 2014. Patients in the PreAsP group visited the clinic for prophylactic treatment in the preseason. The time of onset of nasal allergic symptoms in the PreSyP, InMild/Mod, and InSev/Ext groups are indicated in Table 1.

(A) Japanese cedar and Chamaecyparis obtuse pollen daily counts (Durham method, Ref. 22) in Yokohama City, 2014. (B) Numbers of patients and timing of their first visit to our clinic (groups: patients with no symptoms during the preseason [PreAsP], patients with symptoms during the preseason [PreSyP], and patients with nasal symptoms of mild or moderate severity in season [InMild/Mod] patients with nasal symptoms of mild or moderate severity in season, and patients with nasal symptoms with severe–to– extreme severity in season [InSev/Ext]).
Characteristics and severity of symptoms in the four groups of patients *

PreAsP = Patients with no symptoms during the preseason; PreSyP = patients with symptoms during the preseason; InMild/Mod = patients with nasal symptoms of mild or moderate severity in season; InSev/Ext = patients with nasal symptoms with severe-to-extreme severity in season; SE = standard error.
The symptoms in all the patients were persistent from their time of onset until the time of clinic visit.
All the patients had a history of pollinosis for >3 years and were diagnosed with seasonal allergic rhinitis caused only by Japanese cedar pollen.7–9 During the pollen shedding season, these patients had strong symptoms, and eosinophilia in a nasal smear. They had positive results for immunoglobulin E (IgE) antibodies only to Japanese cedar pollen, with class 2 or more reactivity, as assessed by using fluorescence enzyme immunoassay, but had negative results for specific IgE antibodies to house-dust mite, orchard grass, ragweed, mugwort, and Alternaria. Patients given immunotherapy or with acute or chronic respiratory infection were excluded. The number of patients in each of the four categories and the date of their visits to the clinic during the study are shown in Fig. 1B. All the subjects provided informed consent for these studies, which were approved by Nippon Medical School's ethics committee.
Patients' Symptoms and Severity Grading
Patients who were asymptomatic and patients who were symptomatic and who visited before the cedar pollen season were asked whether or not they had nasal symptoms consistent with pollinosis. The subjects who answered “no” and those who answered “yes” were classified as in the PreAsP group and the PreSyP group, respectively.
All of the subjects were given a detailed symptom questionnaire at each visit before and after the beginning of the pollen season. Classification of symptom severity was done by using the Japanese Guideline for allergic rhinitis.79 Frequency of sneezing attacks and of blowing the nose per day were classified into the following: none, -; 1–5, +; 6–10, ++; 11–20, + + +; and >21, ++++. The degree of nasal obstruction was classified as follows: none, -; feeling of obstruction but did not required mouth breathing, +; strong obstruction that required mouth breathing sometimes during the day, ++; serious obstruction that required mouth breathing most of the day, +++; and serious obstruction for the entire day, ++++. Severity grading was classified as follows: most severe, sneezing attacks or blowing the nose/day ++++ or nasal obstruction ++++; severe, sneezing attacks and blowing the nose/day +++ or nasal obstruction +++; moderate, sneezing attacks or blowing the nose/day + + or nasal obstruction ++; mild, sneezing attacks, or blowing the nose/day + or nasal obstruction +; no symptoms.
Respiratory Virus Infection Diagnosed by Direct Polymerase Chain Reaction by using Nasal Swabs
Nasal specimens were collected from the nasal cavity with advanced flocked swabs, were placed in Universal Transport Medium (Copan Innovation, Brescia, Italy), and stored at −80°C until used for viral detection. 12 For viral RNA extraction, RT polymerase chain reaction (RT-PCR), and sequence analysis, nasal swab samples were centrifuged at 3000 Xg at 4°C for 15 minutes, and the supernatants were used for RT-PCR and sequence analysis as described previously. 12 Viral RNA was extracted from the samples by using the QIAamp Viral RNA Mini kit (QIAGEN, Hilden, Germany). The reverse transcription reaction mixture was incubated with random hexamers at 37°C for 15 minutes, followed by incubation at 85°C for 5 seconds by using RT reagent Kit (Takara Bio, Shiga, Japan), and then amplification by thermal cycling.
The PCR procedures for amplification of various viral genes, including respiratory syncytial virus (RSV), 13 human rhinovirus (HRV)-human enterovirus,14,15 human metapneumovirus (HMPV), 16 and human parainfluenza virus, 12 were conducted as previously described. To avoid carry over and cross-contamination in PCR, the extraction of viral RNA was conducted in a room physically separate from that used for performing PCR. Furthermore, positive and negative controls were included in all the PCR assays. The PCR products were determined by electrophoresis on 3% agarose gel. Purification of DNA fragments and nucleotide sequence determination procedures were performed as described previously. 17
Analysis of Cell Types in Nasal Swabs
Nasal swabs were transferred to glass slides, dried, and fixed in 99% methanol for 3 minutes. They were stained by using Hansel solution (Torii Co., Tokyo, Japan) for 1 minute. 18 We examined the stained smears with the aid of a microscope and X200 magnification. The numbers of neutrophils and eosinophils were semiquantitatively graded19–21 as follows: -, none; ±, a few scattered cells; +, found cells easily; ++, between + and +++; +++, abundant cells, often in clumps. Cell identification from nasal swabs was done for each patient as follows: N, neutrophils + to +++ and eosinophils - to ±; N > Eo, neutrophils ++ and eosinophils +, or neutrophils +++ and eosinophils + to ++; Eo ≥ N, eosinophils ++ and N + to ++, or eosinophils +++ and neutrophils ++ to +++; Eo, eosinophils + to +++ and neutrophils - to ±; cell -, no infiltrating cells.
Statistical Analyses
For comparison of patient demographics, a t-test was used; for the rate of virus detection and cell infiltration, the Wilcoxon rank sum test was used. A p < 0.05 was considered statistically significant.
Results
Pollen Count
This study was done in Yokohama City, Kanagawa prefecture near Tokyo, in 2014. Japanese cedar pollen counts in Yokohama City were done by using the Durham method. 22 During this time, the accumulative cedar pollen count/cm2 reached 1308 (average, 3037 [range, 284–8079] between 2004 and 2013), a value considerably lower than the average pollen count over the previous 10 years for Yokohama City. The daily pollen count was 0–3 particles/cm2 (average, 0.1 particle/cm2) until February 3, 2014, when 12.7 particles/cm2 was recorded, and then remained at 0–3 particles/cm2 (average, 0.36 particles/cm2) until February 22, 2014. Thereafter, cedar pollen shedding began in earnest, and, until March 16, 2014, pollen counts averaged 24 particle/cm2 per day. The counts of the Japanese cedar pollen and Chamaecyparis obtuse pollen, a member of the Japanese cypress tree family with cross-reactivity with cedar pollen, are shown in Fig. 1 A.
Characteristics and Severity of Symptoms in the Four Groups of Patients
Patients in the PreAsP, PresyP, InMild/Mod, and InSev/Ext groups were categorized as shown in Table 1. All the patients in the PreAsP group had no symptoms; in the PreSyP group, 21 subjects had mild symptoms, 13 had moderate, 9 had severe, and 11 had extreme symptoms; in the InMild/Mod group, 17 patients had mild symptoms and 20 had moderate symptoms; and, in the InSev/Ext group, 25 subjects had severe symptoms and 20 had extreme symptoms (Table 1). The percentages of sneezing, nasal discharge, and obstruction in the patients in the PreSyP group were 85, 93, and 51%, respectively, whereas those in the InMild/Mod group were 95, 89, and 59%, respectively, and those in the InSev/Ext group were 96, 96, and 64%, respectively.
Detection of Respiratory Viruses among the Four Groups of Patients
Seven virus infections were detected among all the patients. One infection with HRVC was found in a patient in each of the PreAsyP and PreSyP groups; one HRVA infection was found in a patient the InMild/Mod group; and one HRVA, one HRVC, one RSV, and one HMPV infection were found in patients in the InSev/Ext group. There was no significant difference in the rate of detection of viral infection between the PreAsy and PreSyP groups (p = 0.77, Wilcoxon rank sum test) and between the InMild/Mod and InSev/Ext groups (p = 0.24). Three of seven patients with virus positive results had throat pain, cough, and fatigue, but four patients had no symptoms. These results indicated that respiratory viral infections did not contribute in a major way to preseasonal symptoms and severity of symptoms after the beginning of pollen season.
Relationship between Symptoms of the Common Cold and Confirmed Virus Infection
The relationship between symptoms of the common cold and confirmed viral infection (Table 2) was studied on the first visit to our clinic. Three patients in the PreSyP group had symptoms of throat pain, cough, or fatigue. One of these three with symptoms of a common cold had a positive result for HRVC. No patients in the PreAsP group had cold symptoms, although one patient had an HRVC positive result. Similarly, no patients in the InMild/Mod group had cold symptoms, although one had a positive HRVA result. Five patients in the InSev/Ext group had cold symptoms and two of these five had positive RSV or HRVA results; three patients with cold symptoms had negative results for respiratory virus. Two patients in the InSev/Ext group who had positive HRVC or HMPV results had no cold symptoms.
Detection of respiratory viruses among the four groups of patients *
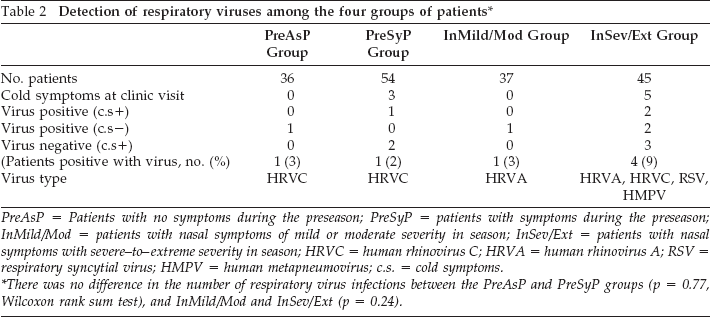
PreAsP = Patients with no symptoms during the preseason; PreSyP = patients with symptoms during the preseason; InMild/Mod = patients with nasal symptoms of mild or moderate severity in season; InSev/Ext = patients with nasal symptoms with severe-to-extreme severity in season; HRVC = human rhinovirus C; HRVA = human rhinovirus A; RSV = respiratory syncytial virus; HMPV = human metapneumovirus; c.s. = cold symptoms.
There was no difference in the number of respiratory virus infections between the PreAsP and PreSyP groups (p = 0.77, Wilcoxon rank sum test), and InMild/Mod and InSev/Ext (p = 0.24).
Nasal Swab Cytology
Nasal swab cytology results are presented in Fig. 2. Of the subjects in the PreAsP group, 67% had no detectable eosinophils and neutrophils (cell-) in nasal smears, whereas only 13% of the subjects in the PreSyP group had no cells (significant difference, p < 0.01). Fifty-four percent of the subjects in the PreSyP group were scored N (exclusively neutrophils), whereas 25% in the PreAsP group were scored N (significant difference, p < 0.01). One patient in the PreAsP group (2%) and five patients in PreSyP group (9%) had eosinophils in nasal swabs (p = 0.23) (Fig. 2). By contrast, 19% of subjects in the InMild/Mod group were scored as Eo, whereas 40% of subjects in the InSev/Ext group were Eo (p < 0.05).

Abundance of different cell types in the nasal swabs. N: PreSyP > PreAsyP, **p < 0.01, Wilcoxon rank sum test; Eo: no significant difference between PreAsyP and PreSyP; Eo: InSev/Ext > InMild/Mod, *p > 0.05; cell-, PreAsyP > PreSyP, **p < 0.01. N = neutrophils; PreSyP = patients with symptoms during the preseason; PreAsyP = patients with no symptoms during the preseason; Eo = eosinophils; InSev/Ext = patients with nasal symptoms with severe-to-extreme severity in season; InMild/Mod = patients with nasal symptoms of mild or moderate severity in season; cell- =no detectable eosinophils and neutrophils.
Discussion
Many articles1,2,23–26,36,37 have described the association between respiratory virus infections and asthma exacerbation. Respiratory viruses were detected in 80% of asthma exacerbations in children, 23 and 84% of children with atopy who were hospitalized for wheezing had respiratory virus infections. 24 In adults, respiratory viruses contribute to the adverse outcome of the patients with established asthma and are associated with asthma exacerbations.1,2 In pathophysiologic studies in humans and animals, bronchial hypersensitivity is associated with respiratory viruses that can induce macrophage and eosinophil activation.25,26
In allergic rhinitis, it was reported that the rate of the respiratory virus infection was greater than that in subjects with no disease and no allergic disease and that these viruses can activate eosinophils and neutrophils in nasal allergy.3,4 However, some reports indicate that virus infections do not induce hyperresponsiveness or worsen symptoms of allergic rhinitis.5,6 In Japanese cedar pollinosis, RSV infection suppressed cedar pollen induced T-helper type 2 cytokine levels. 27 Immunohistochemical analysis of nasal biopsy specimens showed that HRV infection did not induce inflammatory cellularity. 28 Thus, the involvement of respiratory virus infection in allergic rhinitis or pollinosis has been a controversial matter. Of patients with cedar pollinosis, 10–50% have nasal symptoms similar to allergic rhinitis before the pollen season, and this study investigated if this might be associated with respiratory viral infections. In addition, if these symptoms involve IgE mediated reactions, then one might expect to see significant eosinophilia in nasal smears from these subjects.
In 2010, we analyzed nasal smears from patients and found that, in ~60% of patients (n = 83) with preseasonal symptoms, neutrophils were the predominant cell in nasal smears; only 9.6% of patients had predominantly eosinophils. 10 By contrast, in patients with symptoms in season, 60% had eosinophilia, and only 11% had a prominent neutrophilia. Staphylococcus aureus in 64%, Staphylococcus epidermidis in 30.7%, Moraxella catarrhalis in 25.6%, Streptococcus pneumoniae in 10.2%, and Klebsiella pneumoniae in 10.2% were detected by culture from nasal swabs from 39 patients in the PreSyP group. Analysis of these data indicated that preseasonal symptoms correlated with neutrophilia associated with S. aureus and other bacteria.
To validate and extend our results, we conducted a further study in 2011. 11 The results indicated that neutrophilia occurred in a greater proportion of patients in the PreSyP group than those in the PreAsP group, and nasal carriage of S. aureus in the PreAsP and PreSyP groups was 79%, 75%, respectively, whereas, for M. catarrhalis, it was 9%, 25% (significantly higher in PreAsP than in PreSyP; p < 0.05). In patients who had positive results for S. aureus and M. catarrhalis, the degrees of neutrophilia in the PreSyP group were larger than in PreAsP (p < 0.01). In the PreSyP group, the magnitude of neutrophilia was higher (p < 0.05) in subgroups with more colonies of S. aureus than in subgroups with fewer colonies.
Based on these observations, we postulated that bacterial activation induced neutrophilia, which induced nasal epithelium damage and nasal hyperresponsiveness; this was supported by other reports of the involvement of bacteria and neutrophilia in respiratory epithelium damage.29–34 Thus, whether or not respiratory viral infections are involved in preseasonal nasal symptoms or in symptom severity in the pollen season is an important question. Among the various respiratory viruses, >60% of acute upper respiratory infections, including rhinitis, are caused by HRV, RSV, HMPV, and human parainfluenza virus.35,36 Thus, we selected these viruses for our initial study, although there are other viruses that may be relevant in respiratory symptoms.35,37
Respiratory viruses were detected in 7 of 172 subjects (4%) (Table 2). There were no significant differences in the rate of detected viruses between the PreAsP and PreSyP groups (p = 0.77) or between the InMild/Mod and InSev/Ext groups (p = 0.24). Thus, our study did not detect an association between the present of respiratory viruses and the appearance of preseasonal symptoms or the severity of seasonal symptoms of allergic rhinitis. We also examined the abundance of neutrophils and eosinophils in nasal swabs in the four groups. More subjects in the PreSyP group had cells in their nasal smears, and 54% of these subjects had prominent neutrophilia compared with only 25% with neutrophilia in subjects in the PreAsP group (p < 0.01) (Fig. 2). Nasal neutrophilia is associated with the appearance of symptoms in the preseason. By contrast, 19% of subjects in the InMild/Mod group and 40% of subjects in the InSev/Ext group had a prominent eosinophilia in nasal smears (p < 0.05). Interestingly, 73% of the subjects in the InMild/Mod group visited the clinic in the first half of the pollen season (before March 23, 2014), whereas 71% of the subjects in the InSev/Ext group visited after March 23. Accumulative pollen exposure may be associated with higher eosinophilia and more severe symptoms.
Conclusion
Our results provided no evidence that respiratory viral infections contributed to preseasonal symptoms and severity of symptoms in pollen season in Japanese cedar pollinosis. Nasal neutrophilia was related to preseasonal symptoms, whereas nasal eosinophilia was related to severity of symptoms during cedar pollen shedding.
Footnotes
Acknowledgments
We thank A.D. Befus, Ph.D., University of Alberta, Canada, for helpful review of the manuscript, and T. Murayama for data collection.
The authors have no conflicts of interest to declare pertaining to this article