
Abstract
This study compares the differences in effectiveness of the five volleyball skills (serve, reception, attack, block, and dig) between men and women in high-level tournament games played at the last four consecutive Olympics. Results showed that men's and women's volleyball games are completely differentiated by two outcome measures. The first one is the higher proportion of faulty serves performed by men which is essentially attributable to the 19 cm difference in net height, while the second one derives from the fact that men outperform women at the execution of the attack.
It is difficult to think of a sport, whether it is a field contest or a team game, that is not differentiated into men's and women's competitions. This is justified by the obvious distinguishing differences of the male and female phenotypes in strength, acceleration, and speed due to men's larger muscle mass (Bishop, Cureton, & Collins, 1987; Miller, MacDougall, Tarnopolsky, & Sale, 1993), height, etc. In most sports, men's and women's competitions are governed by the same rules and regulations. In volleyball, however, a specific difference is the height of the net at 2.24 m in women's competitions and 2.43 m in men's competitions (F. I. V. B., 2012).
There have been a number of studies comparing performance and effectiveness of different volleyball techniques between males and females. For example, Palao and colleagues published a number of studies related to sex differences in volleyball performance. Their 2004 article (Palao, Santos, & Ureña, 2004) studied the effect of team level on skill performance in volleyball matches of the Sydney 2000 Olympics. The analysis was performed separately for males and females, while the team's level was established in relation to the final classification of the team in the competition (level 1: 1st-4th; level 2: 5th-8th, and level 3: 9th-12th). The findings showed that, in males there was a significant difference between teams' levels for the skills of spiking and blocking. The block is the skill that differentiates the teams of level 1 with the teams of level 2. A reduction of error in relation to the level of the team is observed. In females there was a significant difference in the performance of the attack in the teams of level 1. An increase in success of reception, attack, block and dig in relation to the level of the team is observed. The 2009 study (Palao, Manzanares, & Ortega, 2009) analyzed games from the XVth Mediterranean Games of Almeria 2005. The variables analyzed were gender, type of technique, and efficacy of technique. It was found that the serve most used by males was the power jump serve, and by females it was the standing serve. The serve was more effective for females than for males, while serve reception was more effective for males. The overhead set was the most used set for both males and females. When the set was done after a dig, the forearm contact was also used. Males had more effective sets than females. The standard attack technique was the most used attack. Attack efficacy was similar for both genders. The dig technique most often used was the forearm contact. Dig efficacy was similar for both genders. The data showed that use of the techniques and their efficacy were different for males and females; therefore, training methods should also be different. Finally, the 2010 study (Palao, Leite, Mesquita, & Sampaio, 2010) analyzed games from several World Championships in 2007. Discriminant analysis was used to identify the game-related statistics which better discriminated performances by sex. The analysis yielded an emphasis on fault serves, shot attacks, and reception digs. Men's volleyball games were better associated with terminal actions (errors of service) and women's volleyball games were characterized by continuous actions (in defense and attack). The authors conclude that these differences may be related to the anthropometric and physiological differences between women and men and their influence on performance profiles.
Likewise, a series of two studies was recently published comparing the performance of male and female volleyball athletes from the 2004 Athens Olympics on different techniques. In the first study (Bergeles, Barzouka, & Nikolaidou, 2009), where comparisons were made between setters and attackers, it was found that the higher the performance of setters, the higher the performance of attackers of both genders. Significantly lower percentages of male compared to female attackers' average and very good performances were found after receiving good and excellent quality sets, whereas significantly higher percentages of good performance were shown in favor of male attackers after receiving excellent quality sets. In the second study (Bergeles, Barzouka & Malousaris, 2010) it was found that performance effectiveness in sequential actions of set-to-counter-attack was similar between genders.
Finally, Laios (2010) showed that men in the 2008 Beijing Olympics volleyball games had significantly higher efficiencies in the skills of the pass, reception, and attack, while women had significantly higher efficiencies in the skill of the serve. There were no differences between the two genders in the skills of the dig and block. The attacking skills of reception, attack, and block were significantly correlated. The same occurs among the defensive skills of serve and block. The logistic regression model provided evidence that the efficiency of the set may fully predict the gender of the team. In this study, it was shown that the use of the percentage of perfect actions to the total number of attempts as an index of the efficiency can differentiate high-level teams of different gender. The author concluded that these findings and inferences can be used as guidelines to coaches of teams of both genders with regards to the skills that require further improvement.
The goal of this study was to compare the effectiveness of the five classic skills in volleyball (serve, reception, attack, block, and dig) between men and women in games played in the last four consecutive Olympic tournaments. This longitudinal approach will enable the distinction of those differences that remain significant over time and consequently differentiate the game of volleyball played by the two genders.
Method
Procedure
In all Olympics tournaments both in men's and women's games there was a preliminary round, where the 12 teams of each gender were divided in two groups of six. In each group, all teams played with each other one match. Thus, in this round there was a total of 30 matches. The first four teams from each group qualified for the quarter-finals. There followed four quarter-final matches, two semi-final matches, and the final match for the gold and silver medal plus a match for the bronze medal and the fourth position. This brings the total number of matches to 38 for each team in each tournament. The grand total numbers of matches to all tournaments were 152 for each gender. It should be noted that all tournaments played with the same regulations. All the data were collected from the official statistical bulletins of all Olympic tournaments both for men and women. The heights of all the participant athletes were also recorded. At the same time all games were analyzed with the VirtualDub software (VirtualDub, 2007). The agreement with regard to scoring actions, i.e., actions that result in an immediate point for either team, was 100%, while for non-scoring actions it was also almost perfect (99.8%).
The following five classic skills were examined: serve, reception, attack, block, and dig. A successful serve is an ace, i.e., a serve that gives an instant point to the serving team, while a faulty serve gives an instant point to the opposing team. A successful reception is the reception that allows the team to build an attack, while a fault in reception gives an immediate point to the opposing team. A successful attack gives the point to the attacking team, while a faulty attack gives the point to the defending team. Likewise, a successful block earns the point for the blocking team, while a faulty block gives the point to the attacking team. Finally, a successful dig is the dig that allows the team to continue its play, while a faulty dig means that the opposing team wins the point. As a result, in each Olympiad and each gender, 10 variables' absolute frequencies were counted and their proportions calculated using the total number of attempts in each skill.
Analyses
The differences in the mean values of the 10 outcome measures in their percentage form for men and women at the four Olympics were tested with the independent samples t test. Likewise, the difference in the mean heights between male and female athletes, which were found to follow the normal distribution with the Kolmogorov-Smirnov test, was tested with the independent samples t test. The level of significance was set at 0. 05. The effect size was also calculated using Cohen's d (Cohen, 1988).
Results
The mean height of male players who participated in the four Olympics was 197.5 ± 7.2 cm, while for women it was 182.6 ± 8.3 cm. The statistically significant difference (t1150 = 32.8, p <.01, Cohen's d = 1.92) is almost 15cm, which is 4 cm below the 19 cm difference in the height of the net. If the libero players are not taken into consideration, since they are not allowed to perform serves and attacks, the difference remains roughly the same (198.5 ± 6.3 cm vs. 183.9 ± 7.6cm; t1044 = 23.9, p <.01, Cohen's d = 2.09).
Figures 1–5 show the proportions of successes and faults for each of the five skills for a total of 10 outcome measures for men (continuous line) and women (dotted line) in each of the four Olympics. The grey and dotted columns show the aggregate mean values (with their standard errors) for men and women, respectively, over the four Olympics. The aggregate mean values over the four Olympics are reiterated in Table 1 (showing standard deviations instead of standard errors). Also shown are the results of the t tests between the two genders and the associated effect size, expressed as Cohen's d.
Descriptive Statistics (Averaged Over Four Olympics) For 10 Outcome Measures (Percentages) For Men and Women With Comparisons by Sex


Proportion of aces and faults in the serves for men (continuous line) and women (dotted line) in the four Olympics. The grey and dotted columns show the aggregate mean values (with their standard errors) for men and women, respectively, over the four Olympics.
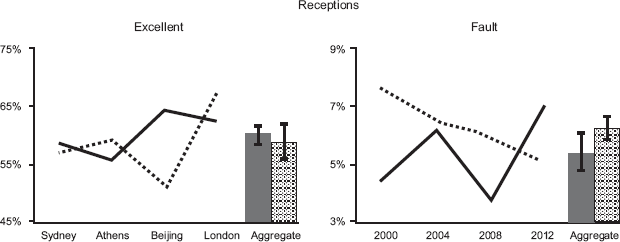
Proportion of excellent and faulty receptions for men (continuous line) and women (dotted line) in the four Olympics. The grey and dotted columns show the aggregate mean values (with their standard errors) for men and women, respectively, over the four Olympics.
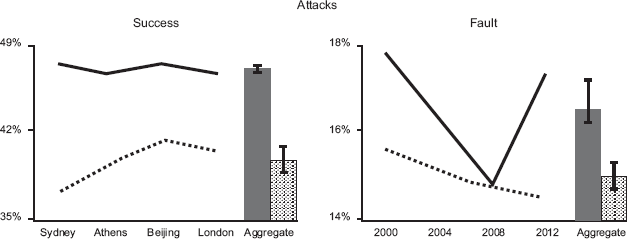
Proportion of successful and faulty attacks for men (continuous line) and women (dotted line) in the four Olympics. The grey and dotted columns show the aggregate mean values (with their standard errors) for men and women, respectively, over the four Olympics.

Proportion of successful and faulty blocks for men (continuous line) and women (dotted line) in the four Olympics. The grey and dotted columns show the aggregate mean values (with their standard errors) for men and women, respectively, over the four Olympics.

Proportion of successful and faulty digs for men (continuous line) and women (dotted line) in the four Olympics. The grey and dotted columns show the aggregate mean values (with their standard errors) for men and women, respectively, over the four Olympics.
Statistically significant differences between the two genders were found with respect to the serve faults (p <.001), successful attacks (p <.001), and faulty blocks (p <.05). The segregation of the two genders by the proportion of serve faults was complete. There was a gap of 3.3% of serve faults between the lowest value for men (13.6%) and the highest value for women (10.3%) that greatly surpassed the additive variance observed in the two genders. In fact, as evidenced by the value of Cohen's d (4.79), the difference in the mean values is almost five times greater than the pooled variance of the two genders.
The same comprehensive discrimination between the two genders was observed with regards to the proportion of successful attacks. In this case the gap between the lowest value for men (46.7%) and the highest value for women (41.1%) attained the value of 5.6%, with a Cohen's d equal to 5.75. The attacking superiority of men is enhanced by the significantly higher proportion of faulty blocks of the opposing team with a Cohen's d equal to 1.89.
One final point of interest is the continually decreasing proportion of dig faults across the four Olympics.
Discussion
The present findings provide evidence that the game of volleyball played at the highest level is consistently different in men's games in comparison to women's games in two distinct skills. Specifically, men have almost twice as many faulty serves, and at the same time they outperform women in successful attacks, which is coupled with the opponents' increased proportion of faulty blocks. Both these differences are unbridgeable to the extent that just by looking at the game statistics one can safely deduce whether it was a men's or a women's volleyball game.
The vast difference in serve faults between men and women is the primary repercussion of the 19 cm difference in the height of the net, therefore it is not gender-related per se. This requires some more explanation, since this difference in net height is almost completely offset by the difference in the heights between male and female volleyball players and even overcompensated, since men jump higher than women. It has been shown that both in men's and women's volleyball the jump serve is the dominant serve (Aggelonidis, 2004). The rationale behind this prevailing tendency is not only to achieve an ace, but to make reception more difficult. The odds of winning the rally are overwhelmingly in favor of the receiving team (∼65% vs. ∼35% for the receiving team). A team that receives a serve without any problems will have the chance to choose the best attacking line. Consequently, the serving team's foremost strategy is to encumber the opposing team's reception. This can only be done with an attacking (jump) serve.
If there were no net, then the server would have no difficulty in executing a jump serve and landing it with the maximum speed anywhere on the opponent's terrain. The net is an additional challenge: the ball first has to pass over it. The best servers hit the ball when they have performed their jump, at a height over three meters, and when they are already around two meters inside their own backline with an initial horizontal velocity of the ball around 25 m/s, so that the ball reaches the opponents' backline in less than 0.8 s, minimizing the receiver's ability to react (Cairns, 2006; Huang & Hu, 2007). Taking into consideration the ball's dimensions (a circumference of 65–67 cm or adding about 11 cm to the height that the ball has to pass over the net), with the assumption of no air resistance, and taking the acceleration due to gravity equal to 9.8 m/s, finding a trajectory with all the above conditions satisfied is almost a physical impossibility. Solving the problem with the height of the net at 2.24 m, one arrives at numerous solutions for the trajectory. It seems that the inventors of the volleyball rules have, unknowingly, set an almost insurmountable obstacle for the male jump servers.
The above is clarified in the Appendix, where a simple mathematical model of the ball trajectory of jump serves is presented. Although the analysis does not claim to be comprehensive, it does however make it clear that the net height in men's volleyball poses a constraint for the execution of successful jump serves.
However, the resistance of the air comes to the aid of the servers. First, solving the projectile motion equations taking air resistance (drag) into consideration seems to be in favor of the servers. But most importantly, the servers make use of the Magnus effect by hitting the ball with top-spin (Lithio & Webb, 2006). Simply put, a ball with a top-spin will cause it to deviate from the theoretical parabolic trajectory to one that is more elliptical. Both the drag and Magnus effects will cause the ball to hit the ground at a shorter distance than the theoretically expected one. It should be noted that not only men but also women execute the jump serve with a top-spin, utilizing its advantages of shorter flight times and motion unpredictability.
All the above lead to the conclusion that in men's volleyball the execution of a successful attack serve is a more complicated task, requiring complex coordination of many movements by the server (Häyrinen, Mikkola, Honkanen, Lahtinen, Paananen, & Blomqvist, 2011). Most players are willing to risk hitting the net or, more often, to land the ball outside the opponents' court rather than jeopardize their team's performance with an unhindered attack from the opponent.
We have to bear in mind that the proportion of successful attacks includes also second attacks and counterattacks, which are usually not performed under the best of conditions. This proportion would be larger if the reception was not performed after a jump serve. It is also important to note that the proportion of successful attacks is the one that remained remarkably invariant throughout the four Olympics. No other technique in men or women showed similar consistency. The increased capability of men to perform powerful attacks high above the net, which increases the probability of success, is coupled with their significantly increased proportion of faulty blocks in comparison to women.
One other outcome of interest, although not related to gender comparisons, is the almost twofold reduction of dig faults from the Sydney 2000 to the London 2012 Olympics. The beginning of this escalating capability in better ground defense roughly coincides with the introduction of the libero player in 1998. Already, an analysis of games from the 2004 World League showed that the intervention of the libero was associated with better efficacy in defense (Palao, 2007). Similar findings were reported with regards to the Athens 2004 in comparison to the Sydney 2000 Olympics (Laios & Kountouris, 2005).
A comment on the statistical analysis currently employed is warranted. The t tests employed were over the averaged proportion in each of the 10 outcome measures in each of the four Olympics separately for men and women. Therefore, there were but eight rows of data, which, however, were intransigent and robust assessments of the measured proportions for each Olympic tournament. Two other alternative approaches would be to average over the 12 + 12 = 24 teams in each tournament that would yield a sample of 96 rows or to average over each 152 + 152 = 304 games in each tournament that would yield a sample of 1, 216 rows. Undoubtedly, these approaches would yield better estimates of the variability of the outcome measures. However, the standard errors calculated by dividing the standard deviations by the square root of the sample size would revert to the same estimates as the sample sizes in these alternative approaches are increased. This is not a conjecture, since both these alternatives were actually performed and the differences in the standard errors and especially in the average values were infinitesimal. Besides, as already stated, the differences between the two genders in the two primary outcomes of serve faults and attack successes practically renders the statistical confirmation of their significance redundant.
In conclusion, in the opinion of a coach of national teams in men's and women's volleyball, “they are completely different games.” Although the statement sounds absolute, the current findings support the notion that volleyball played at a high level follows different pathways for men and women. Differences in the serve are governed mostly by the difference in net height, while all the subsequent phases of the rally are governed by the men's increased capabilities at the execution of the attack.