
Abstract
It is well known that the two dependent-samples t test (and a within-subjects design in general) is typically more powerful than the two independent samples t test (a between-subjects design), and that this increase in power is in large part a function of the correlation between the two sets of scores (e.g., pre-test and post-test). This paper demonstrates relative power as a function of (1) the correlation between groups with effect size and sample size held constant and (2) sample size with the correlation between groups and effect size held constant.
In some experiments, the researcher may choose to use either two independent groups (a between-subjects design) or to measure the same subjects twice (a within-subjects design). The within-subjects approach has long been known to be the more statistically powerful alternative (see, for example, Kirk, 1982; Maxwell & Delaney, 2004). As an example, suppose a cognitive psychologist has a theory which predicts that concrete nouns should be easier to recall than abstract nouns. So, he wishes to test:

The researcher could use either two independent groups (randomly assigned to learn one of the two lists), or the same people measured twice (each person learns both lists). Consider the two formulas for the observed statistics; first, the two independent-samples t test:

And next, the two dependent samples t test:

Note that the value of μ d is typically taken to be zero. So, for any two sets of scores, the numerator of these two statistics will be identical. That is, the difference of the averages in the numerator of the two independent-samples t is equal to the average of the differences in the numerator of the two dependent-samples t. The larger (and likely more powerful) of the two statistics will be the one with the smallest denominator. So, ignoring for the moment the different ns and, thus, the different values for degrees of freedom, we are basically comparing the value of (s21s22) to that of s2 d . If the difference score d = x2 – x1, then the variance of the difference (in terms of population parameters) is given by:

Or, in terms of sample statistics,

Thus, the denominator of the two dependent-samples t will be smaller than that of the two independent-samples t by a term accounting for the correlation between the two sets of scores.
It is instructive to investigate the relative power of the two tests as a function of the correlation between scores with the effect size and sample sizes held constant, and as a function of sample size with the correlation and effect size held constant. These two situations are presented in Figs. 1 and 2.
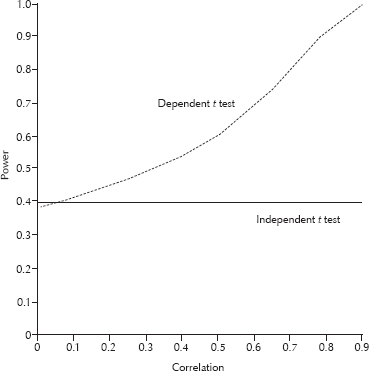
Power for the dependent t test vs the independent t test as a function of the correlation between the pre-test and the post-test. Cohen's d is .5 for the independent t test. Results are for alpha = .05, one-tailed test, n1 = n2 = 16 for the independent t test and n = 16 for the dependent t test.

Power of the dependent-samples t test vs the independent-samples t test as a function of sample size (this is n1 = n2 for the independent t test and n for the dependent t test). The correlation between groups is constant at .5, Cohen's d is .5, and alpha = .05, one-tailed test.
The values plotted were obtained using the SAS PROBT function with an appropriate non-centrality parameter. In Fig. 1, when the correlation is zero, the power of the two dependent-samples t is slightly smaller than that of the two independent-samples t (which does not change as a function of the correlation). This is due to the loss in degrees of freedom (i.e., the df for the two independent-samples t is twice that of the two dependent-samples t for the same data). But note that the correlation necessary to overcome this loss in degrees of freedom is quite small, and even moderate correlations can make the dependent t considerably more powerful than the independent t. Finally, in Fig. 2, the power of the two dependent-samples t rises at a much faster rate than the independent-samples t as a function of sample size with the correlation fixed.
Any inferences drawn from the results presented here are potentially limited to the effect sizes and sample sizes mentioned. It is worth noting that a crossover design, where each subject receives a sequence of treatments, would require different statistical analyses. The applied researcher may find these brief results useful in making experimental design decisions, and teachers of statistics may use this information to enlighten students.