
Abstract
Reaching a saturation point in thematic analysis is important to validity in qualitative studies, yet the process of achieving saturation is often left ambiguous. The lack of information about the process creates uncertainty in the timing of recruitment closure. This exploratory study was conducted to demonstrate a rigorous approach to reaching saturation through two-stage establishment of a codebook used for thematic analysis. The codebook development involved inductive analysis with six interviews, followed by a refinement of the coding system by applying them to an additional 33 interviews. These findings are discussed in relation to plausible pattern in code occurrence rate and suggested sample sizes for thematic analysis.
Theoretical saturation is closely related to grounded theory and was originally defined as the point at which no additional themes are found from the reviewing of successive data regarding a category being investigated (Glaser & Strauss, 1967). The theoretical saturation subsequently sets the sample size, using theoretical sampling. Similarly, the concept of saturation has been also referred, or implied, as a justification for the sample size in other qualitative analyses, such as thematic analysis (Yorkston, Klasner, & Swanson, 2001; Carter, Macleod, Brander, & McPherson, 2004; Dilorenzo, Becker-Feigeles, Halper, & Picone, 2008). The process taken to achieve saturation, however, is hardly ever described and thus the point at which saturation was assumed is unclear, i.e., whether sampling was terminated as soon as there were no additional concepts observed, or whether extra interviews were analysed to assure that there was no more new information before concluding the data to be saturated. While Braun and Clarke (2006) argue extensively how thematic analysis should be conducted, little information is given on data saturation. This issue is relevant when researchers are interested in examining common views held by a certain group of people. It is generally unrealistic to conduct interviews with a whole population and therefore the issue of what is a suitable and sufficient sample size emerges.
The above issue appears to be partly due to the lack of a clear definition of the meaning of saturation in a data set, and a demonstration of how it was achieved. For example, the saturation point will differ if researchers are interested in a higher level concept, such as the effect of general physiological symptoms on people's well-being, as contrasted with a lower level concept, such as the effect of different types of sensory symptoms on well-being. Studies on the higher level concept would group various types of symptoms under the concept of ‘physiological symptom,’ while for the lower level concept, the group would comprise a list of various sensory symptoms and their distinct differences from each other. Hence, as argued by Bowen (2008), providing the meaning of saturation within the context of a particular study is essential to understanding the “saturation” the authors claim to have achieved. A clear description of the saturation process, including the development of a codebook, serves as justification for the sample size, in many cases questioned by quantitative researchers and reviewers.
To our knowledge, only one study has demonstrated the process of saturation. Guest and colleagues undertook 60 interviews in Ghana and Nigeria (Guest, Bunce, & Johnson, 2006). They described the systematic approach they took, the sequential modification of the codebook as new sets of interviews were added, and demonstrated how saturation was observed after the first 12 interviews. Their study provides detailed information on how a systematic procedure should be documented to justify saturation. The present study adds to their substantial work by defining the meaning of saturation in the context of a current study, and by providing information on initial stage of the development of the codebook—, i.e., how an inductive approach was employed to develop the codebook. This information is also often poorly documented in previous studies, lessening the credibility of the analysis.
This is an exploratory report with the objective of identifying a saturation point while demonstrating the development and modification of the codebook used in the thematic analysis. In this study, the term “saturation” is used to refer to the point where there is no additional information in terms of a higher level concept and definitions of concepts for the codebook.
Study Background
This study is a part of larger project being conducted at one National Health Service Foundation Trust in North West England, UK. The data presented here is based on 39 in-depth interviews with individuals with multiple sclerosis (MS), described as a chronic inflammatory disease of the central nervous system, affecting physiological, emotional, and cognitive mechanism due to disturbed communications in the nervous system. The aim of this paper is not to discuss the findings from the main project; they will be reported elsewhere.
The objective of the main project is to understand quality of life (QoL) in different neurological conditions, including MS. The main study aims to identify factors that are influential to QoL of individuals with the neurological condition. The projects consists of both qualitative and quantitative phases and the findings from these phases will be used to generate a model of QoL that will reflect both universal influential factors over different neurological conditions and factors that are unique to certain conditions.
The current study was conducted as the first phase of the main project, which played a significant role in understanding QoL as described by participants themselves. Using a qualitative method is advantageous in discovering what underlines the surface, providing insights into both ‘how’ and ‘why’ questions (Chamberlain, 2000). The effort was made to understand why certain factors are important for patients, and how those factors affect their quality of life.
Method
Ethical Concerns
All potential participants were provided with a Participant Information Sheet which explained their involvement in the study and their right to withdraw from the study, or not to answer any particular question. It was assured that their decision would not affect their future treatment. Participants were encouraged to ask questions about the study and the consent was not obtained until patients had enough time to consider their participation. The main project was approved by the local Research Ethics Committee for the North West regions in the UK.
Participants
The current study used both opportunity sampling and purposive sampling (Langdridge, 2004; Tongco, 2007). More specifically, an opportunity sampling was used at the initial phase of recruitment at outpatient clinics for MS at the Walton Centre NHS Foundation Trust. The potential participants were first approached by a neurologist [CAY]. Those patients who showed an interest were then given further written information by another researcher [HA]. After recruiting a few patients, purposive sampling was then used to make sure that persons with all subtypes of the condition were recruited: primary progressive MS (PPMS), secondary progressive MS (SPMS), and relapsing-remitting MS (RRMS). In addition to the three subtypes of MS, individuals with the very active form of RRMS were additionally recruited: rapidly evolving MS (REMS). REMS has been defined by two or more disabling relapses in one year, and one or more gadolinium enhancing lesions on an MRI or a significant increase in T2 lesion load as compared with a previous recent MRI (Rudick, Stuart, Calabresi, Confavreux, Galetta, Radue, et al., 2006). The addition of this subtype of MS was considered important to understand the effect of a more aggressive condition. Other personal factors for identifying potential participants for purposive sampling were: gender, illness duration, disability level, and age.
General inclusion criteria for the study were: diagnosis with MS, ability to give informed consent, age over 18 yr., and verbal or written communication ability. Exclusion criteria were: inability to give informed consent, or concomitant serious medical or psychiatric condition.
The demographics of participants recruited for individual interviews are shown in Table 1. The higher ratios of female participants in RRMS and SPMS reflect greater incidence rate of the conditions in females compared with males in these subtypes (Alonso, Jick, Olek, & Hernán, 2007). Figure 1 shows the severity of physical impairment measured by Expanded Disability Status Scale (EDSS) (Kurtzke, 1983). EDSS indicates the disability level of patients using a 0–9.5 scale. EDSS was divided into four categories (Mills & Young, 2011): fully ambulatory for at least 500 m without aid or rest (0–4.0), mobile for 20–300 m with aids if needed (4.5–6.5), unable to walk beyond 5 m even with aid (7.0–7.5), and chair- or bed-bound (8.0–9.5). Due to the trajectory of the condition, having developed from relapsing-remitting type to a progressive form, patients with SPMS tended to have longer illness duration and only progressive type of MS (i.e., PPMS and SPMS) reported severe disabilities measured by EDSS.
Demographics of Patients Participating in Individual Interviews


EDSS distributions within multiple sclerosis subtypes: PPMS = primary progressive, SPMS = secondary progressive, RRMS = relapsing-remitting; REMS = rapidly evolving.
To analyse the data inductively to go beyond description, yet to avoid information overload, the analysis procedure started with a set of six interviews with participants with SPMS to develop a codebook, based on Guest, et al.'s (2006) statement that six interviews provided sufficient data to support their themes and further interviews helped them to refine the findings. Each transcript was inductively analysed using thematic analysis. The demographics of the initial six SPMS patients are shown in Table 2. This subtype was chosen for this process considering the unique experiences of having both relapsing-remitting and progressive nature of MS. As seen in the Table 2, no patient was categorised in the best mobility range measured by EDSS (i.e., 0–4.0) and this reflects the trajectory of SPMS having developed from RRMS. A letter ‘t’ after the MS subtype in the participant ID indicates telephone interview, while ‘f’ indicates face-to-face interview.
Demographics of Six Participants For Initial Codebook Development

Procedure
Individual interviews were conducted either by face-to-face or by telephone, depending on patient's preference and convenience. It was preferred that interviews were conducted face-to-face where possible. Telephone interviews were undertaken where requested for the convenience of patients, especially if they had to travel a long distance; all face-to-face interviews had to be conducted at the study site. The lack of an option to have a home visit for an interview was not observed to have any effect on participation in the study. Interviews were conducted verbally and all interviews were between 20 min. and 90 min. long, with a few exceptions in which the interview lasted for about 120 min. Semistructured interviews were employed to allow the researcher to be flexible in exploring any relevant and interesting matters mentioned by participants (Smith & Osborn, 2008). The interview schedule was developed by two authors [HA and RC] to explore important factors regarding quality of life of individuals with MS. A few examples of questions asked during the interviews were: “How do you describe your quality of life now?” “What are the things which positively affect your quality of life?” “Has there been anything that negatively affected your quality of life? If so, what are they?” Participants were also encouraged to talk about anything they felt was relevant to the study. All the interviews were conducted by HA, who also transcribed the interviews supported by two employees at the study site and one volunteer undergraduate student. A guideline for transcription was given to avoid inconsistent styles of transcripts. Demographics of the participants were collected at the time of interview, including date of birth, participant's sex, illness onset, illness duration, and disability level as measured by EDSS.
Analysis
The analysis process involved two stages in order to develop and refine a codebook. The first stage was an inductive approach to develop a codebook from six transcripts using thematic analysis. The codebook was then applied to the rest of the transcripts for modifications of both codes and their definitions.
During the first stage of the inductive analysis, a guide for thematic analysis documented by Braun and Clarke (2006) was modified to create a codebook and explore sample size, using an inductive approach to analyse data that are obtained through semi-structured interviews. The modifications to their analysis are clearly stated in this section. The analysis consisted of multiple phases with the first phase focusing on the familiarisation of the data. The analysis was conducted by HA. Although there is a trend of triangulation of analysis by more than two researchers, this method has been criticized to be problematic by interpretive researchers since it both limits the interpretation (Manning & Cullum-Swan, 1994) and assumes objectivity (Silverman, 1993), which is a more relevant concept for positivists. Yardley (2000) also argues that the triangulation is simply an agreement on interpretations between researchers and thus is not free of subjectivity. Instead of triangulation, the validation of the current study was sought through committed and rigorous approach in handling of the data, which are made transparent so others can assess the credibility of the study (Yardley, 2000).
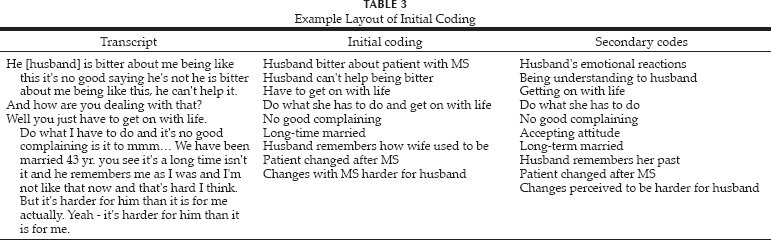
In order to reduce unbalanced familiarisation with a subset of data, interviews that were not transcribed by HA were checked with the audio interview for familiarisation and the accuracy. Once the accuracy was checked, all transcripts were read twice before the next phase of the analysis. Any comments were jotted down during the initial two readings. The next phase was to make initial coding throughout the transcript. The aim of this phase was to code as many meaningful segments as possible. It was important that the initial coding was carried out thoroughly, to reduce the chance of losing any potential theme. After the initial coding, all the codes were printed out, so they could be physically cut out of the paper and collated within codes. Although not included in the guideline written out by Braun and Clarke (2006), in an additional step, collated codes were given secondary codes to clarify the coding. Minimum interpretation of codes was made at this stage. All the analysis was done manually using Microsoft Word. Three columns were created for coding procedure, with the left column containing the transcript, the middle column for initial coding, and the right column for secondary codes (see Table 3 for an example, using quotes from SPMS-t 4).
Example Layout of Initial Coding
In the third phase of analysis, themes were searched as an initial interpretation of the data. All codes identified from the previous phase were grouped under potential themes. As for the next phase, Braun and Clarke (2006) originally outlined reviews and evaluations of themes within each interview before evaluations of themes over the whole data set, involving reviews of extracts. In the current study, however, the same process was applied at the code level rather than at the theme level for the purpose of generating a codebook. Evaluation at the code level was also perceived to prevent any loss of meaningful information. The relevance of codes was assessed over the whole data set, and modifications or revisions of codes were applied as required.
Results
Codebook Development
As a result of individual analysis with the six interviews, the number of codes found for each participant was 55, 28, 34, 44, 38 and 32, respectively. All codes from the six interviews were then collated to generate a codebook. During this process, some codes were found to be repetitive and were thus clustered under the same code. Consequently, the codebook comprised 39 codes in 7 themes. Each theme had from 1 to 14 codes. Once themes were identified with codes, a codebook with definitions for all codes was generated. Codes from all the initial six interviews with their tracking numbers were also added into the codebook, enabling traceback to the participant and initial codes. Examples of codes with their definitions are shown in Table 4.
Examples From Initial Codebook

Codebook Refinement
Codes and definitions were refined by applying them to the remaining interviews (n = 33). Modifications were made to code names and definitions as needed, and new codes were added. Examples of modifications to definitions and code names are shown in Table 5. The order of analysis was determined by the availability of transcripts, which in turn reflected the sequence of interviews.
Examples of Modification of Code Definition and Name

In total, 38 changes were made as a result of the additional 33 interviews: 12 new codes added, 9 code names modified, and 17 code definitions modified. No new theme was added; thus, there were seven themes from the six interviews that had served as basis for the initial codebook. Numbers of changes made after coding each transcript is shown in Fig. 2.

Number of changes made over the course of interviews for codebook development.
One of the two codes generated from RRMS-f 2 (11th transcript) was only relevant to RRMS and REMS patients (i.e., ‘impact of relapse’) and this was true for the modification of its definition made after REMS-f 4 (18th transcript). No other code was unique to any particular subtype of MS. The first six additional interviews made the biggest contribution to the modifications, with eight new codes, five modifications of code names, and seven modifications of code definitions. The refinement of the codebook was almost completed by 10 additional interviews: 83.3% of codes, 66.7% of code names, and 76.5% of code definitions had been modified by that time. Only two codes were added after 10 additional interviews and the last six interviews added nothing to the codebook. The finalised codebook consisted of 51 codes in 7 themes.
Further Evaluation on Plausible Patterns in Code Occurrence Rate
Sex differences in code occurrence rates were taken into account, considering the first 12 transcripts included eight females, while the last 12 interviews had only six females. There was greater variation among men (M = 29.6, SD = 3.23, range = 25–39) than among women (M = 27.1, SD = 5.49, range = 16–37), but this difference was not statistically significant (t37 = 1.53, ns). The first and last six interviews were compared in terms of code occurrence rates. This was significant (t10 = −4.83, p < .01) with greater mean code variation for the first six interviews (M = 26.2, SD = 2.14) than the last six interviews (M = 33.3, SD = 2.94). The same procedure was taken for the first and last 12 transcripts and the difference in code variation was still significant (t22 = −3.30, p < .01). The mean code variation for the first 12 interviews was 25.4 (SD = 3.70), while 30.7 (SD = 4.10) for the last 12 interviews. Code occurrence rate for each MS subtype was examined, keeping in mind that the first six interviews were conducted with SPMS patients. The mean code variation for PPMS, SPMS, RRMS and REMS was 31, 26, 29 and 27, respectively. This difference between the subtype was not significant (F3, 35 = 2.77, ns).
Discussion
The goal of this study was to identify a sufficient sample size for thematic analysis. It was observed that 12 interviews provided all themes with most codes. Further interviews after 12 were mainly for modifications of codes in that the modified codes and definitions were more inclusive and general. Although the difference was small, perceived difference in code occurrence rate between sexes may reflect different general social skills. Riggio (1986) found that females scored higher on skills to code and decode nonverbal emotions than male participants. Women's superior decoding skill was supported by an experimental study using the Reading the Mind in the Eyes Test (Baron-Cohen, Jolliffe, Mortimore, & Robertson, 1997). It is therefore plausible that the female participants nonverbally communicated their emotions, leading to reduced verbal communications compared to the male participants. Similarly, there may have been a double effect, considering that the interviewer was also female. Nevertheless, it should be confirmed that follow-up questions were always made for concepts poorly explored by the participants; no presumptions were made of meanings.
As regards the greater variation in code occurrence rate seen in the female participants, ranging between 16 and 37, higher emotional intensity in reports by women has been previously observed. Despite little difference on experience of range of emotions between the sexes, Barrett, Robin, Pietromonaco, and Eyssell (1998) found that women rated their emotional intensity higher than men, who in turn have been reported to have a trend to control both interactions with others (Barrett, et al., 1998) and their emotions (Riggio, 1986). Applying these findings to the present study, then, it may be that men attempted to control the conversation during the interview by talking with their emotion reasonably well controlled, while some female individuals may have been disturbed while describing their experiences, due to the emotional intensity. These speculations must be tested in future research. It is to be remembered, however, that the difference in code occurrence rate between the sexes was small in the current study and this may reflect the argument that the different cognitive styles perceived between the sexes are results of personality differences, not sex (Baron-Cohen, 2002).
The first and last six transcripts were compared in terms of their rate of code occurrence to examine whether there was a bias in developing the codebook by including more communicative participants in the first set. Such a bias would challenge the arguments about sample size for saturation. It was found that the first set of transcripts yielded lower code occurrence rate per individual compared to the last group. Thus, 12 interviews are sufficient to generate codes for thematic analysis where higher level concepts are being investigated. The higher code occurrence rate observed in the later interviews is likely to be a reflection of improvement in interviewer's knowledge on narratives and interview skills.
Limitations
A limitation of this study was the different styles of interviews, face-to-face and by telephone. Indeed, the different code occurrence rate observed between the former and latter group of participants may have been due to the interview styles. Of 12 first interviews, 10 were conducted over the telephone, while only one interview was by telephone among the last 12 interviews. Although it would not challenge the sample size for saturation, considering 83% of the first group had telephone interviews, further investigations of the interview format and its influence on the code occurrence rate is warranted.
A further limitation was the initial group consisted of just one subtype, SPMS. This group was purposefully chosen for their unique experiences of having gone through relapse and progressive phases of the condition. In retrospect, this subtype was found to have generated the lowest code occurrence rate in comparison with others, further affirming 12 to be a sufficient number of interviews. Nevertheless, readers should be aware of potential bias in developing a codebook.
Conclusion
In conclusion, this exploratory study showed that 12 interviews provided all the themes and 92.2% of codes; thus 12 should be a sufficient sample size for thematic analysis where higher level concepts are concerned. Guest, et al. (2006) also reported 12 to be a sufficient number of interviews for a relatively homogeneous group. In the current study, this was observed among individuals with MS despite differences in illness duration and disability level between subtypes of MS. The differences between MS subtypes were found to be minor, with only one subtype-specific code identified. The current study demonstrates a rigorous and transparent process of analysis and all qualitative researchers are encouraged to follow this procedure. Such reports not only demonstrate the rigorous approach required in qualitative research, but ultimately allow replication of findings.