
Abstract
Some scholars have argued for fixed standards for null hypothesis significance testing, using only .05 as the criterion for assessing or reporting statistical significance. One might get an impression that no credible scholars have ever succeeded in publishing results in high-impact factor, peer-reviewed journals using any other criteria. Here, we point out that not only are there sound theoretical arguments for flexibility in the choice of alpha or the reporting of statistical results, but that peer-reviewed articles have been published both recently and in the past in major social science research journals using more flexible statistical standards. In particular, we review the reporting of statistical trends (p < .10) in seven major scholarly journals from 2005 to 2009, as well as in 2013 for two of those journals. Sample size was not significantly correlated with whether or not articles in one journal reported results for which p < .10. The use of less conservative levels of alpha or the reporting of statistical trends should not be used against the credibility or scientific soundness of either scholars or their research.
Gliner, Morgan, and Leech (2009) have discussed two approaches to the reporting outcomes of statistical tests—the null hypothesis significance testing (NHST) approach and what they describe as “the evidence-based approach” (p. 247, assessing confidence intervals and effect sizes, often summarized across numerous studies in meta-analyses). They discussed many of the limitations of NHST (pp. 240–243). With respect to NHST, for some time there have been concerns, and even controversy (Leahey, 2005), about using .05 as the standard convention for alpha in statistical testing as well as the appropriateness of reporting statistical trends where p > .05. On one extreme, some scholars may never want to use anything other than .05 for alpha or never to report any results for which p > .05. Other scholars have made contrary arguments. Reflecting the controversies surrounding these issues, the senior author (Schumm, 2010, p. 955) has previously reported viewpoints from a number of other scholars who have argued in favor of a less rigid approach to NHST in terms of matters of statistical significance. In order to increase statistical power for small samples or with exploratory studies, some scholars have recommended using one-tailed tests when hypotheses are unidirectional (Katz, 2006, p. 132) or using a less conservative alpha level (Cohen, 1992, p. 156; Katz, 2006, p. 74; Salkind, 2004, p. 159; Sullivan, 2007, p. 510; Warner, 2008, p. 89) than the conventional .05 level. If the research objective is to affirm a null hypothesis, Lerner and Nagai (2001, p. 99) have argued for using an alpha of .10 or even higher. The conventional alpha is not better or inherently more correct than other criteria (Katz, 2006, p. 132), nor is it more sacred (Cohen, 1994). Sullivan (2007, p. 510) has argued that the alpha level should be allowed to vary, depending on the relative seriousness of Type I and Type II errors, a viewpoint reaffirmed more recently by Baker and Mudge (2012) and Warner (2013).
Thus, as noted in the previous quote, some scholars have argued that in situations involving (1) small samples, (2) samples with low statistical power, (3) studies with one-sided hypotheses, or (4) studies attempting to affirm a null hypothesis, there are sound reasons to consider adopting a less conservative alpha. Unfortunately, proponents of more rigid or fixed standards for statistical hypothesis testing have seemed to overlook the facts that (1) α = .10 has, in fact, often been used and that (2) many credible scholars have reported statistical trends as part of their results in high impact scholarly journals.
Method
To demonstrate these two points, that some scholars have used less conservative alphas while others have reported statistical trends, first we will cite numerous occasions when credible scholars have used or appear to have used implicitly α > .05 in peer-reviewed scholarly journals or books. Second, we will discuss numerous occasions when credible scholars have reported statistical trends (p < .10) among their results in scholarly peer-reviewed journals.
Third, we will enumerate the reporting of statistical trends in seven major scholarly journals over a five-year period. The first author selected seven journals for review. Three of the journals were sponsored by the American Psychological Association (Developmental Psychology, Journal of Family Psychology, Journal of Clinical and Consulting Psychology) as a sample of journals oriented to human development, family studies, and service delivery. Two of the journals were sponsored by the National Council on Family Relations (Journal of Marriage and Family and Family Relations), with the intent to select one journal associated with family studies and the other with service delivery. The journal Child Development was selected because of its flagship status for topics related to human development at younger ages. The last journal selected was the American Journal of Public Health, selected to represent medical journals that often have an interest in human development or family-related issues. The second author reviewed these seven scholarly journals over a five-year period, 2005–2009 and determined the percentage of articles that reported at least one finding for which p < .10.
Results
Use of Alpha > .05
A number of scholars have used a criterion for statistical significance less conservative than α = .05. Lamb (1978b) reported a substantive result in his abstract based on p > .05: “Knowledge of the security of either parent-child relationship facilitated prediction (p < .06) of the nature of the other relationship …” (p. 265). D'Andrea (1984) used a one-tailed t test with p < .05 (essentially p < .10 with a two-tailed test) in evaluating the outcome of a program concerning the transition to parenthood. Hawkins, Lovejoy, Holmes, Blanchard, and Fawcett (2008) concluded that “the treatment group fathers were more involved in child care than control group fathers, and this finding was replicated in a second evaluation study” (p. 57) although both were significant only at p < .10.
Hawkins, Blanchard, Baldwin, and Fawcett (2008) reported results in which p > .10 was non-significant, but identified those with p < .10 as a trend, using a single asterisk to denote significance levels at p < .10 in Table 1 (p. 726); furthermore, they concluded that “MRE produces modest but reliable effects” (p. 730) even though in their primary table of 24 outcomes, eight were identified as non-significant (p > .10) and five others as trends (p < .10), with only eleven significant (six, p < .05 and five, p < .01). Frisco and Williams (2003) used p < .10 with a one-tailed statistical test, essentially using the equivalent of p < .20 with a two-tailed test. Issod (1987) may have used the same approach as Frisco and Williams, combining a one-tailed t test with p < .10, citing a small sample size (N = 8 couples). Kaplan and Rosenmann (2012) used a one-sided hypothesis (p. 430) but retained α = .05 (p. 431) for their statistical tests; consequently, with their smaller sample sizes, effect sizes as large as 0.40 were not found to be significant statistically. Without stating that they were using one-sided tests or α = .10, Golombok and Tasker (1996) reported one-sided Fisher Exact Test results in their comparisons of the children of lesbian and heterosexual mothers (Table 2, p. 8).
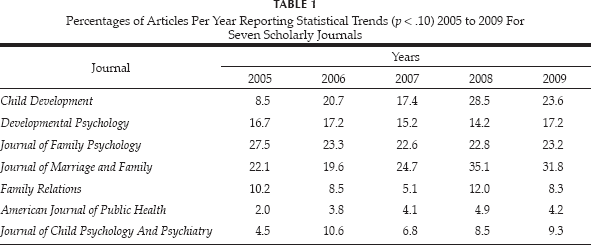
Percentages of Articles Per Year Reporting Statistical Trends (p < .10) 2005 to 2009 For Seven Scholarly Journals
Clearly, the use of α = .10 has occurred in a wide variety of scientific peer-reviewed journals. Warner (2013, p. 89) has reiterated the appropriateness of using, for exploratory research, levels of α that are less conservative. Using too strict of a criterion for statistical significance can be helpful for promoting incorrect findings of “no difference” or failures of not rejecting the null hypothesis when it should have been rejected (Schumm, 2012). Stacey and Biblarz (2001) agreed that “… for very small samples … conventional levels [of significance] can actually be too restrictive” (p. 168). Recently, Baker and Mudge (2012) have argued for the use of an “optimal α” where the relative benefits and risks of type I and type II errors are considered jointly in determining the criterion of statistical significance, rather than blindly using α = .05. As an example of how statistical choices can make an apparent difference, Golombok and Tasker reported non-significant results across the two types of parents for the mothers' children's Adult Kinsey Scale ratings, with an apparent pooled variance t43 = 1.65 (p < .11). However, the Levene test of homogeneity of variance was significant (p = .003), indicating that use of a separate variance t test was more appropriate, in which case t26.65 = 1.83 (p < .08, two-tailed, but p < .04 one-tailed, consistent with their use of one-tailed tests in the other tests of significance in Table 2). In other words, had Golombok and Tasker (1996) used the appropriate t test and consistently applied their criterion of a one-tailed test, they would have reported their findings as statistically significant rather than non-significant.
Even Leahey (2005), who argued that the use of α = .05 has become the dominant level for testing statistical significance, acknowledged that “the choice of alpha level should technically depend on sample size, statistical power and sampling procedures” (p. 1) and that the use of the .05 level may often not be “suitable for specific analyses (p. 2). Leahey (2005, p. 3), in her assessment of several sociological journals, found that 10% of the articles she surveyed had used the .10 alpha level for significance testing. Likewise, even though Gliner, Morgan, and Leech (2009) were not in favor of using less conservative alpha levels, they admitted that their reasons were mostly based on convention and could be overlooked in, for example, “a clearly exploratory small sample study” (p. 240); they also acknowledged that “Certainly a finding with a p value of .06 should add almost as much supporting evidence for a hypothesis as finding p values of .05 or .04” (p. 242). Their comment echoed what Rosnow and Rosenthal (1989) had stated decades earlier: “… that, surely, God loves the .06 nearly as much as the .05. Can there be any doubt that God views the strength of evidence for or against the null as a fairly continuous function of the magnitude of p?” (p. 1277). Despite the controversy, it is clear that some credible scholars have, at least on occasion, used alpha levels greater than .05 for assessing statistical significance. On the other hand, use of greater levels of alpha entails a risk of more type I errors.
Recency Check.—It is possible that in recent years, scholars may have not used less conservative values for alpha. However, recently Hawkins, Amato, and Kinghorn (2013) in Family Relations used α = .10 as their primary statistical criterion, stating that “Because the risk of a type II statistical error (a false negative) is relatively high with a sample of 51 cases, we adopted a .10 alpha for significance testing” (p. 507). Likewise, Potter (2012) in an article in Journal of Marriage and Family used α = .10 (p. 564) as his primary statistical criterion, even though he had a large sample size (N = 19,107). Thus, it appears that at least some credible scholars are using a .10 level for alpha in very recent, peer-reviewed, scholarly publications in high-impact factor journals such as Family Relations and the Journal of Marriage and Family.
Reporting of Statistical Trends (e.g., p < .10)
Schumm (2010, p. 955) has cited numerous examples of scholarly research in which results for p < .10 had been reported (Buunk, Doosje, Jans, & Hopstaken, 1993; Cochran & Mays, 2007; Frisco & Williams, 2003; Golombok, Perry, Burston, Mooney-Somers, Stevens, & Golding, 2003; Mays & Cochran, 2001; Sprecher, 1998), even when p < .05 may have been used as the criterion for statistical significance. Many others (not cited in Schumm, 2010) have reported results where p < .10 (e.g., Barrett & Tasker, 2001; Broberg, Lamb, & Hwang, 1990; Cardell, Finn, & Marecek, 1981; Carrere & Gottman, 1999; Feeney, Alexander, Noller, & Hohaus, 2003; Fincham & Bradbury, 1992; Fouts, Hewlett, & Lamb, 2012; Fouts, Roopnarine, & Lamb, 2007; Fouts, Roopnarine, Lamb, & Evans, 2012; Golombok, Spencer, & Rutter, 1983; Gottman, Coan, Carrere, & Swanson, 1998; Gottman & Levenson, 1999; Gottman & Levenson, 2000; Hawkins, Carrere, & Gottman, 2002; Hershkowitz, Fisher, Lamb, & Horowitz, 2007; Lamb, 1977; Lamb, 1978a, b; Lamb, Elster, & Tavare, 1986; Lamb & Garretson, 2003; Lamb, Hwang, & Broberg, 1989; Lamb, Sternberg, Esplin, Hershkowitz, Orbach, & Hovav, 1997; Roberts & Lamb, 2010; Shapiro & Gottman, 2005; Shapiro, Gottman, & Carrere, 2000; Sternberg & Lamb, 1992; Sternberg, Lamb, Greenbaum, Cicchetti, Dawud, Cortes, et al., 1993; Sternberg, Lamb, Hershkowitz, Yudilevich, Orbach, Esplin, et al., 1997; Thierry, Lamb, & Orbach, 2003), including reports with entire tables in which p<.10 outcomes are noted (Amato & Cheadle, 2005; Bos & Hakvoort, 2007; Lamb, Orbach, Sternberg, Aldridge, Pearson, Stewart, et al., 2009; Lindsey, MacKinnon-Lewis, Campbell, Frabutt, & Lamb, 2002; Sternberg, Lamb, Guterman, & Abbott, 2006; Lavner, Waterman, & Peplau, 2012; Shapiro, Nahm, Gottman, & Content, 2011; Tamis-LeMonda, Shannon, Cabrera, & Lamb, 2004; Wainright & Patterson, 2006).
Reporting of Statistical Trends in Selected Scholarly Journals
With respect to the reporting of statistical trends in the seven scholarly journals selected, we found—as presented in Table 1—that the reporting of statistical trends (p < .10) was rather widespread, a situation contradicting any idea that p < .05 is the only accepted scholarly criterion for interpreting scientific results or outcomes as meaningful. While some journals had lower rates of reporting statistical trends than did other journals, all of the journals did allow occasional reporting of statistical trends (p < .10) in some of their articles. From 2005 to 2009, the percentage of articles reporting results for p < .10 increased from 9.2% to 13.1%, contradicting any possible notion that the use of p < .10 was on a decline as “scholarship” was improving. It remains an open question of how other factors were changing over time, such as the statistical power of the samples used. Using 136 empirical, statistically-based articles from the Journal of Marriage and Family for the years 2005 and 2009, it was found that the sample sizes used in those reports were not significantly correlated (linearly, either using Pearson's zero-order correlation or Spearman's rho) with whether or not the articles had reported results for which p <.10, for either year or for both years combined, nor were there any significant nonlinear trends detected. This particular result may indicate that the reporting of results for which p < .10 is not a matter of compensating for smaller sample sizes or for lower statistical power; in fact, one-third (4/12) of the articles that involved samples of more than 10,000 participants reported results for which p <. 10.
Recency Check.—It is possible that scholars less frequently report statistical trends. Recently, numerous articles published in Family Relations and Journal of Marriage and Family have reported results where p <.10 (De Henau & Himmelweit, 2013; Dunifon, Kalil, Crosby, Su, & DeLeire, 2013; Gudmunson & Danes, 2013; Memili, Zellweger, & Fang, 2013; Nomaguchi & DeMaris, 2013; Wilson & Huston, 2013). These examples are evidence that credible scholars have continued to report statistical trends in addition to results for which p <.05 in high-impact factor, peer-reviewed social science journals.
Conclusion
In conclusion, the use of less conservative alphas for hypothesis testing is not only justifiable in some circumstances according to many scholars, but has also been widely used by many credible scholars in numerous articles in high-impact factor, peer-reviewed social science journals. Arguments that α < .05 is the only criterion for assessing statistical significance are invalid both in theory, especially for exploratory research with small samples, and in actual practice in the social sciences. Selection of an appropriate criterion for assessing statistical significance should rest upon the relative importance of the consequences of Type I and Type II errors for each particular scientific study (Baker & Mudge, 2012). At the same time, some continue to argue that the increasing use of α < .10 and reporting of statistical trends (p < .10) may entail a risk of eroding “the value of research findings” (Goldstein, 2010, p. 59). On the other hand, if scholars faithfully report results near significance (e.g., p < .10), it allows others to test for publication bias (Gerber, Green, & Nickerson, 2000; Gerber & Malhotra, 2008).
Recently, the American Psychological Association has begun to recommend reporting all p values, regardless of their level of significance (Cooper, 2011, p. 61). Of course, as Leahey (2005) indicated, “because statistical significance testing is based on normal distribution theory, it should only be performed on samples obtained via probability sampling techniques” (p. 2), a rule that has often been violated in social science research. Of course, effect sizes and/or confidence intervals should be reported, along with significance levels, when reporting research (APA, 2010, p. 34; APA Publications and Communications Board Working Group on Journal Article Reporting Standards, 2008; Cooper, 2011, p. 31; Wilkinson & the Task Force on Statistical Inference, 1999). Because statistical power varies directly with sample size, it is important to consider statistical power and the magnitude of effect sizes when interpreting research results, especially when sample sizes are smaller (Johnson & Bachan, 2013). It is our informal estimate that the reporting of effect sizes has increased in the past ten years. In some cases, the use of less conservative levels of alpha may reflect more carelessness on the part of some researchers rather than careful attention to the relative risks and consequences of type I and type II errors or to obtaining larger, random samples. In fact, the reporting of results for p < .10 did not appear to be related to sample size. Nevertheless, it is clear that no research (nor scholars) should be discredited solely on the basis of the use of less conservative alpha levels or for reporting statistical trends in addition to results for which p <.05.