
Abstract
Programmed cell death (apoptosis) is a ubiquitous means utilized by multicellular organisms for elimination of unwanted cells during development and homeostasis. Dysregulated apoptosis is implicated in an array of clinical disorders including cancer, autoimmune diseases, neurodegenerative disorders, and ischemia. During programmed cell death, a series of proteases, known as caspases, with different specificities play crucial roles in the apoptotic process. Caspase-3, a group II cysteine aspartate protease, recognizes and cleaves substrates harboring the amino acid sequence aspartic acid–glutamic acid–valine–aspartic acid (DEVD), and it plays an important role in the terminal phase of apoptosis. Here we report the development of a novel imaging platform for sensing the activation of cellular proteases. A recombinant chimeric protein was constructed, composed of a cell-surface-targeted single-chain antibody (sFv) fused to a Golgi retention signal. The DEVD tetrapeptide sequence was included between the single-chain antibody and the Golgi retention signal as a caspase-3 protease cleavage site. When expressed in cultured cells this fusion protein was localized to Golgi bodies and was not detected on the cell surface. Induction of apoptosis resulted in cleavage of the fusion protein releasing the single-chain antibody from the Golgi retention signal in a caspase-dependent manner. As a result, in cells undergoing apoptosis the single-chain antibody was visualized at the cell surface by immunofluorescence microscopy. The expression of sFv on the surface of cells in a protease-dependent manner provides a unique opportunity for real-time imaging through the use of targeted nanoparticles. This methodology may provide for a multimodal noninvasive real-time imaging of apoptosis and a new opportunity for high-throughput screening of cell-death-modulating therapeutic agents.
Introduction
Advances in cellular and molecular biology in the past century have impacted our understanding of the role of different molecular events in human pathology such as the complex signaling networks evident in the cell. Although the roles of several molecular players involved in modulating physiological abnormalities have been construed in vitro, the true impact of these advances in molecular characterization have been more difficult to evaluate in vivo [1]. As a result, the majority of oncological imaging is relegated to obtaining anatomical information based on differences in physical parameters to generate image contrast, thus providing a frozen snapshot of tissue structure at the time of sample retrieval, and fail to provide any information on the dynamic changes within the malignancy and its milieu [1–3]. Therefore, innovative developments in imaging biomarkers and their pathways are required to allow noninvasive real-time detection of single specific intracellular enzymatic events. Recent efforts in developing suitable probes for noninvasive visual representation of biological processes at the cellular and molecular level in the whole organism and the modalities and instrumentation to support the visualization and measurement of these processes are an attempt to bridge the gap between discovery of important cellular processes and the ability to image them [3–9]. Proteases play a pivotal role in several normal as well as pathological processes [10,11]. Their role in tumor metastasis, inflammation, and thrombosis has been studied extensively [10–13]. In an effort to develop a noninvasive strategy for imaging of the specific proteases, we have utilized caspase-3, a key mediator of apoptosis, as a model system.
Apoptosis, or programmed cell death, is characterized by cell shrinkage, membrane blebbing, chromatin condensation, DNA fragmentation, and selective activation of caspases and subsequent cleavage of specific target proteins [14–17]. It may be initiated extrinsically by activation of death receptor by their ligands such as TRAIL or intrinsically by inhibitors of cellular pathways such as protein kinase inhibitor, staurosporine [17,18]. In both the extrinsic and intrinsic pathways caspases play a central role as molecular initiators and executors of apoptosis [15,17–20]. The activation of caspase-3, the converging point of protease cascade in both intrinsic and extrinsic apoptotic pathways, imposes the apoptotic morphology by cleaving key cellular proteins [15,19,20].
Apoptosis is essential for normal physiology in most organisms as a coordinated counteracting force to cell proliferation [14,15,21]. An imbalance in these two opposing processes results in various diseases, including AIDS, neurodegenerative disorders, myelodysplastic syndromes, ischemia/reperfusion injury, cancer, and autoimmune disease, among others [15,17–19,22–25]. Thus, the development of molecular imaging strategies that allow noninvasive monitoring of apoptosis would greatly aid identification of therapeutic agents for the pathologic states that involve an imbalance in cell death. Such imaging strategies may be based on specific molecular mediators of apoptosis such as caspases [17,19,26]. The ability to noninvasively image the activation of these zymogens would provide an opportunity to evaluate therapeutic interventions.
We previously reported the development of a novel chimeric luciferase reporter molecule that when expressed in mammalian cells has attenuated levels of bioluminescent activity [27]. In cells undergoing apoptosis, caspase-3-dependent cleavage of the recombinant product occurred, resulting in the restoration of luciferase activity, which could be detected in living animals by using bioluminescence imaging [27]. Here we report an alternate noninvasive apoptotic imaging strategy based on differential localization of a recombinant chimeric single-chain antibody. In growing cells the chimeric single-chain antibody resides in Golgi bodies, whereas in cells undergoing apoptosis in a caspase-3-dependent manner the recombinant single-chain antibody translocates to cell surface, allowing a ready means to image apoptotic cells. The ability to image apoptosis noninvasively and dynamically over time provides a new opportunity for high-throughput screening of pro- and antiapoptotic compounds and for target validation. In addition, this model serves as proof of principle for the more general application of real-time imaging of intracellular proteases.
Materials and Methods
Construction of Hybrid Molecules
Using pHook2 (Invitrogen, Carlsbad, CA) as a template for PCR, the membrane-targeted heme agglutinin (HA) and myc-tagged anti-phOx single-chain antibody imaging plasmid was constructed by using overlap PCR [28] and was termed the constitutive imaging construct (CIC). This expression cassette was cloned into the pEF vector, a derivative of pZ (kindly provided by the Genetics Institute), wherein the adenoviral major late promoter was replaced with mammalian elongation factor 1 alpha promoter. The inducible imaging construct (IIC) was a fusion between the coding sequence of CIC and the cytoplasmic tail of the Golgi resident protease, Furin, which has previously been demonstrated to mediate Golgi retention of proteins transiting the secretory pathway [29]. In addition, to generate caspase-3-specific liberation of this retention signal, the sequence coding for DEVD, a caspase-3 recognition and cleavage sequence, along with three glycine spacers, was placed between the CIC coding sequence and the Furin cytoplasmic tail. The amino acid sequence of the Furin cytoplasmic tail that allows the retention of the fusion protein in Golgi is QLRSGFSFRGVKVYTMDRGLISYKGLPPEAWQEECPSDSEEDEGRGERTAFIKDQSAL.
PCR primers utilized:
5′ CIC primer (GCCTCTAGAGCAATCATGGAGACAGACACACTCC)
3′ CIC with DEVD (for IIC) (ACCTCCACCATCGACTTCGTCTGCGGCAGCACGTGGCTTCTTCTGCC)
3′ CIC (GTCTCTAGACTACTAACGTGGCTTCTTCTGCC)
5′ Furin Golgi retention signal with DEVD (GAAGTCGATGGTGGAGGTCAGCTGCGCTCTGGC)
3′ Furin Golgi retention signal (GCTCTAGATCATCAGAGGGCGCTCTG)
Cell Culture, Transfection, and Reagents
COS-7 cells were grown in DMEM medium, whereas D54 (human glioma) cells were grown in RPMI 1640 medium both supplemented with 10% fetal bovine serum, 100 U/mL penicillin, 100 μg/mL streptomycin sulfate, 1 mM sodium pyruvate, 10 mM HEPES, 292 μg/mL
Western Blot Analysis
Cell extracts were prepared from cells expressing CIC or ICC for Western blot analysis using reporter lysis buffer (Promega, Madison, WI) and resolved on SDSPAGE followed by blotting to nitrocellulose membranes. The membranes were blocked in 5% nonfat powdered milk in Tris-buffered saline and probed by using antibodies against active caspase-3 (Chemicon, Temecula, CA), myc epitope (Affinity Bioreagents, Golden, CO, and Sigma, St. Louis, MO), or intact caspase-3 (Santa Cruz Biotechnology, Santa Cruz, CA), and HA tag (Covance, Richmond, CA).
Immunofluorescence
D54 cells expressing CIC or IIC were grown on gelatin-coated cover slips (cover slips were incubated with PBS containing 0.1% gelatin for 1 hr at 37°C and washed once with PBS) for 24 hr. Cells were then fixed using 3.5% paraformaldehyde for 15 min at room temperature (RT). For membrane staining, cells were blocked in PBS containing 1% BSA and 10% normal donkey serum for 1 hr at RT. For monitoring subcellular staining, cells were permeabilized using 100% prechilled methanol for 30 min at −20°C and rehydrated in PBS prior to blocking in PBS containing 1% BSA, 10% normal donkey serum, and 0.05% Tween 20 (all from Sigma) for 1 hr at RT. Both permeabilized and nonpermeabilized cells were then incubated in a humidified chamber at 37°C with myc tag (1:500) or HA tag (1:3000) antibodies in PBS containing 1% donkey serum. After 1 hr, cells were washed three times with PBS and incubated with Cy2- or Cy3-conjugated donkey antimouse IgG (Jackson Laboratory) at RT for 30 min. Prior to mounting, cells were either counterstained with DAPI, Sytox, or propidium iodide (Molecular Probes).
Cells were stained with NBD C6-ceramide as described [30]. For myc tag staining of the NBD C6-ceramide cells, cells were very briefly permeabilized with saponin and incubated with myc-tag antibody as described above.
Results
To develop imaging tools to monitor apoptosis, we employed a hybrid recombinant reporter molecule that included an HA- and myc-tagged single-chain antibody with specificity for the small molecule hapten 4-ethoxy ethylene 5-phenyl oxazol-5-one (phOx). To target this core to the cell surface it was coupled to an amino-terminal signal peptide and a carboxy-terminal platelet-derived growth factor receptor (PDGFR) transmembrane domain (Figure 1A). When expressed in cells, this recombinant protein (CIC) was localized to the cell surface, as schematically illustrated in Figure 1A. To develop a molecular platform to image caspase-3 protease activity we coupled a Golgi retention signal from the Furin protease, a trans-Golgi network proprotein convertase, at the C terminus of CIC. The CIC and the Furin Golgi retention signal were separated by a consensus caspase-3 recognition and cleavage sequence, DEVD (Figure 1B). This recombinant fusion protein was termed the IIC; when expressed in cells, IIC was hypothesized to reside in the Golgi, as schematically represented in Figure 1B. However, activation of caspase-3 during apoptosis was theorized to result in cleavage at the DEVD sequence that would free the CIC moiety from Golgi retention, thus allowing the translocation of CIC to its default location at the cell surface (Figure 1B) where its presence could be detected either by antibodies to the myc or HA tags or by exploiting the hapten–antibody interaction using labeled phOx. Because both intrinsic and extrinsic apoptotic pathways utilize activation of caspase-3, this engineered chimeric polypeptide was investigated as a novel reporter for detection of apoptosis.
To methodically assess this strategy, the expression and subcellular localization of CIC and IIC in COS cells was monitored using antibodies to the myc tag. Western blotting of lysates from transiently transfected COS cells indicated that CIC migrated as a 38-kDa and IIC as a 45-kDa protein (Figure 2A). COS cells transiently transfected with IIC and treated with staurosporine for 3 hr revealed the appearance of a 38-kDa band indicative of cleavage of the IIC, presumably at the DEVD sequence (Figure 2A). This cleavage was not seen in untreated control cells (Figure 2A). In addition, there was no change in the apparent molecular weight of the CIC following staurosporine treatment.
Immunostaining of COS cells transiently transfected with CIC or IIC was performed to assess the subcellular localization of these chimeric proteins. Cells transfected with CIC showed a predominant cell surface localization when nonpermeabilized fixed cells were stained with the anti-myc tag antibody (Figure 2B). However, as hypothesized, nonpermeabilized fixed cells overexpressing the IIC did not show significant cell surface fluorescence (Figure 2C), as this chimeric protein is postulated to reside in the trans-Golgi network. To confirm this intracellular retention, immunostaining using the myc tag antibody with permeabilized cells was performed, and IIC was demonstrated to be localized to Golgi bodies (Figure 2D, see inset). The Golgi localization was confirmed using NBD C6-ceramide and immunostaining with an antibody to Furin (data not shown). To investigate whether the cleaved IIC in apoptotic milieu results in translocation of the single-chain antibody to the cell surface, we performed immunostaining of nonpermeabilized staurosporine-treated COS cells transfected with IIC, and cell surface staining was visualized in cells with the characteristic appearance of apoptotic cells (Figure 2E, see inset) that was hitherto absent in nonapoptotic cells (Figure 2C).

Strategy for imaging of apoptosis based on conditional expression of single-chain antibody. (A) Constitutive imaging construct (CIC) was constructed from a single-chain antibody, signal peptide, HA and myc tags, and a transmembrane domain. When expressed in cells, this fusion protein would localize to cell surface. (B) The inducible imaging construct (IIC) was CIC engineered to contain a Golgi retention signal separated by caspase-3 recognition and cleavage sequence. When expressed in cells, this chimeric protein localizes to Golgi bodies. Induction of apoptosis leading to caspase-3 activation cleaves the chimeric protein, resulting in its translocation to cell surface.
To further confirm the utility of this strategy in monitoring cell death, we made stable lines using a human glioblastoma cell line (D54) expressing either CIC or IIC and evaluated the expression, subcellular localization, cleavage, and translocation of the peptide in response to apoptogenic agents. As with transient transfection of COS cells, CIC-expressing D54 cells, upon Western blotting, demonstrated a ~38-kDa band (Figure 3A) that was detected both in control as well as in TRAIL-treated cells. In contrast, IIC was detected as a 45-kDa protein in untreated cells, whereas after TRAIL treatment, a 38-kDa band was present that was consistent with the separation of recombinant single-chain antibody and the Furin Golgi retention signal following caspase-3-dependent cleavage of the DEVD sequence (Figure 2B). Pretreatment of IIC-expressing cells with ZVAD-fmk, a pan-inhibitor of caspases, prior to TRAIL treatment abolished the appearance of the 38-kDa band consistent with the caspase-dependent nature of the reporter construct (Figure 2B). As expected, ZVAD treatment had no impact on the apparent molecular weight of CIC. Similar results were obtained when antibody to HA tag was used to detect the chimeric fusion proteins (data not shown).
Immunostaining of nonpermeabilized fixed D54 lines stably expressing the CIC revealed cell surface staining (Figure 3C), whereas in nonpermeabilized D54 cells expressing the IIC no fluorescence signal was detected at the cell surface (Figure 3D). As demonstrated previously for COS cells, when D54 cells expressing IIC were stained with myc antibody after their permeabilization a distinct Golgi localization of immunostaining was evident (Figure 3E). Following the induction of the apoptosis by TRAIL treatment, cleavage of IIC (Figure 3B) and its translocation to cell surface were both observed (Figure 3F).
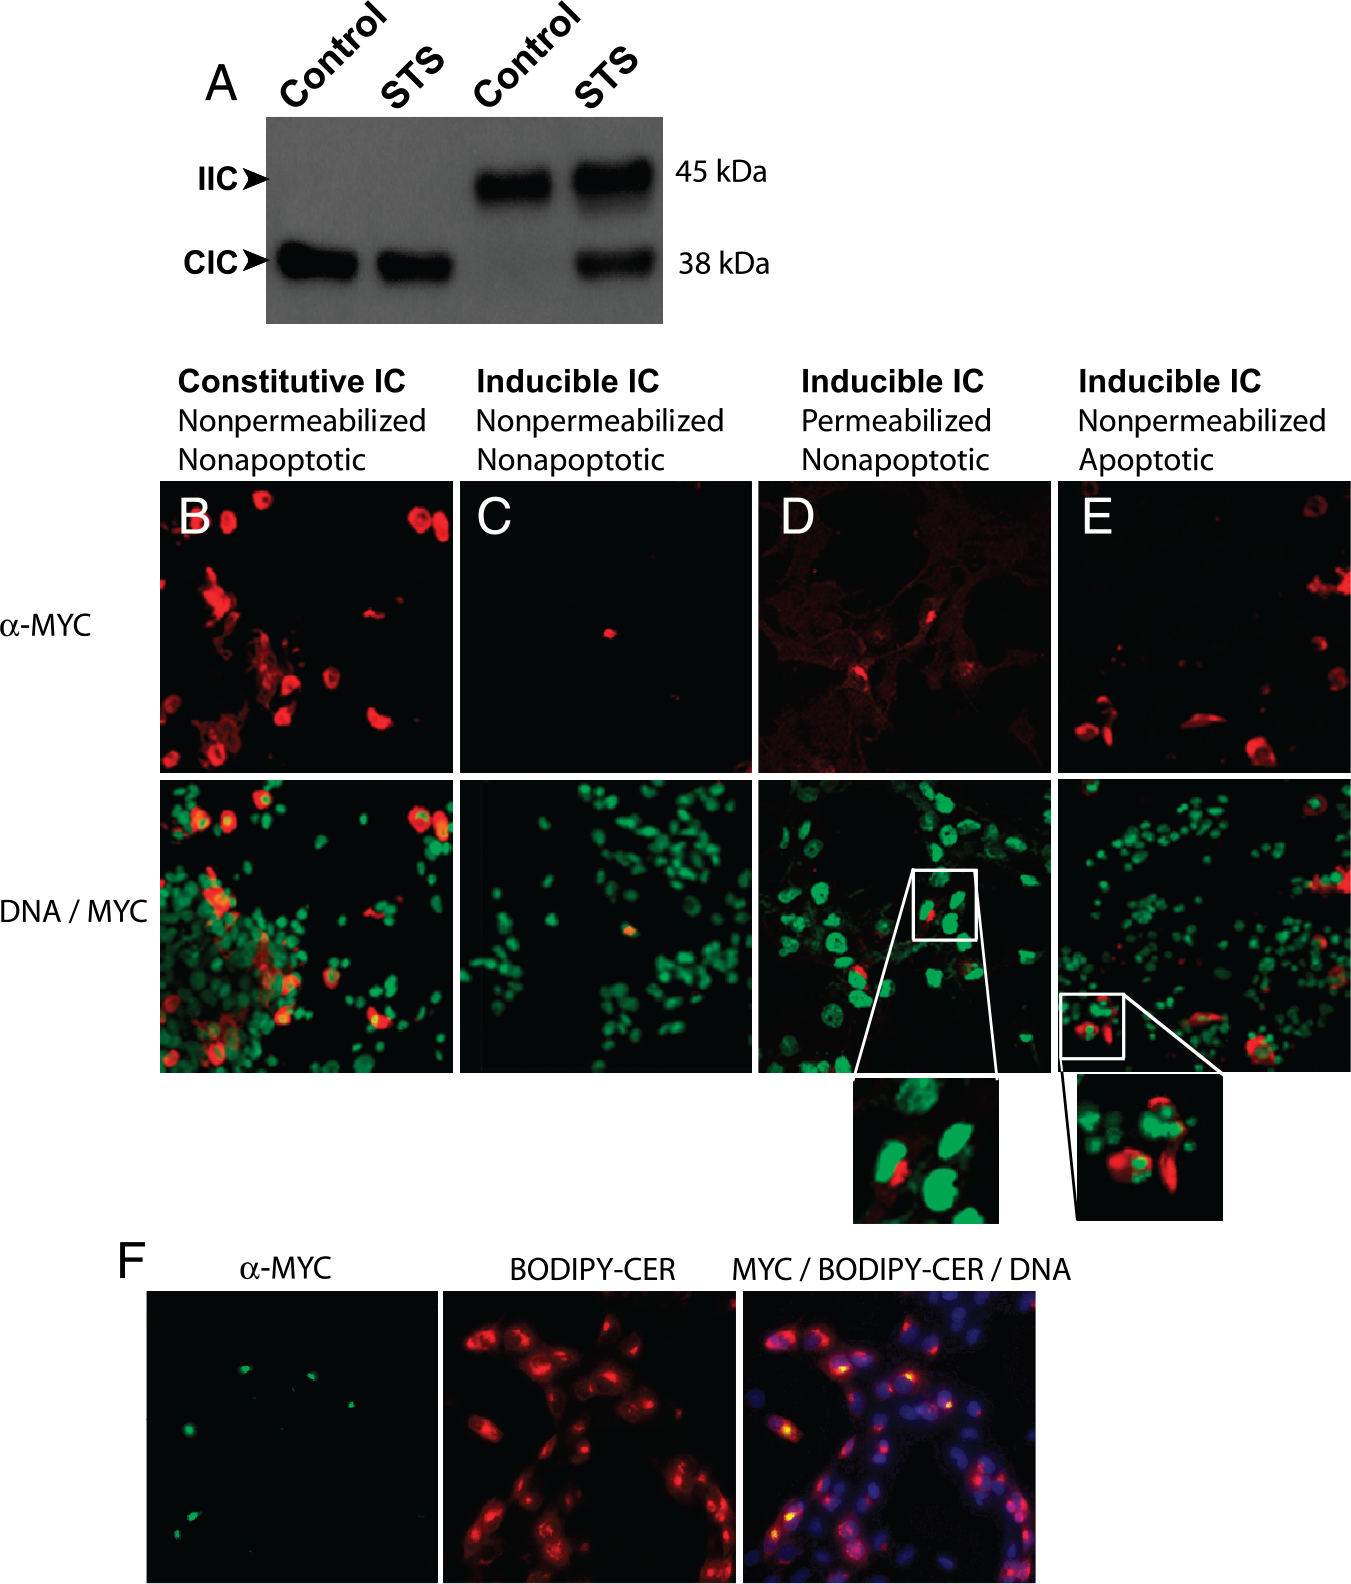
Expression and subcellular localization of CIC and IIC in COS cells. (A) Lysates of COS cells, transiently transfected with CIC and IIC and treated with or without staurosporine (STS), were Western blotted using myc tag antibody. (B) Immunostaining of COS cells using myc tag antibody following transfection with CIC. (C–E) Immunostaining of COS cells using myc tag antibody following transfection with ICC under permeabilization and treatment conditions mentioned. Cells were counterstained with DNA staining dye (bottom) as described in Materials and Methods. (F) COS cells transiently transfected with IIC were stained with myc tag antibody (green), NBD C6-ceramide (red), and counterstained with DAPI (blue).
To evaluate the dynamics of this process, we induced apoptosis in D54 cells stably expressing the IIC construct and monitored the emergence of the cleaved product at various time points after addition of TRAIL. This time course revealed that the number of cells undergoing apoptosis increased over time as evident by the appearance (at 1 hr after TRAIL treatment) and then continued increase in the detection of the 38-kDa cleaved product from the 45-kDa IIC protein (Figure 4A), which corresponded to a concurrent increase in levels of active caspase-3 (Figure 4A). The level of active caspase-3 increased until the 4-hr time point, and from thereon no further increase was seen. Similarly, at this time point we noticed a larger proportion of D54 cells overexpressing ICC with cell surface staining for single-chain antibody when compared with 0 hr TRAIL treated control cells that predominantly showed Golgi residence (Figure 4B).
Having established a connection between caspase-3 activation and both cleavage and translocation of the single-chain antibody within IIC from the trans-Golgi network to cell membrane, we next examined individual cells by fluorescence microscopy for cell surface staining and DNA morphology following TRAIL treatment. Because caspase-3 is a terminal executioner caspase at the convergence of both the intrinsic and extrinsic apoptotic pathways and DNA condensation is the hallmark of the end of the execution phase of apoptosis, we examined a link between the translocation of single-chain antibody to the cell surface and DNA condensation and degradation. Among the cells that showed positive cell surface staining for single-chain antibody, the majority did not show condensed apoptotic nuclei (Figure 5A–D), suggesting that caspase-3 activation and translocation of our recombinant peptide is an earlier event and that DNA condensation occurs later in the apoptotic pathway. Even at the 4-hr time there were several cells that did not show either DNA condensation or cell surface sFv staining (Figure 5D), suggesting that these cells have not undergone caspase-3 activation. In contrast, by the time cells began to display apoptotic nuclei, few of them showed membrane staining (Figure 5D and E). This could be attributed to secondary necrosis that occurs in cultured cells when dying apoptotic cells are not cleared by the phagocytic cells and undergo this secondary degeneration [25]. Thus, this technology that allows imaging of apoptosis based on activation of caspase-3 may offer a window of opportunity to monitor events between caspase-3 activation and DNA condensation.

Expression and subcellular localization of CIC and IIC in D54 cells. Lysates of D54 cells, stably expressing CIC (A) or IIC (B), were untreated or treated with TRAIL or TRAIL and ZVAD and Western blotted using myc tag antibody. (C) Immunostaining using myc tag antibody of fixed and nonpermeabilized D54 cells stably expressing CIC. Immunostaining using myc tag antibody of fixed and nonpermeabilized (D), fixed permeabilized (E), or fixed, nonpermeabilized, and apoptotic (F) D54 cells stably expressing IIC. Cells were counterstained with DNA staining dye as described in Materials and Methods.
Discussion
The ability to conditionally present a nonphysiological cell surface reporter at high enough concentrations so that it is easily detected would present biologists with a powerful tool to sort cells, image a molecular event, and target potential antitumor drugs. Previous studies have utilized the anti-phOx single-chain antibody and magnetic beads coupled to phOx to enrich cells expressing a desired transgene [31]. This technology allows isolation of transfected cells expressing the gene of interest without the need to establish stable cell lines, thus allowing the study of toxic genes, the effects of dominant negative mutations, and the temporal events along a developmental or signaling pathway [31]. In a previous report, coupling of the phOx ligand to polyethylene glycol (PEG)-modified β-glucuronidase allowed the targeting of this modified enzyme to B16-F1 tumor xenografts expressing the phOx sFv [32]. Selective killing of tumor cells in vitro and in vivo was obtained by using the prodrug, p-hydroxy aniline mustard β-

Translocation of single-chain antibody in ICC from Golgi is dependent on activation of caspase-3. (A) Lysates of D54 cells, stably expressing IIC were treated with TRAIL for indicated time points and Western blotted using myc tag and caspase-3 antibodies. (B) Immunostaining using myc tag antibody of D54 cells stably expressing ICC at 0 or 4 hr post TRAIL treatment. Cells were counterstained with DNA staining dye as described in Materials and Methods.
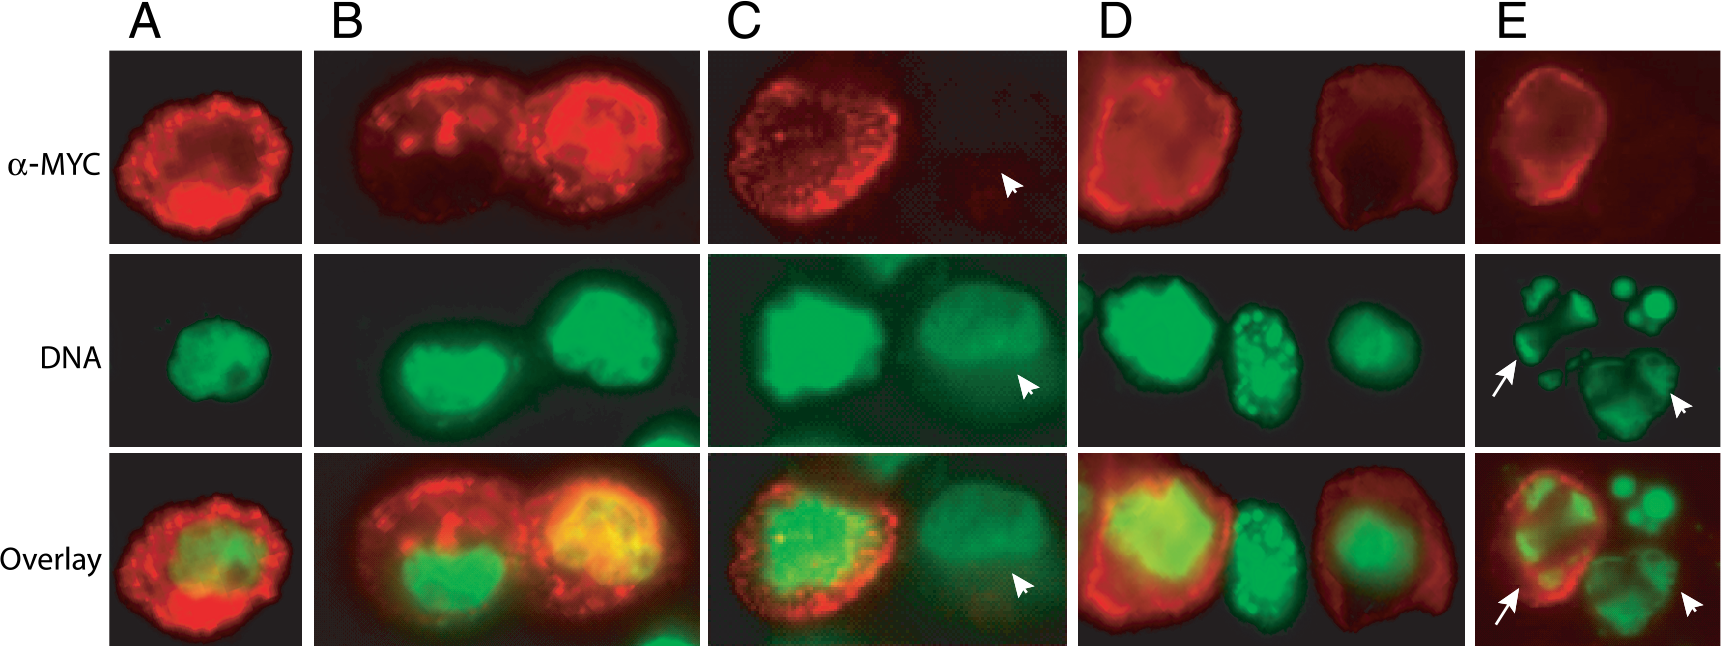
Translocation of single-chain antibody in ICC from Golgi occurs prior to DNA condensation. Immunostaining using myc tag antibody of D54 cells stably expressing ICC at 4 hr (A–D) or 8 hr (E) time point showing cells with nonapoptotic nuclei with membrane staining, nonapoptotic nuclei without membrane staining (C, arrowhead), apoptotic nuclei with membrane staining (E, arrow), or apoptotic nuclei without membrane staining (E, arrowhead). To visualize DNA, cells were counterstained with DNA staining dye as described in Materials and Methods.
We have previously described a noninvasive, bioluminescent, apoptosis-imaging strategy using the luciferase–luciferin system [27]. This strategy was based on construction of a hybrid firefly luciferase whose activity was silenced by fusion with the estrogen receptor (ER) regulatory domain on both the carboxy and amino termini of the enzyme. Similar to the reporter described here, caspase-3 cleavage sites were introduced between ER domains and the luciferase such that bioluminescent activity of luciferase was contingent upon the removal of the silencing domains by active caspase-3. Although this technology allowed us to image cell death in vivo, it has limitations that are associated with bioluminescent imaging including the oxygen-, ATP-, and substrate-dependence of bioluminescent imaging. In addition, optical imaging allows only 2-D imaging data sets, therefore imposing positional ambiguity on the 3-D localization of signal [1,33]. The apoptosis imaging technology described here may overcome that limitation and make a true 3-D imaging of apoptosis a possibility. For example, phOx-coupled nanoparticles embedded with magnetic resonance or computed tomography contrast agents might allow visualization of tumor cells undergoing apoptosis by a caspase-3-dependent increase in contrast enhancement. Similarly, coupling of phOx with either near-infrared fluorochrome or radioactive agent would allow detection of apoptosis by optical fluorescence imaging or by nuclear imaging modalities such as positron emission tomography (PET) or single-photon emission computed tomography (SPECT), respectively. Alternatively, a multimodality imaging strategy might be envisaged based on the creation of nanosized delivery systems harboring reagents that allow detection by nuclear, optical, and magnetic imaging, which would provide distinct advantages by improving the ability to quantify, interpret, and locate caspase activation with high sensitivity and specificity.
In an effort to develop noninvasive apoptosis-imaging platforms, several groups have exploited the high affinity of annexin V for phosphatidylserine (PS), an anionic phospholipid that is actively recruited to the inner leaflet of the bilayer in nonapoptotic cells and is distributed to the external leaflet in apoptotic cells (reviewed in Refs. [34,35]). Radiolabeled or fluorescently tagged annexin V has been used to noninvasively image apoptotic cells in the developing embryo, during ischemia and reperfusion of the mouse heart, following acute myocardial infarction in humans, and in the setting of heart transplant rejections [36–39]. Although the localization annexin V seems to depend on the occurrence of apoptosis, experimental work suggests that physiological stress may produce transient and reversible PS expression, not specific to apoptosis, which may be visualized following the injection of annexin [34]. On the other hand, 99mTc annexin V accumulation has also been observed in predominantly necrotic areas, probably due to either binding to PS on the inner plasma membrane leaflet of cells with irreversible membrane damage or failure of energy-dependent cellular systems to restrict PS to the inner leaflet, thus allowing the passive redistribution of PS from the inner to the outer leaflet of the plasma membrane [40]. Thus, we suggest that an imaging strategy based on caspase-3 activity, reported here, may provide a specific signal to visualize apoptosis.
Additional advantages of this technology lie within its ability to allow enrichment of cells after an inducible proteolytic event. In the current study, the apoptotic pathway downstream of caspase-3 activation might be probed by rapidly enriching for the cells expressing a caspase-3-dependent cell surface phenotype. This strategy may be modified to understand pathways downstream of specific proteolytic events with minimal interference from nonresponsive cells or cells in stages prior to the event under investigation. Finally, we view these studies as mainly proof of principle using a single receptor–ligand pair to measure a discreet intracellular proteolytic process. There clearly are dozens of different proteases that could be monitored in a similar fashion and there certainly may be alternative receptor–ligand pairs that may provide different opportunities or specificities.
Footnotes
Acknowledgments
We thank Bharathi Laxman, Kyle Kuszpit, and Kuei Lee for help during various stages of this work. This work was supported by NIH/NCI P50CA93990 (BDR and AR) and NIH/NCI P01CA85878 (BDR and AR).