Some other well-known firms that have bought their own shares recently include Montgomery Ward, Singer Manufacturing, Duquesne Brewing, Sinclair Oil, United Fruit, and Hilton Hotels. The total volume of these purchases is not available, but the total amount of stock bought and retired by industrial firms (including both the kind of transaction discussed and stocks retired in cash purchase mergers) was $1.6 billion in 1963. This exceeded the value of new issues ($0.6 billion) for the first time since the war. (Fortune, May 1964, pp. 75–76.) From the text of the article that supplied these estimates one gets the very clear impression that investment bankers feel the trend toward purchases of firms' own shares has stepped up in recent years.
2.
The main reason for this is that in a cash purchase the sellers of the acquired company are subject to the capital gains tax if their basis price is less than the acquisition price, but in an exchange-of-stock arrangement the tax is deferred.
3.
Quoted from an article in the Wall Street Journal, March 6, 1964.
4.
For companies that pay regular dividends, the stock price tends to rise between payment dates, then fall when the stock goes ex-dividend. The $13.30 price used here is considered to be the just-after-dividend price, defined as the “normal” price.
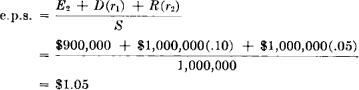
The new earnings per share are computed as follows where: E2 = total earnings which would be generated with no investment; D = depreciation; R = retained earnings; r1 = average rate of return on the depreciation-generated increment; and r2 = average rate of return on the retained earnings.
7.
The selling stockholders will probably benefit too. In most firms there are, at any given time, some holders who, for personal or other reasons, want to sell some or all of their shares. If these holdings are large relative to the normal volume of trading in the stock, then these sellers will have to depress the market in order to unload their holdings. If, however, the firm makes these purchases of its own stock the sellers will receive the going market price (or higher). In addition, the removal of such blocks of shares offered for sale removes a depressing drag on the remaining stock, thus further benefiting the remaining shareholders.
8.
These statements can be demonstrated by simple algebra. First, we set up an equation for the new price that will prevail after the stock purchase plan is effected: (1) where: P1 is the new price of the stock; M is the earnings multiplier; E is the after-tax earnings of the firm; S is the original number of shares outstanding; and X is the average price paid for the purchased shares. If the purchase is not to be carried out and dividends are to be paid, the price just before the ex-dividend date (or the value to the average stockholder) would be: where: P2 is the price just before the ex-dividend date; Pn is the “normal” price; D is the cash dividend; and t is the tax rate of the average stockholder (or of any individual stockholder appraising the alternatives for himself). Since we are seeking the maximum price that can be paid for purchased shares, X, and leave the remaining stockholders as well off as they would have been under the dividend alternative, we combine Equations (1) and (2): . Solving for X, we obtain: Inserting the values assumed thus far in the example into Equation (4), we find the value of X to be $20.00. If the internal investment comparison is to be made, the new normal price reflecting the additional earnings per share ($14 in the example) is used in Equation (3) as the value for P2. In this particular example the value of X is the same as in the dividend alternative, but this would not always be the case.
9.
American-Standard made some open-market purchases, then issued a tender at a price substantially above the going market price. United Fruit specified that it would spend a sum of about $10 million and would pay a maximum price of $26 per share. Shareholders could tender stock at $26 or lower. As it worked out, the company bought all the shares offered for less than $26 and 80 per cent of those offered at $26.
10.
Three studies relating to this have come to the author's attention. BenishayHaskel, “Variability in Earnings/Price Ratios of Corporate Equities,”American Economic Review, March 1961, pp. 81–94, found a positive relationship between payout and P/E ratios in the years 1954–1957 but he “rejected as an interpretation of this result that, ceteris paribus, investors prefer distribution to retention of earnings.” He concluded that investors somehow do not trust reported corporate earnings or their continuance, hence look upon dividends paid as a proxy variable which measures the “true” earnings. Professor John Clendenin, in an unpublished study of commercial banks, found a strong relationship between price/earnings ratios and payout in the late 1930's and 1940's, but the relationship broke down badly in the 1950's. The present author, in a study currently in progress, found results similar to those of Clendenin; payout bore a significant positive relationship to the P/E ratio from 1953 to 1956, was not significantly different from zero from 1957 to 1960, and was negative and statistically significant in 1961. This later study, and that of Benishay, used multiple regression techniques and included growth variables in the regression model; this allows the net, or partial effect of the payout ratio on price/earnings ratios to be examined.
11.
Up to now no very controversial statements have been made, but there are many academic financial authorities who would take exception to most of the following section. These authorities originally stated that the cost of capital is independent of the amount of debt a firm uses, though more recently the principal spokesmen have admitted that, due to the deductability of interest payments, the use of some debt can lower the average cost of capital. The debate has been raging in academic journals since Modigliani and Miller first presented their thesis (“The Cost of Capital, Corporation Finance, and the Theory of Investment,”The American Economic Review, June 1958), and it certainly cannot be settled here. I can only admit that if the Modigliani and Miller thesis is correct, then most of the force of this section is lost (though, because of the tax situation, it would still be technically correct).
12.
“Moderate” varies from firm to firm and industry to industry depending on individual circumstances and, especially, on the stability of sales and earnings available for fixed charges. Debt equal to 50 per cent of total capitalization might be “moderate” for an electric utility while 20 per cent might be excessive for a machine tool manufacturer. Long-term debt amounted to just over 23 per cent of total capitalization (measured at book values) for all manufacturing companies in 1958.
13.
If the Modigliani and Miller view of the world is correct, the dashed line designating the average cost of capital would be relatively flat as compared to its shape, assuming the traditional view is correct.
14.
These cost functions may be considered analytically as follows: AD = Average cost of debt = $ interest after tax/market value of debt. AE = Average cost of equity = $ earnings after tax/market value of stock. AC = Weighted average cost of capital. R = Debt to total capital ratio. (1) AD = A function of the debt ratio = f1(R) (2) AE = A function of the debt ratio = f2(R) (3) AC = [f1(R)] · [(R)] + [f2(R)] · 1(1 – R)] Provided that f1 and f2 can be determined, then the minimum cost of capital can be located by setting the first derivative of equation (3) equal to zero and solving for R. This R represents the optimal debt ratio for the firm. Unfortunately, the average costs of debt and equity securities are a function of many factors other than the debt ratio, and thus far no one has been able to isolate these partial relationships sufficiently well to use them in an operational sense.


 where:
 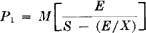 where:
  where:
  . Solving for
 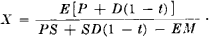 Inserting the values assumed thus far in the example into Equation (4), we find the value of X to be $20.00.
 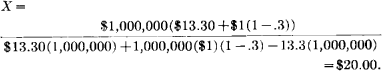 If the internal investment comparison is to be made, the new normal price reflecting the additional earnings per share ($14 in the example) is used in Equation (3) as the value for