
Abstract
Whole-body exposure to large radiation doses can cause severe loss of hematopoietic tissue cells and threaten life if the lost cells are not replaced in a timely manner through natural repopulation (a homeostatic mechanism). Repopulation to the baseline level
INTRODUCTION
Research describe in this paper and elsewhere (Scott et al. 2013) relates to demonstrating that the same success in animal radiobiological studies achieved using Cs-137 gamma rays can also be achieved using 320-kV spectrum X-rays, if proper dose adjustments are made to account for the X-ray relative biological effectiveness (RBE), compared to gamma rays. Replacement of Cs-137 sources with comparable X-ray sources is of interest for national-security-related reasons (NRC 2008).
A variety of animal studies have been conducted worldwide over many years using high-energy ionizing photon radiation from Cs-137 and Co-60 sources. This includes hematopoietic tissue reconstitution studies whereby cell losses are fully replaced (i.e., reconstituted) via natural homeostatic recovery processes (an evolutionary gift).
To facilitate the interpretation of data from hematopoietic tissue reconstitution studies, it is helpful to have a reliable quantitative model that characterizes the level of spleen and bone marrow cellularity (number of constituent cells) at a given follow-up time after radiation exposure.
The focus of the studies reported here is on quantitative modeling of the cellularity of hematopoietic tissue in spleen and bone marrow (in hind legs: femur and tibia bones) at 6 weeks after whole-body exposure of female C.B-17 mice to Cs-137 gamma rays (Gammacell 1000 Unit [(AECL 1984)]) or 320-kV-spectrum X-rays (X-RAD 320 Unit [PXINC 2010]). Below normal cellularity can occur and persist for weeks or longer after high radiation doses and represents a reconstitution (full repopulation of cells) deficit since the cell count is below the individual-specific baseline level
In an earlier paper (Scott et al., 2013), bone marrow and spleen cellularity data obtained at 6 weeks after whole-body exposure of female C.B-17 mice to Cs-137 gamma rays were reported. Cellularity data after whole-body X-ray exposure were also developed based on an assumed X-ray RBE of 1.3 for in vivo cell killing relative to Cs-137 gamma rays; however, the indicated RBE estimate was based on a cell culture study rather than in vivo studies and on a cell type other than from hematopoietic tissue. It was however determined (Scott et al. 2012) that RBE can vary over different target cell types and also that cytotoxicity dose-response relationships in vivo can differ from those for in vitro studies (Scott et al. 2013), so that the assumed X-ray RBE of 1.3 for in vivo effects on the hematopoietic system may be inappropriate.
With the lower assigned X-ray doses (since RBE > 1 assumed) in the cellularity study with female C.B-17 mice and large variability in individual animal responses, noisy dose-response data resulted for both bone marrow and spleen cellularity and were found to be only weakly correlated (
With the Stochastic TE model for tissue reconstitution deficit provided in this paper,
METHODS
Experimental Methods
Experimental methods are described in detail elsewhere (Scott et al. 2013) and therefore are not repeated here. The gamma-ray dose-response data used in modeling are presented in Table 1 and the X-ray data in Table 2. The cellularity data represent individual-specific single measurements so no averaging-related errors (e.g., standard deviation) are reported. Measurement error was not quantified. Radiation doses are based on measurements with thermoluminescent dosimeters (TLD, Quantaflux, Oregonia, OH).
Spleen and bone marrow (from hind legs) cell counts in female C.B-17 mice at 6 weeks after whole-body Cs-137 gamma-ray exposure. a

Each data entry relates to a single animal and single measurement. Experimental details are provided in Scott et al. (2013).
Spleen and bone marrow (from hind legs) cell counts in female C.B-17 mice at 6 weeks after whole-body 320-kV spectrum X-ray exposure. a

Each data entry relates to a single animal and single measurement. Experimental details are provided in Scott et al. (2013).
Modeling Methods
With the previously used deterministic version of the TE Model, the cellularity (cell count)
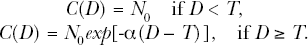
The variable
In this paper a stochastic version of the TE model is introduced that allows for variable responses of different individuals when exposed to the same radiation dose. This is achieved in part by allowing all model parameters to vary over the irradiated population or group. Thus,
Both standard Monte Carlo and Bayesian approaches were used in modeling. Standard Monte Carlo was used to simulate population average dose-response relationships. The Bayesian approach (implemented via Markov chain Monte Carlo [MCMC]) was used to obtain experimental-group-based parameter and dose-response function distributions (called posterior distributions) (Gilks et al. 1996; Gamerman 1997; Siva 1998; Lunn et al. 2000). Distribution percentiles (2.5%, 5%, 10%, 25%, 50%, 75%, 90%, 97.5%) were evaluated and three (2.5%, 50%, and 97.5%) are reported in this paper for the Bayesian analyses. The distribution means from both Standard Monte Carlo and MCMC (for the Bayesian analyses) were used to represent population and group averages, respectively. This allows for generation of
WinBUGS software (Lunn et al. 2000) was used to carry out both standard Monte Carlo and Bayesian analyses implemented via Markov chain Monte Carlo (MCMC). With this software, normal distributions when used are parameterized based on population mean μ and precision τ (reciprocal of the variance). Where normal distributions were used in analyses, precision was assigned so that negative values were unlikely.
The notation “α ∼
With MCMC analyses (Lunn et al. 2000), long single chains were used, with judgment about chain length for convergence being based on autocorrelations for individual parameter estimates evaluated after the first 5,000 iterations. Chains were then run for at least 20,000 iterations in excess of what was considered adequate for convergence. Only results for the last 20,000 iterations were retained for analysis. The discarding of the early iterations data helps to minimize the influence of the parameter initial value assignments on the posterior distributions obtained. Ratios “Monte Carlo error/parameter posterior distribution standard deviation” < 0.05 were interpreted to be consistent with MCMC chain convergence (Spiegelhalter et al. 2003), which is the case for all of the results reported in this paper. Either a normal or exponential distribution was used for assigning a prior distribution to a given model parameter.
RESULTS
Exploratory analyses were carried out using standard Monte Carlo to generate plausible shapes for the population average cellularity dose-response function,

Hypothetical dose-response functions for population average
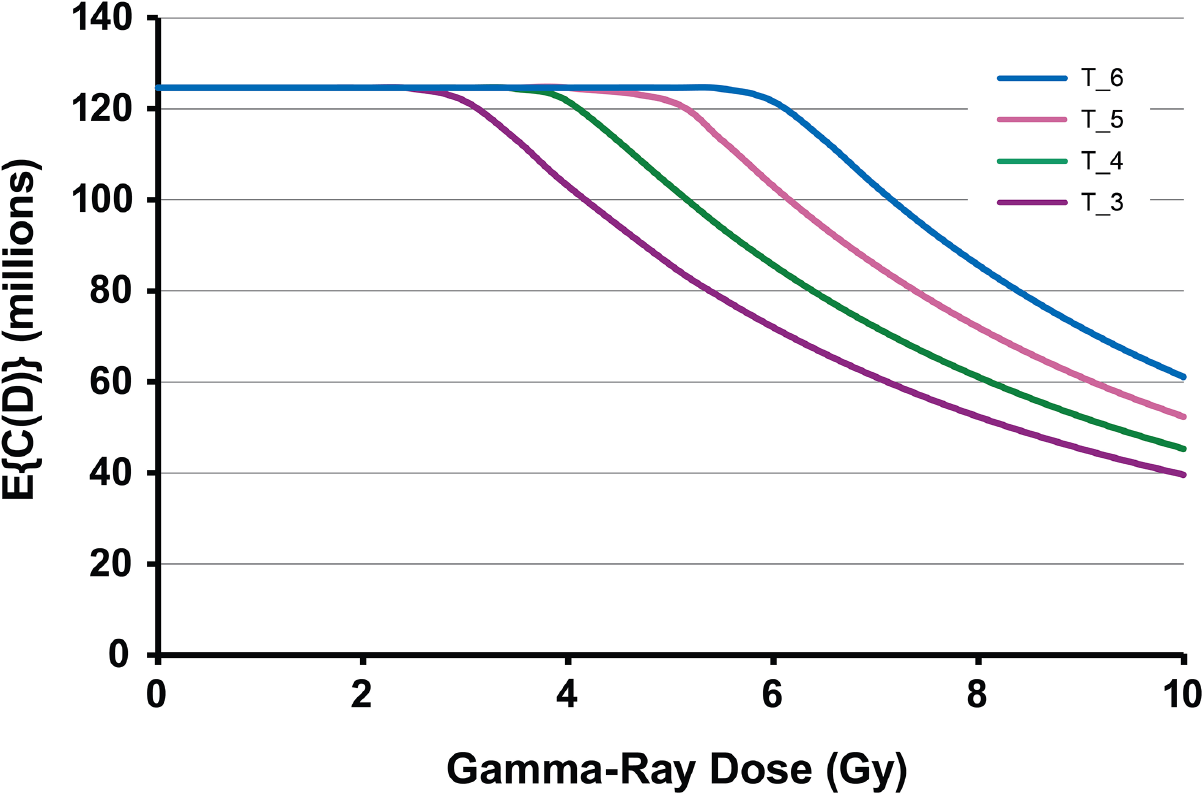
Hypothetical dose-response functions for population average
Application of the Stochastic TE Model to Post Gamma-Ray Exposure Data for Spleen Cellularity
Results of application of the Stochastic TE Model to 6-week post gamma-ray exposure data for spleen cellularity are presented in Figure 3. Bayesian analysis computations (Siva 1998) were carried out based on cell count being normally distributed with the precision τ(

Results of application of the stochastic TE model to spleen cellularity data obtained 6 weeks after whole-body gamma-ray exposure of female C.B-17 mice. Data points are the observed individual-specific cell counts (Table 1) in millions with no assigned uncertainty. The lower curve is the posterior distribution 2.5% (percentile) results. The middle curve is the posterior distribution mean. The upper curve is the posterior distribution 97.5% (percentile) results.

A decreasing precision in the cell count data with increasing dose was assumed to occur based on visual examination of a plot of the dose-response data. The value of 1 in the denominator ensures that τ(
α ∼
β ∼
The MMC results are based on 50,000 iterations with the first 30,000 values in the MCMC chain discarded. For each parameter evaluated the Monte Carlo error divided by the posterior distribution standard deviation was < 0.05 indicating consistency with MCMC chain convergence. The MCMC results are presented in Table 3.
MCMC results for data for gamma-ray exposure of female C.B-17 mice. a

Values expressed as percents (%) represent percentiles of the posterior distribution.
Application of the Stochastic TE Model to Post Gamma-Ray Exposure Data for Bone Marrow Cellularity
Results of application of the Stochastic TE Model to 6-week post gamma-ray exposure data for bone marrow cellularity in female C.B-17 mice are presented in Figure 4. Bayesian analysis computations were carried out based on the same prior distributions as were used for the spleen data, the same expression for τ(

Results of application of the stochastic TE model to bone marrow cellularity data obtained 6 weeks after whole-body gamma-ray exposure of female C.B-17 mice. Data points are the observed individual-specific cell counts (Table 1) in millions with no assigned uncertainty. The lower curve is the posterior distribution 2.5% (percentile) results. The middle curve is the posterior distribution mean. The upper curve is the posterior distribution 97.5% (percentile) results.
Application of the Stochastic TE Model to Post X-Ray Exposure Data for Spleen Cellularity
Results of application of the Stochastic TE Model to 6-week post X-ray exposure data for spleen cellularity in female C.B-17 mice are presented in Figure 5. Bayesian analysis computations were carried out based on the same prior distributions as were used for the gamma-ray data, the same expression for τ(

Results of application of the stochastic TE model to spleen cellularity data obtained 6 weeks after whole-body X-ray exposure of female C.B-17 mice. Data points are the observed individual-specific cell counts (Table 2) in millions with no assigned uncertainty. The lower curve is the posterior distribution 2.5% (percentile) results. The middle curve is the posterior distribution mean. The upper curve is the posterior distribution 97.5% (percentile) results.
MCMC results for data for X-ray exposure of female C.B-17 mice. a

Values expressed as percents (%) represent percentiles of the posterior distribution.
Application of the Stochastic TE Model to Post X-Ray Exposure Data for Bone Marrow Cellularity
Results of application of the Stochastic TE Model to 6-week post X-ray exposure data for bone marrow cellularity in female C.B-17 mice are presented in Figure 6. Bayesian analysis computations were carried out based on the same prior distributions as were used for the gamma-ray data, the same expression for τ(

Results of application of the stochastic TE model to bone marrow cellularity data obtained 6 weeks after whole-body X-ray exposure of female C.B-17 mice. Data points are the observed individual-specific cell counts (Table 2) in millions with no assigned uncertainty. The lower curve is the posterior distribution 2.5% (percentile) results. The middle curve is the posterior distribution mean. The upper curve is the posterior distribution 97.5% (percentile) results.
DISCUSSION
Scott et al. (2013) previously introduced the deterministic version of the TE Model for characterizing tissue reconstitution deficits evaluated after a given follow-up time (e.g., specified number of weeks) after whole-body gamma-ray exposure C.B-17 mice. The threshold was set at the largest applied dose for which cellularity was not significantly different from controls. In this paper the more realistic Stochastic TE Model was introduced and applied to spleen and bone marrow cellularity data evaluated at 6 weeks after whole-body exposure of female C.B-17 mice to either Cs-137 gamma rays or 320-kV-spectrum X-rays. The stochastic model allows the individual response to radiation exposure to vary over the irradiated group like what actually occurs.
Standard Monte Carlo was used to carry out exploratory analyses to produce plausible dose-response relationships for the population (hypothetical) average dose-response function
Based on measured (Tables 1 and 2) and model calculated values for
For the gamma-ray data, posterior distributions for
The X-ray data span a shorter dose range than the gamma-ray data due to use of an X-ray RBE of 1.3 in assigning the X-ray doses. Because of the shorter range and large scatter in the data, the posterior distribution standard deviation for α was larger than the posterior distribution mean (Table 4) for both spleen and bone marrow (right-skewed posterior distribution). Thus, more data at higher doses are presumed needed in order to obtain more reliable information about the indicated parameter. For
Even though the highest X-ray dose used was approximately 5 Gy compared to approximately 7 Gy for gamma rays, the MCMC evaluations allowed predicting results for X-ray doses to 7 Gy. Results obtained are presented in Figures 5 (spleen) and 6 (bone marrow) and values obtained for
Regarding the large scatter in the data presented in Figures 5 and 6, both measurement error and individual variability in radiation response (initial cell killing and subsequent cell repopulation) may be the largest contributors to the scatter. A larger data set would be needed to distinguish such contributions.
Because posterior distributions for α and
MCMC results for data for gamma- and X-ray exposures of female C.B-17 mice when α and
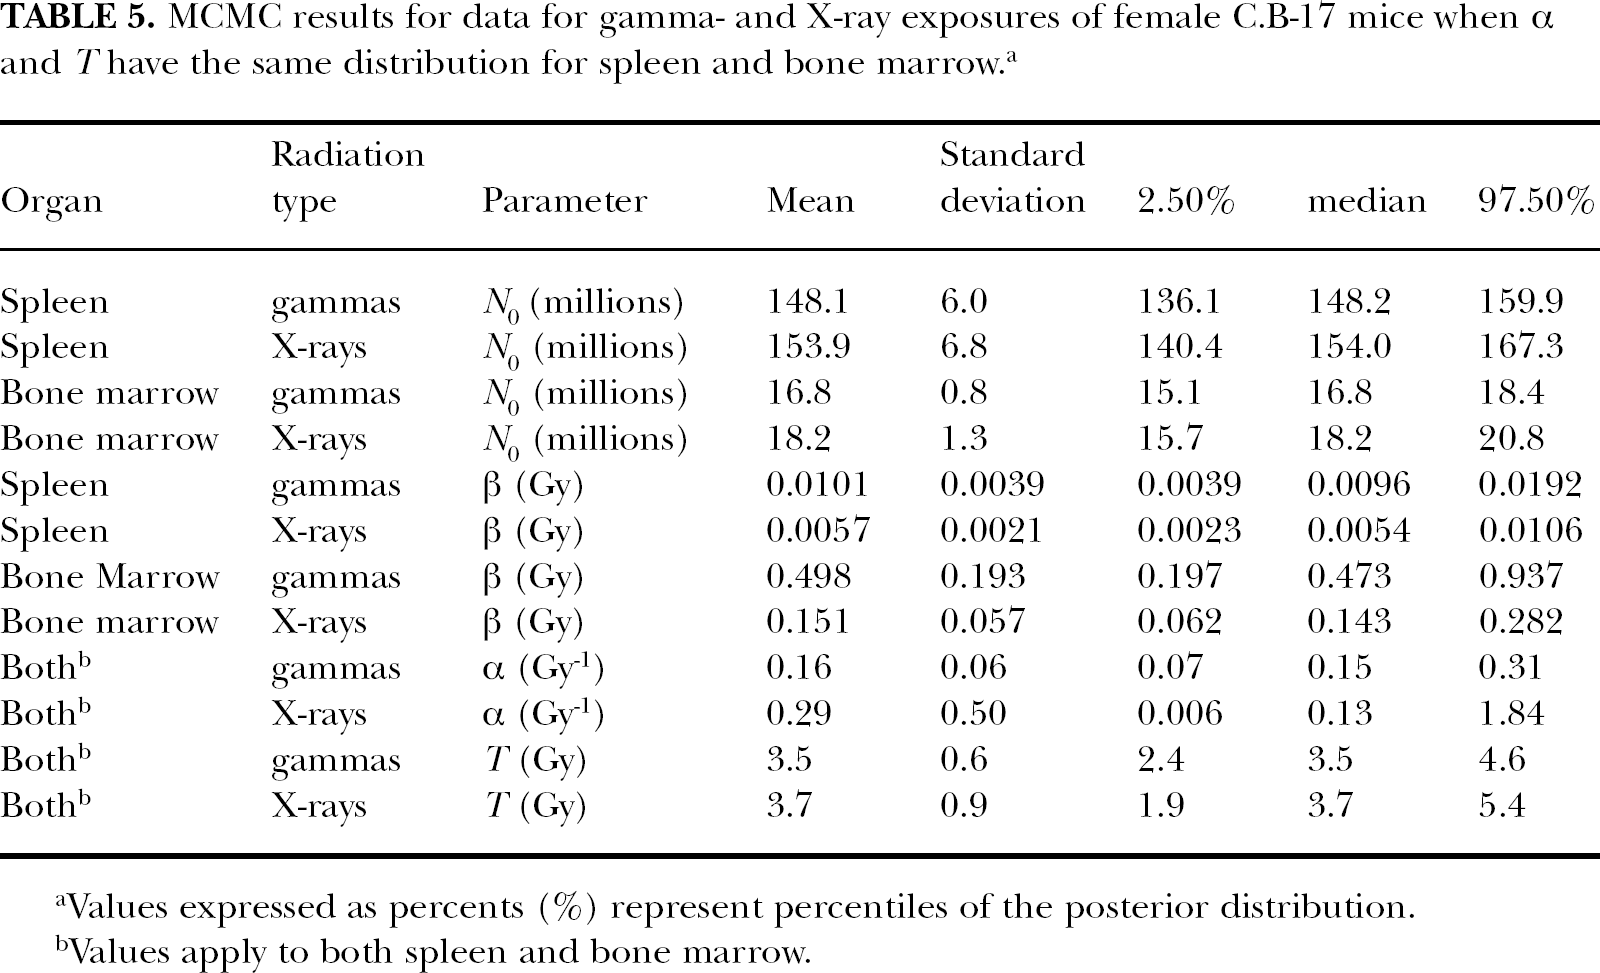
Values expressed as percents (%) represent percentiles of the posterior distribution.
Values apply to both spleen and bone marrow.
The posterior distribution means, representing
The indicated RBE of 0.95 for 320-kV spectrum X-rays for reconstitution deficit has implications for the design of bone-marrow transplantation studies. The results suggest that it may be better to use RBE=1 in the design of the studies than and RBE > 1 (e.g., based on cytoxicity studies). As reported elsewhere (Potter et al. 2013), designing a bone marrow transplantation study based on X-ray RBE =1.3 (dictating lower X-ray doses than for Cs-137 gamma rays) led to less success in bone marrow transplantation than after Cs-137 gamma-ray exposure.
CONCLUSIONS
The results obtained indicate that both measurement error and individual variability in radiation response (initial cell killing and subsequent cell repopulation) may have contributed significantly to the large scatter in the spleen and bone marrow cellularity data reported in this paper. The Stochastic TE model can be used to address the scatter by allowing for individual variability in model parameters
Results of application of the Stochastic TE model indicate that the group averaged threshold,
Footnotes
ACKNOWLEDGEMENTS
This work was performed under project numbers SAND2013-8017J and SL11-RadBio-PD13 and with partial support from the Office of Science (BER), U.S. Department of Energy, Grant No. DE-FG02-09ER64783. The authors would like to express their appreciation to the U. S. Department of Energy, NA-22, Radiation Source Replacement Program and Arden Dougan and Frances Keel (DOE/NA-221). Experimental data used was generated in the laboratory of Dr. Julie Wilder with assistance from Ms. Katherine M. Gott.