
Abstract
There are a number of variables that are correlated with land elevation. Land elevation, and in particular, its surrogate variables such as natural background radiation, can be studied in relation to cancer rates. The present ecological study focuses on three such variables correlated with land elevation: natural background radiation (NBR), oxygen concentration (OC), and barometric pressure (BP). In addition, the study uses a novel approach for determining median land elevation values from which the surrogated variables are estimated. Inverse correlations were observed for NBR while direct correlations were found for OC and BP suggesting the presence of a protective effect with all three variables. Further study is indicated to either verify or refute these findings.
Keywords
INTRODUCTION
A number of environmental variables are correlated with land elevation and have been studied in relation to cancer rates. Among these variables is natural background radiation (NBR) (Jagger, 1998; Hart and Hyun, pre-press; Hart, 2010) where inverse relationships have been observed suggesting the presence of radiation hormesis. Other environmental variables correlated (varying) with land elevation are barometric pressure (BP), and oxygen concentration (OC).
Some of the studies on land elevation (e.g., Hart and Hyun; and Hart, 2010) used archived data for the land elevation variable and in one of these (Hart and Hyun) the average land elevation for the entire state was used. The present ecological study utilizes an author (Hart)-generated method of obtaining land elevation values using geographic information systems (GIS). Subsequent use of a median value (versus mean) in an attempt to control for the wide variability of land elevation that can occur in a given region is thought to improve accuracy for land elevation estimates. The present study seeks to determine whether these three variables (NBR, BP, and OC), based on GIS-generated land elevation measurements, are correlated with cancer death rates at the city and county jurisdiction levels.
METHODS
City cancer
Cancer data was obtained from the CDC Wonder database (CDC, 2011) for metropolitan areas (cities) that included only one city (n = 31 cities; Table 1) so that one mortality rate for one city could be compared to its (one) median elevation value. Thus, the cities were selected via convenience sample rather than random selection. Other inclusion criteria for cancer rates consisted of: age-adjusted mortality rates per 100,000 persons, white non-Hispanic, both genders, for 2006 (CDC, 2011). This search method was used for two data retrievals: 1) all cancer sites combined (“AC”) and 2) leukemia cancers (“LC”). This retrieval was performed since they (leukemia cancers) are thought to be the most common form of radiation-induced cancer (American Cancer Society, 2009). Two of the cities did not have data available for LC. And since a 50% higher risk of developing any type of cancer is thought to exist in persons exposed in the atomic bombings in Japan (American Cancer Society, 2009), the retrieval for all cancer sites combined was obtained.
Summary data for cities. Elevations from Google Earth software. mrem, BP (barometric pressure, in mmHg), and O2 (oxygen concentration) are based on median land elevations (please see Methods section for explanation on how median elevations were calculated). AC = mortality rates for all cancers. LC = mortality rates for leukemia cancers. Both cancer rates based on both genders, < age 65, white non-Hispanic, average age-adjusted mortality rate per 100,000 persons, 2003–2007. na = data not available.

County cancer
Age-adjusted mortality rates per 100,000 persons were selected for all-sites cancer, < age 65 (to see rates below age of life expectancy), both genders, white non-Hispanic (to avoid confounding of different rates for different races), 2003–2007, from National Cancer Institute (NCI) databases (NCI, 2011 (Table 2). The white race was selected because this race has the greatest percent of representation in the population thereby minimizing the no-reporting by NCI due to low counts. Leukemia was not analyzed at the county level because there were only three counties that reported counts among the counties selected. There were 2713 counties reporting data with these inclusion criteria. The counties were numbered in Excel (Microsoft Corp., Redmond, WA) from 1 to 2713.
Selection of counties was performed as follows. For a minimum moderate correlation (r = + / − 0.400), a minimum sample size of approximately 23 at the 5% error level is indicated (Siegle, 2009). In an effort to add a bit more strength to the study, and to have a more even number, a sample size of 30 was selected. Counties were randomly selected from the 2713 counties using the RANDBETWEEN (1, 2713) function in Excel. The function was performed in one cell and then this one cell, containing the RANDBETWEEN (1, 2713) was dragged down for 30 rows to get the 30 numbers between 1 and 2713 (Table 2).
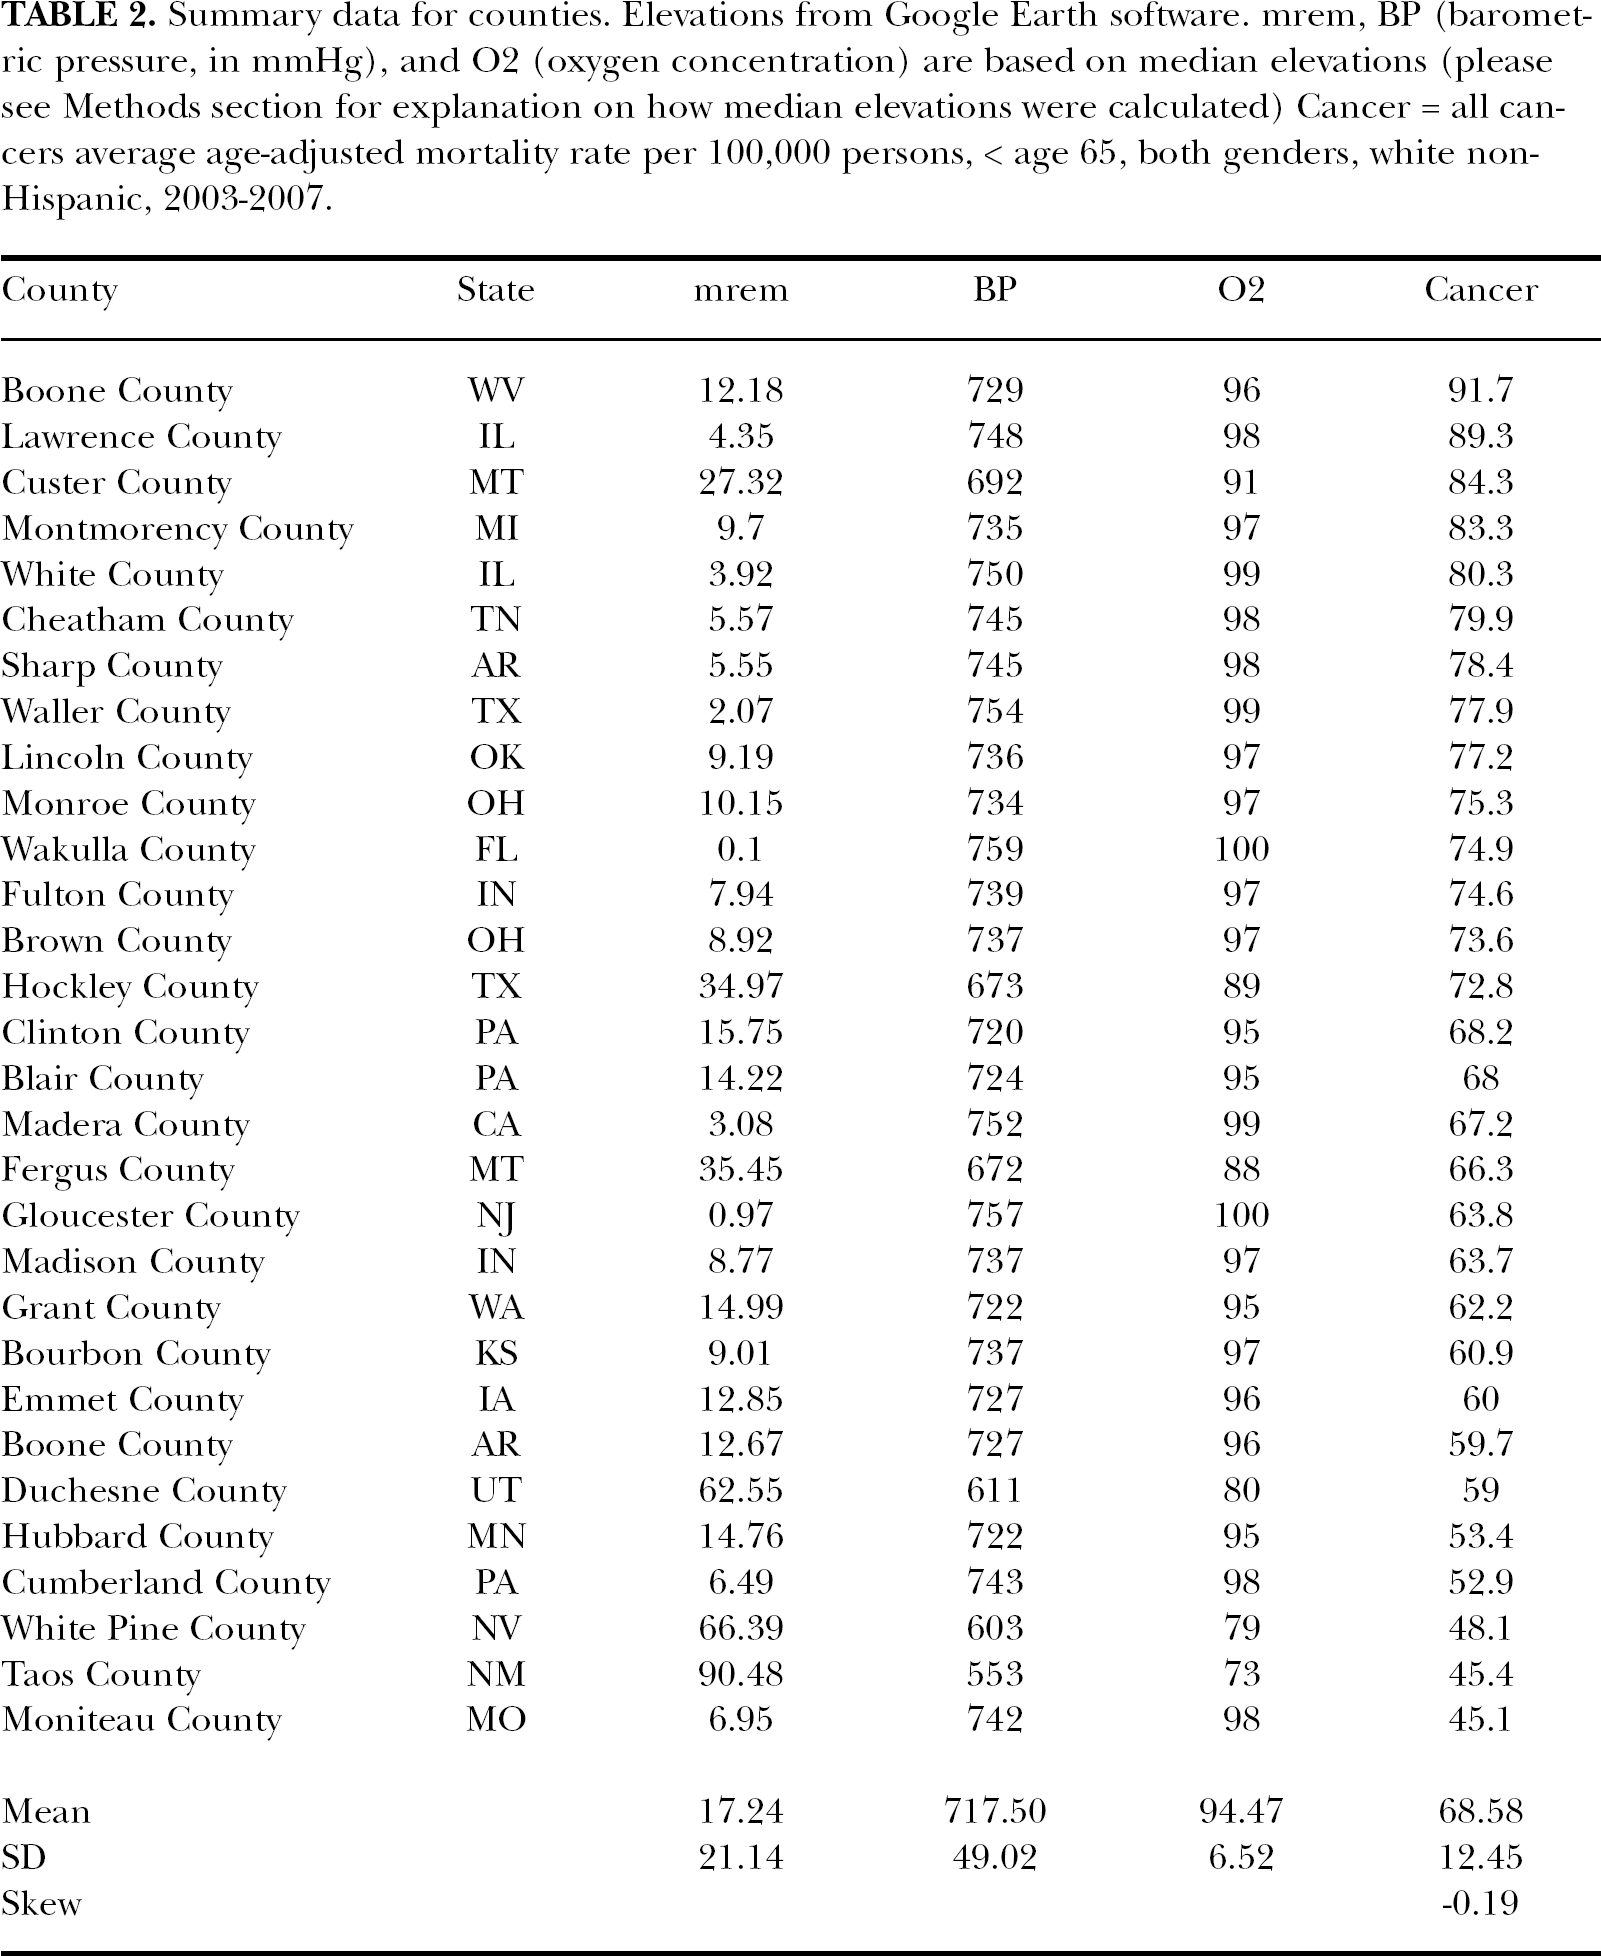
Summary data for counties. Elevations from Google Earth software. mrem, BP (barometric pressure, in mmHg), and O2 (oxygen concentration) are based on median elevations (please see Methods section for explanation on how median elevations were calculated) Cancer = all cancers average age-adjusted mortality rate per 100,000 persons, < age 65, both genders, white non-Hispanic, 2003–2007.
Land elevation estimates
Land elevation data for both city and county levels were obtained from interactive Google Earth maps where data is supplied from various sources such as the U.S. Geological Survey and U.S. Department of Agriculture. To arrive at a median elevation for a city or a county, five measurements were obtained with the borders shown (city borders, county borders). These measurements were based on a plus (+) sign imaginarily positioned in the geographic center of the city or county, except for areas that appeared to be uninhabited. Inhabited areas were assessed by use of the following layers: populated areas, places of worship, schools, and grocery stores. An example of uninhabited areas that were ignored for imaginary placement of plus sign are provided for a city in Figure 1 (Albuquerque, New Mexico) and for a county (Wakulla county, Florida) in Figure 2. Four of the five measurements were obtained essentially at the end of the axes of the plus sign while the fifth measurement was obtained at the center of the plus sign (example provided in Figure 1). The median of the five measurements was used for comparing to the cancer mortality rates.
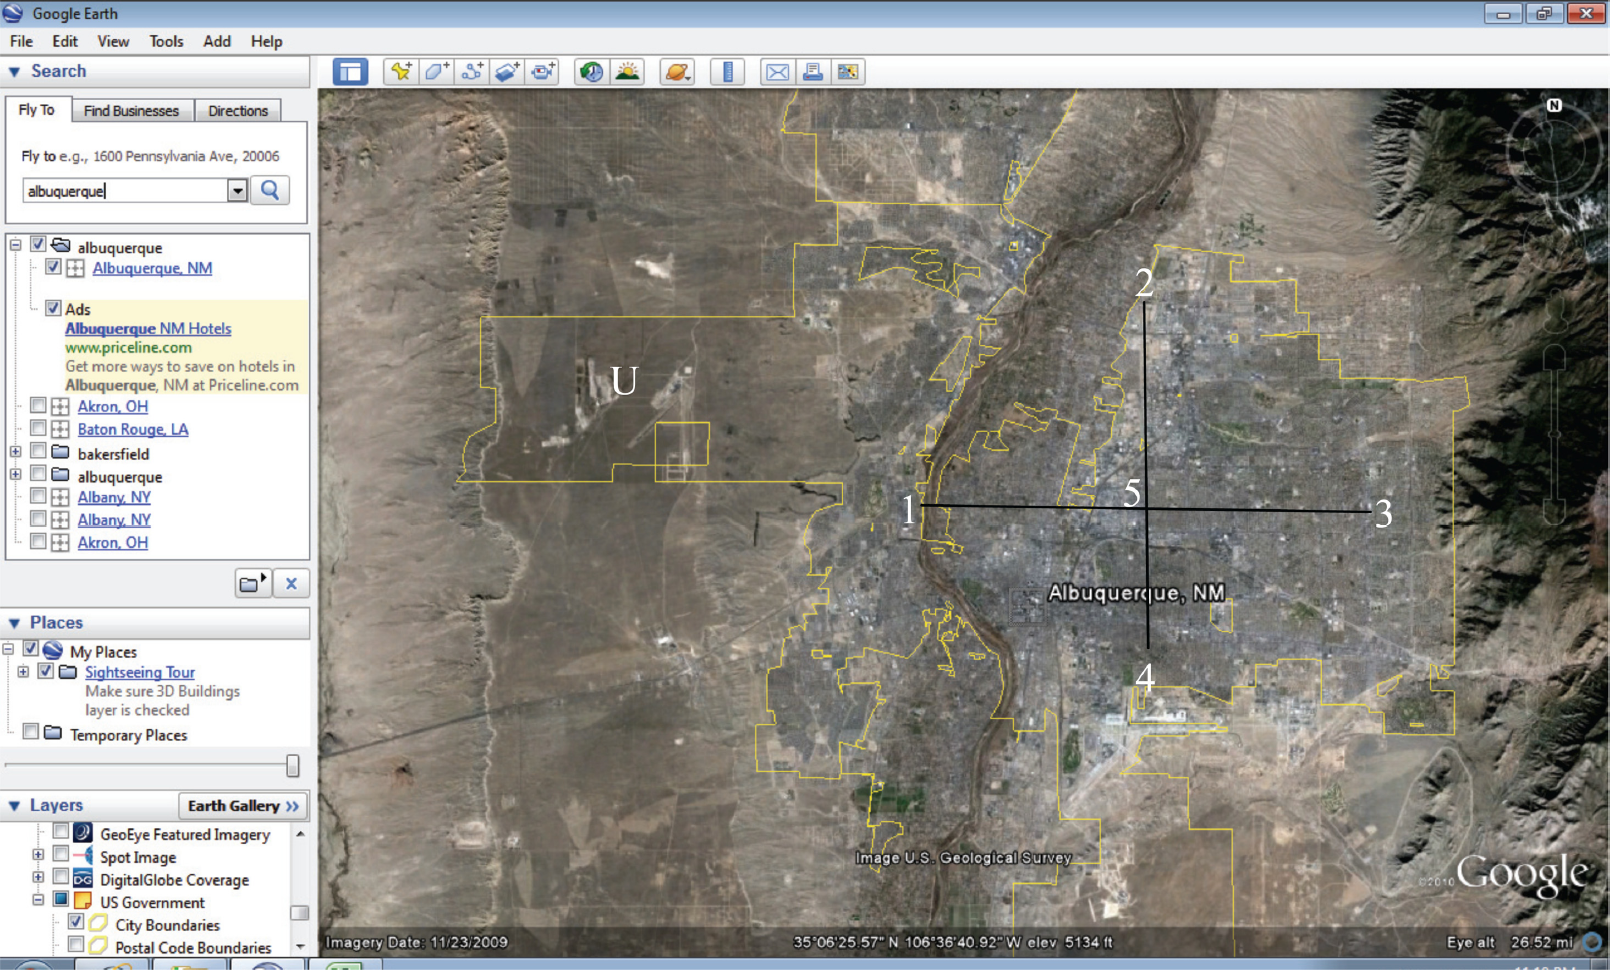
City example from Google Earth for Albuquerque, New Mexico. Mouse of computer held over point where numbers are. When mouse is held over a point, its corresponding elevation is indicated at the bottom of the image. Edited plus sign represents the plus sign imaginarily placed within city boundaries and not extended to areas that appeared to be uninhabited. In this example, the western part of the outlined city, marked with an edited “U,” was considered uninhabited and therefore not included for Albuquerque. Eye altitude located in lower right-hand corner (26.52 miles) while elevation value is located in lower center (5134 ft) according to where mouse was held during storage of image.
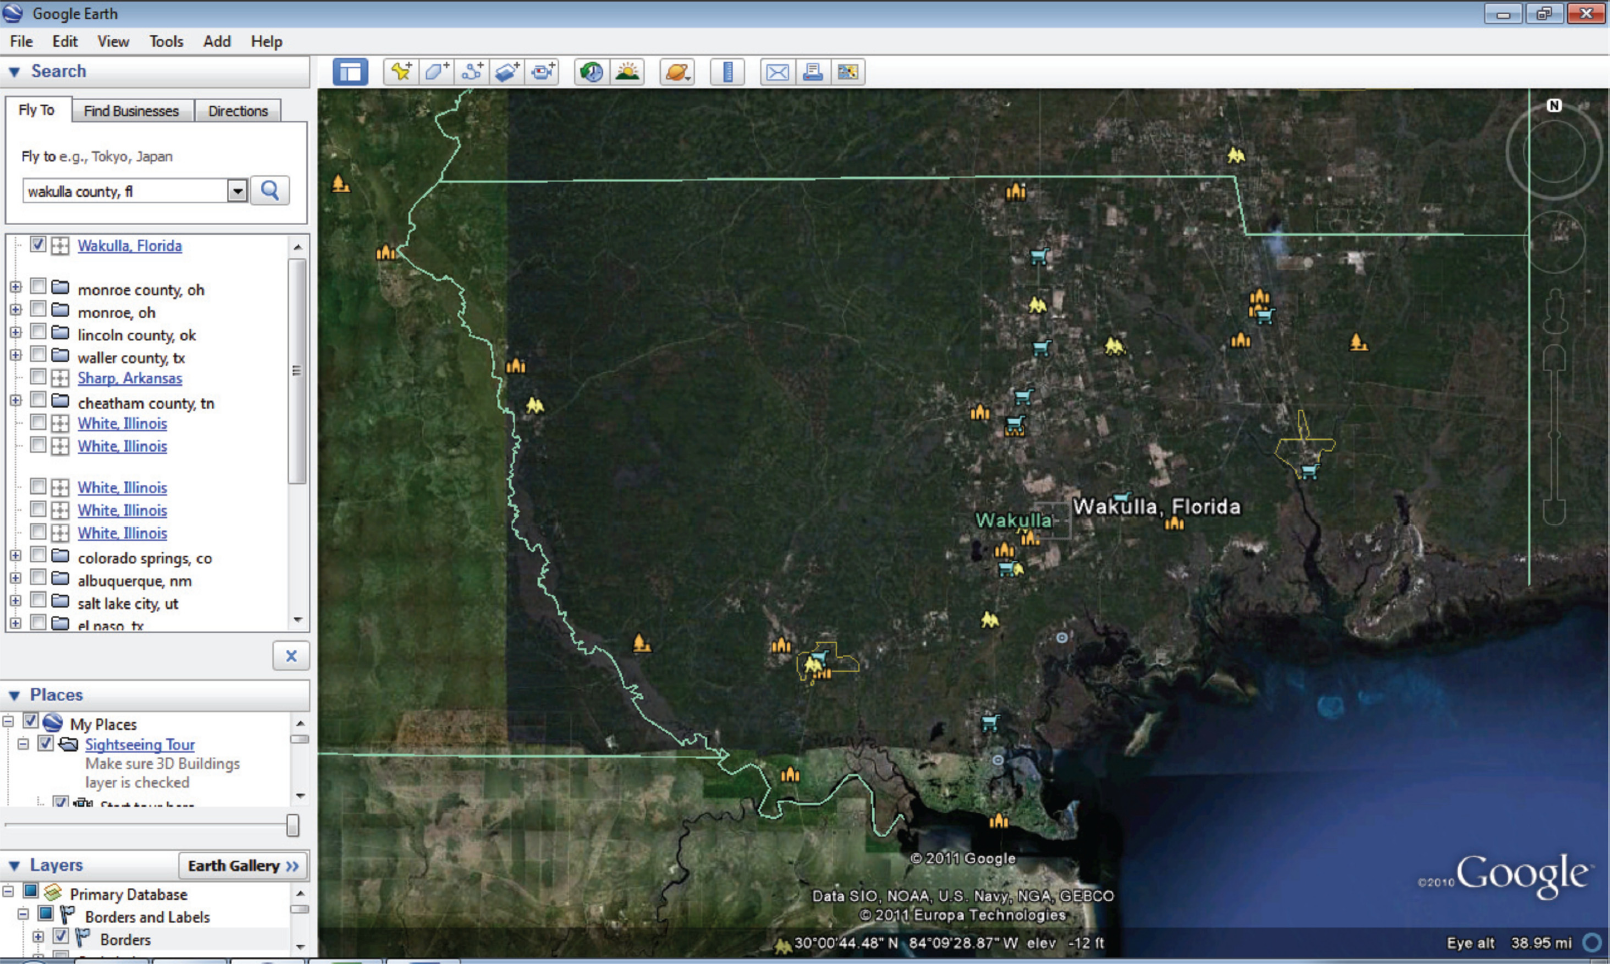
County example from Google Earth for Wakulla County, FL. For imaginary plus sign placement, western and eastern parts of county omitted due to uninhabited areas. Eye altitude =38.95 miles and elevation per location of mouse at the time the image was being saved was −12 (mouse must have been held out in the Gulf where depth was 12 feet).
Environmental variables
It is presumed that an approximate annual increase of 1 mrem accompanies every 100 feet of increased elevation (Sonoma State, 2010). Thus, land elevations < 100 feet were assigned a zero feet value while an elevation of, say, 1000 feet was assigned a 10 mrem value (per year). Barometric pressure (mmHg) and oxygen values (percent compared to sea level) were obtained from an online calculator at altitude.org (Altitude, 2011). The median elevation was entered into the calculator and the BP and OC values were subsequently provided.
Data analysis
Data were analyzed by comparing NBR, BP, and OC values to cancer mortality rates (all cancers and leukemia cancers for cities; all cancers for counties) Using the Pearson correlation test in SAS 9.2 (Cary, NC). Linear multiple regression was not performed for all predictors due to the high variance inflation factors among the predictors.
RESULTS
Cities
Inverse correlations were observed for both AC and LC in relation to NBR though statistically significant for only AC. BP and O2 showed direct correlations for AC and LC though also statistically significant for only AC (Table 3).
Inferential data for cities. r = Pearson correlation coefficient. p = p-value for the coefficient.

Counties
Correlations for all three determinants were statistically significant. The correlation was inverse for NBR while direct for BP and O2 (Table 4).
Inferential data for counties, all cancers. r = Pearson correlation coefficient. p = p-value for the coefficient.

DISCUSSION
In a previous similar study, where mean elevations for entire state (for 50 states and District of Columbia), a stronger correlation was found (0.656; Hart and Hyun, 2010) for NBR compared to what was found in the present study for both cities and counties (∼ −0.460). Assuming city and county findings are more accurate than state, the previous study may have slightly over-estimated the inverse association that appears to exist between NBR and cancer mortality rates. Nonetheless, the previous and present studies both show statistically significant, inverse relationships between land elevation (a surrogate variable for NBR) and cancer mortality, suggesting the presence of radiation hormesis.
The observations for barometric pressure and oxygen concentrations are consistent with Winkelmayer et al. (2009) who found an inverse association between altitude and all-cause mortality among dialysis patients. The observations are also consistent with Weinberg (1987) who theorizes that decreased oxygen levels at higher altitudes provides a protective benefit in regard to cancer and heart disease. The question of which factor or factors are responsible for a possible protective effect, whether NBR, or O2, or BP, or a combination of the three, is beyond the scope of this study.
Other relationships that exist between altitude and health deserve expanded exploration. Recently Kim et al. (2011) found increased suicide rates in higher elevations. They theorize that there may be mood disorders associated with mild cases of hypoxia that are observed in higher altitudes. Other illnesses related to high altitudes include pulmonary hypertension and pulmonary vascular disease (Pasha and Newman, 2010). Vargas et al. (2004) observed an inverse relationship between altitude and pulmonary tuberculosis, theorizing that the relationship might be due to alveolar oxygen pressure changes that occur with changing altitudes.
Limitations to this study include the non-inclusion of other con-founders such as socioeconomic factors. In regard to NBR, certainly there are other variables that contribute to its levels, such as radon and thoron, that in turn can be associated with cancer. The non-increase of leukemia cancers (which are thought to be most commonly related to radiation) raises a question as to whether NBR, at least at the city level, is a factor in leukemia cancers. However, because the city data was not taken from a random sample, such a generalization would lack validity. Stronger, more generalize-able findings (for all cancers) are observed for county results due because of their random sampling and sufficient sample size for a moderate correlation at the 5% error level. In addition to city data not being a random sample, another limitation to the study, for both city and county results is that they have an ecological design, that is, where populations with unverified exposures are assessed. Still, the ecological design gives a clue of what is taking place. Further study, with other designs (e.g., case control), is indicated. Interestingly, the results for city and county data are remarkably similar, with their respective correlation coefficients. The similarities would seem to substantiate findings for both (cities and counties).
CONCLUSION
In this ecological study of U.S. cities and counties, using GIS software (Google Earth), decreased cancer rates were observed with: a) increased natural background radiation levels, b) decreased oxygen levels, and c) decreased barometric pressures. Further study is indicated to either refute or verify these findings.