
Abstract
INTRODUCTION
A recent headline in a Montana newspaper read that a professor there was about to embark on a study on “deadly radon” in Montana (Schontzler, 2010). To check the veracity of the claim, that radon is deadly in Montana, the author ecologically compares lung cancer death rates in Montana counties having different radon levels.
METHODS
Data were obtained for: a) age-adjusted lung and bronchus cancer mortality data (referred to here as “lung cancer”) from the National Cancer Institute (NCI) for 2003–2007, both genders, < age 65, all races (NCI, 2010); and b) radon levels by county from the Environmental Protection Agency (EPA) for Montana (EPA, 2010). These data were collected between 1988 and 1993 (correspondence from EPA to author on 2-22-10). The author assumes that radon levels do not significantly change over time. The age group < age 65 was selected to study the death rates below the age of life expectancy.
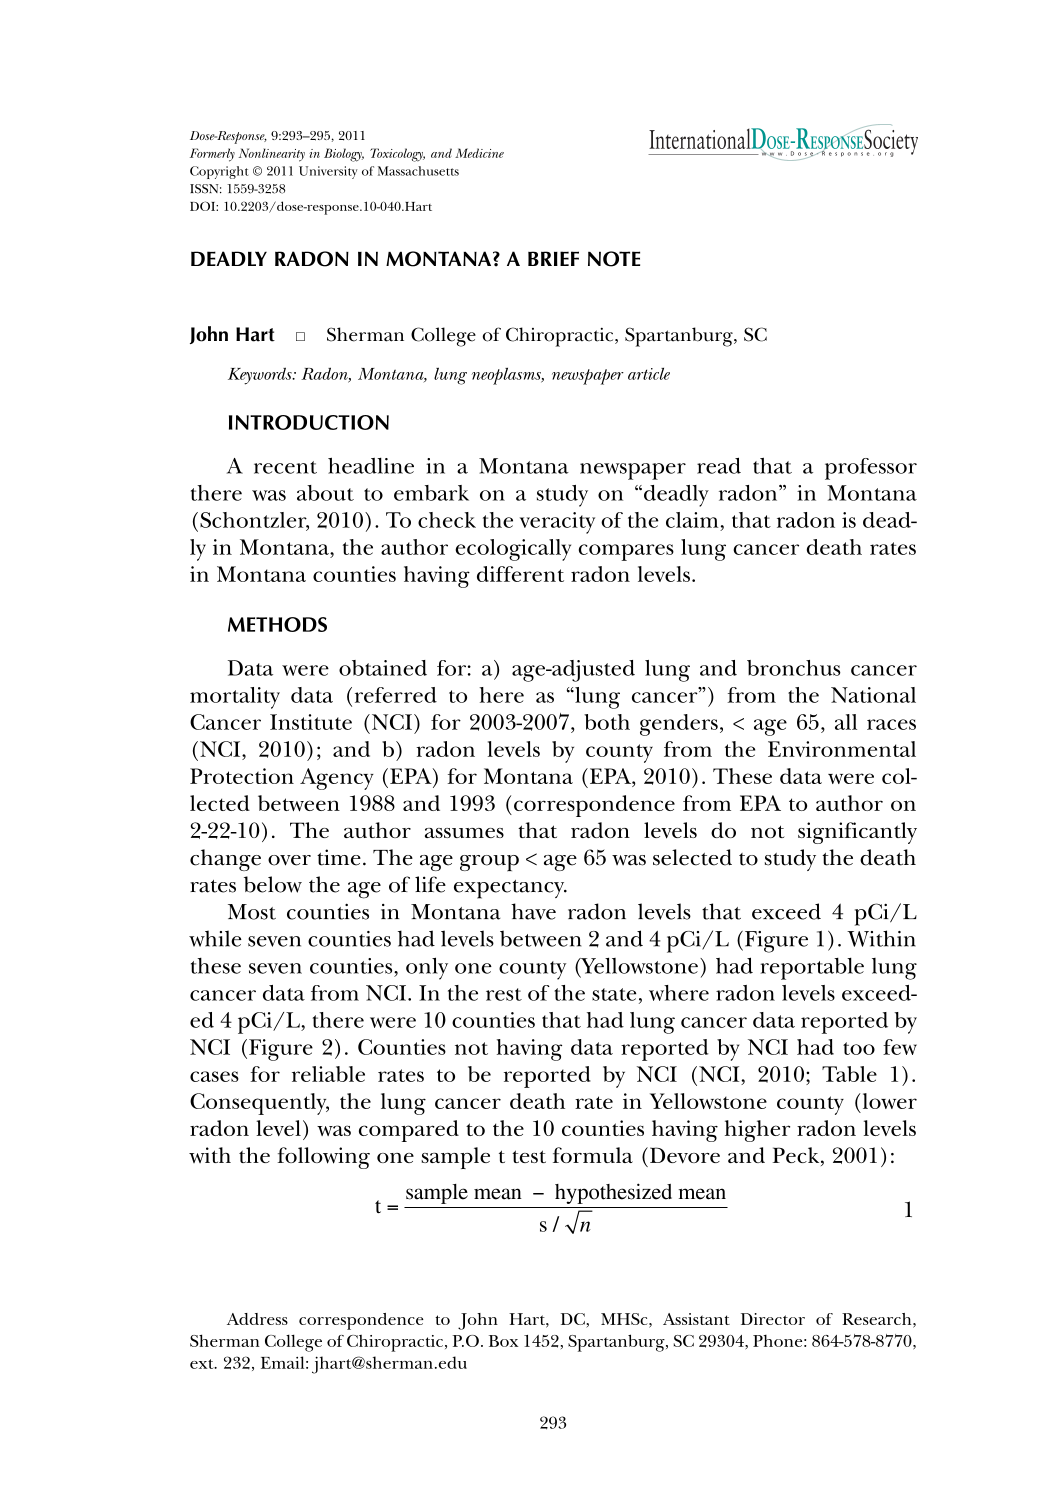
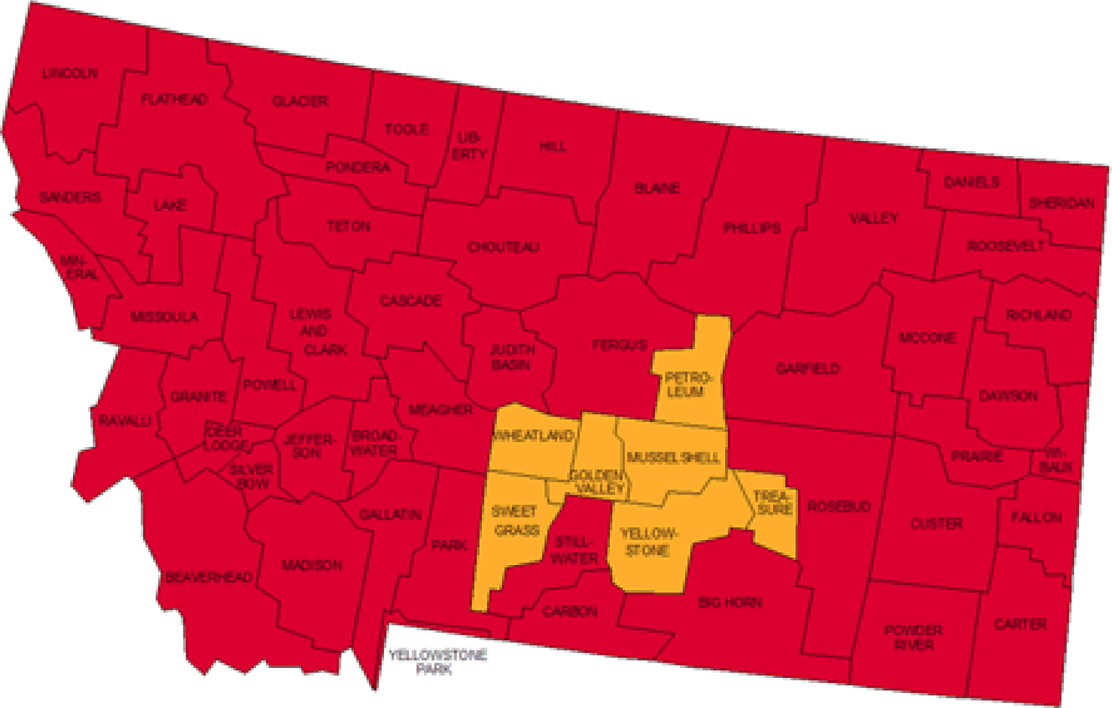
Most counties in Montana have radon levels that exceed 4 pCi/L while seven counties had levels between 2 and 4 pCi/L (Figure 1). Within these seven counties, only one county (Yellowstone) had reportable lung cancer data from NCI. In the rest of the state, where radon levels exceeded 4 pCi/L, there were 10 counties that had lung cancer data reported by NCI (Figure 2). Counties not having data reported by NCI had too few cases for reliable rates to be reported by NCI (NCI, 2010; Table 1). Consequently, the lung cancer death rate in Yellowstone county (lower radon level) was compared to the 10 counties having higher radon levels with the following one sample t test formula (Devore and Peck, 2001):
Radon map of Montana from EPA (2010). Yellowstone county is the only county in the lower radon group of counties that had data reported by NCI (2010).

Lung cancer map from NCI (2010). Yellowstone county, indicated with a “Y,” is compared to the other 10 counties in the higher radon areas (see Figure 1).
Raw and summary data for Montana counties reporting lung cancer mortality rates for 2003–2007.


where sample mean = the mean lung cancer death rate for the 10 counties with higher radon levels, hypothesized mean = the mean lung cancer death rate for the one county with a lower radon level, s = standard deviation of the death rate for the 10 counties with higher radon levels, and n = the number of counties in the sample (=10). A two tailed p value < 0.05 is considered statistically significant.
RESULTS
The mean lung cancer death rate for the lower radon county was 14.7 per 100,000 persons compared to 13.2 per 100,000 person for the higher radon level counties (standard deviation = 4.3). Thus, the formula,
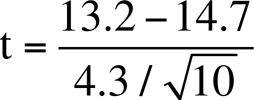
results in a t value of 1.10. A one tailed p value for this t value = 0.150 (Devore and Peck, 2001, Table 4, p. 683), multiplied by 2 for two tails = a p value of 0.30.
CONCLUSION
On average, the lung cancer death rate was higher in the lower radon county compared to the higher radon level counties, though this difference was not statistically significant (p = 0.30). This brief ecological study questions the notion that radon is deadly in Montana, as claimed in the Montana newspaper headline (Schontzler, 2010). Further study is indicated to either support of refute the present findings.
Footnotes
ACKNOWLEDGEMENTS
The author thanks Seunggeun Hyun, PhD (University of South Carolina Upstate) for his advice on the statistical analysis.