
Abstract
The objective of this investigation was to use a pharmacokinetic (PK)/pharmacodynamic (PD) approach to describe and evaluate a PK model of nicotinic acid (NiAc) in guinea pigs and a PD feedback model of changes in non-esterified fatty acid (NEFA) concentrations in rats following multiple intravenous infusions of NiAc at different rates and durations of inhouse and literature (NEFA after extravascular NiAc dosing) data. Serial arterial blood samples were taken for evaluation of NiAc exposure in guinea pigs and NEFA in rats. The biophase kinetics of NiAc was assumed to impact on NEFA turnover with feedback incorporated via an inhibitory moderator compartment. The response acted linearly on the production of moderator, which then acted inversely on the turnover rate of response. The potency, expressed as the amount of NiAc in the biophase causing a 50 % inhibitory effect (ID50 ), was 6.5 nmol ± 31 % and the half-life of response (t1/2, kout ) 2 min ± 18 %. The half-life of tolerance (t1/2, ktol ) was 9 min ± 27 %. The model can be used to provide information about factors that determine the time course of NEFA response following different rates and routes of administration of NiAc or NiAc analogues.
INTRODUCTION
The lipid-lowering effect of nicotinic acid (NiAc) was discovered by Altschul et al. in 1955. NiAc inhibits lipolysis in adipose tissue, resulting in a pronounced decrease in plasma concentrations of non-esterified fatty acids (NEFA) (Carlson and Orö 1962, Carlson 1963). The decrease in NEFA is followed by a decrease in triglyceride (TG), very-low-density lipoprotein (VLDL) and low-density lipoprotein (LDL) plasma concentrations, and an increase in high-density lipoprotein (HDL) plasma concentrations. NiAc treatment has been associated with a decrease in cardiovascular events such as myocardial infarction and death (Canner et al. 1986, Carlson and Rosenhamer 1988, Carlson 2005) and to date is the only approved drug that elevates HDL (Carlson 2005, Offermanns 2006).
In 2003, several groups reported that the G protein-coupled receptor GPR109A (HM74A in humans; PUMA-G in mice) is activated by NiAc at concentrations seen following therapeutic doses (Soga et al. 2003, Tunaru et al. 2003, Wise et al. 2003). Binding of NiAc to the receptor in adipose tissue starts a cascade of events (Fig. 1), which finally results in inhibition of the breakdown of TG into NEFA and glycerol (Offermanns 2006).
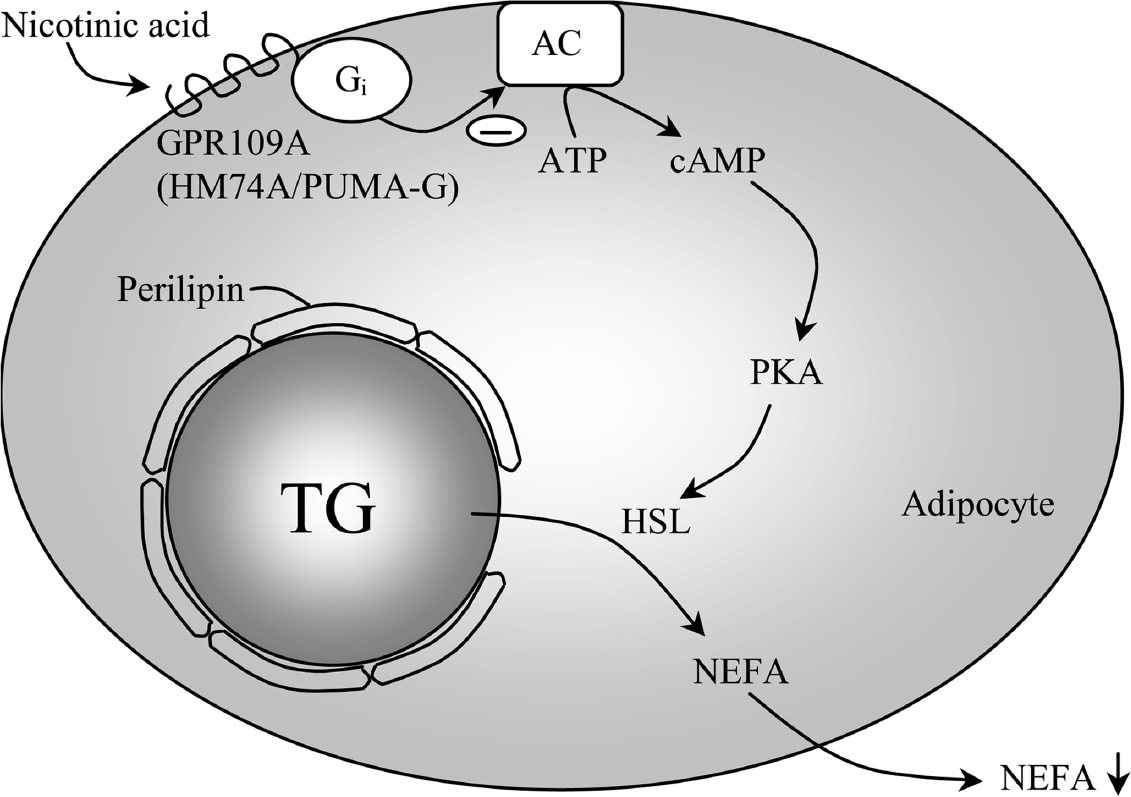
Mechanism of NiAc-induced changes in lipid metabolism. Activation of the G protein-coupled receptor GPR109A by nicotinic acid (NiAc) results in inhibition of adenylyl cyclase (AC) activity, leading to decreased formation of cyclic AMP (cAMP) from ATP. cAMP regulates lipolysis in adipocytes by activating protein kinase A (PKA); in turn, PKA phosphorylates hormone-sensitive lipase (HSL). The hydrolysis of triglycerides (TG) into non-esterified fatty acids (NEFA) and glycerol, which is catalyzed by HSL, is thus reduced by NiAc.
Although, NiAc is an effective and unique hypolipemic agent, side effects such as cutaneous vasodilatation evident as flushing, reduce its therapeutic usefulness. Flushing accompanies pharmacologically active doses and, like the hypolipemic effect, is mediated by activation of the GPR109A receptor (Benyo et al. 2005). Furthermore, the time course of NiAc-induced changes in plasma NEFA concentrations is complex. An initial rapid drop in NEFA concentrations is followed by a rapid return towards and above the predose baseline concentration, known as the rebound effect. To improve the clinical benefit of NiAc, the prostaglandin-induced flush and rebound of NEFA have to be addressed.
Characterizing the drug-induced pattern of NEFA response in terms of modeling may enhance the understanding of its homeostatic control mechanisms and the NiAc exposure-response relationships. These relationships can be used for predicting the onset, intensity and duration of response following different drug exposure scenarios. A quantitative model describing the rate and extent of tolerance and rebound development may also guide for the medicinal chemistry program. A feedback turnover model has proven to be flexible enough to capture the complex time course of the NiAc-induced changes in plasma NEFA concentrations including the subsequent rebound effect upon the rapid washout of NiAc (Gabrielsson and Peletier 2008).
The primary aim of this study was to evaluate a series of in vivo experiments where NiAc had been given to guinea pigs and rats under different experimental conditions, and to develop a pharmacokinetic/pharmacodynamic (PK/PD) turnover model of the NiAc-induced changes in NEFA plasma concentrations. The concentration-time relationship was studied in guinea pigs and the dose-response-time relationship was studied in rats. However, experiments were not originally designed to support PK/PD modeling. Therefore, the presented datasets may appear ‘patchy’, in that full exposure profiles of NiAc were not available from the rat studies on NEFA. Different strategies were followed to resolve these shortcomings, A) High-dose pharmacokinetic data in rats from the literature were used initially but failed (Iwaki et al. 1996), B) Pharmacokinetic data from the inhouse guinea pig studies were scaled allometrically to the rat. But, also this approach was unsuccessful, C) A dose-response-time modeling approach succeeded in mimicking the experimental NEFA data of the rat. The model was then challenged by literature data of NiAc-induced changes of plasma NEFA concentrations after oral administration of test compound (Carballo-Jane et al. 2007). Data were digitized and fitted by means of the proposed dose-response-time model. The secondary aim was to make model simulations to estimate the pharmacological response at different steady-state plasma concentrations and to investigate the impact of tolerance.
MATERIALS & METHODS
Chemicals
Nicotinic acid (pyridine-3-carboxylic acid) was obtained from Sigma-Aldrich (St. Louis, MO, USA) and was dissolved in 0.9 % NaCl. All solvents were of analytical grade and the water used in the experiments was obtained from a water purification system (Elgastat Maxima, ELGA, Lane End, UK).
Analytical assays
Nicotinic acid analysis
Analysis was performed with hydrophilic interaction liquid chromatography (HILIC) and mass spectrometry detection using a triple quadrupole instrument with positive electrospray ionisation and Selected Reaction Monitoring (SRM) acquisition. Plasma samples (50 μl/sample) were precipitated with acetonitrile containing 0.2 % formic acid (150 μl/sample). After vortex mixing and centrifugation at 4 °C, an aliquot of 75 μl of the supernatant was diluted with 75 μl aqueous formic acid (0.2 %). Shimadzu LC-10AD vp pumps were used for gradient elution at 0.6 ml·min1. The mobile phase consisted of (A) 2 % acetonitrile and 0.2 % formic acid in water and (B) 0.2 % formic acid in acetonitrile. The separation was performed on a 50times2.1 mm Biobasic AX column with 5 μm particles (Thermo Hypersil-Keystone, Runcorn, Cheshire, UK) with a gradient of 95 to 20 % B over 1 min, held at 20 % B for 1.5 min and returned to initial conditions in one step. The front was diverted to waste. Detection was performed by positive electrospray ionisation and SRM acquisition with a Micromass Quattro Premier (Waters, Manchester, UK). The mass transition was 124.0>80.2. The experimental parameters were set as follows: capillary voltage 2 kV, source temperature 130 °C, desolvation temperature 400 °C, sample cone voltage 35 V, collision energy 17 eV and argon collision gas flow 0.45 ml·min−1. Data acquisition and data evaluation were performed using MassLynx 4.0.
NEFA analysis
NEFA was analyzed in plasma using an enzymatic colorimetric method (Wako Chemicals GmbH, Neuss, Germany) adapted to a 96-well format. Ten μl of plasma was incubated with 80 μl of color reagent solution A (Acyl-CoA-Synthetase, Ascorbate oxidase, CoA, ATP, 4-Aminophenazone and sodium Azide) at 37°C for 10 min, 150 μl of color reagent solution B (Acyl-CoA-oxidase, Peroxidase and 3-Methyl-N-Ethyl-N-(β-hydroxyethyl)aniline) was added, and the plate was incubated at room temperature for 5–10 min. The plate was read at 550 nm (Spectramax 340 PC, Molecular Devices).
Animals
In the pharmacokinetic studies, male guinea pigs (n=3; HB Lidköpings Kaninfarm, Lidköping, Sweden), weighing 527–677 g, were housed individually in a temperature- (20−22 °C) and humidity-controlled (40–60 % relative humidity) facility with a 12:12-h light-dark cycle (lights on 6:00 am). The animals had free access to chow (K1, Laktamin AB, Stockholm, Sweden), hay and tap water until the day of the experiment.
In the pharmacodynamic studies, male Sprague Dawley rats (n=13, 10 in the treatment group (study 1–4) and 3 in the vehicle group (study 1); Harlan Nederlands B.V.), weighing 383–447 g, were housed in pairs at a room temperature of 20–22 °C and relative humidity of 40–60 % under a 12:12-h light-dark cycle (lights on 6:00 am). They had free access to standard rodent chow (R3, Laktamin AB, Stockholm, Sweden) and tap water.
All experiments were carried out on anaesthetized animals and ethical permission was approved by the Local Ethics Review Committee on Animal Experiments (Göteborg region).
Pharmacokinetics in guinea pig
Surgical procedures and experimental design
On the day of the experiment animals were fasted from 7:00 am. Two hours later they were anaesthetized with an intraperitoneal injection of 66 mg·kg−1 pentobarbital (Apoteket AB, Sweden). The guinea pigs were tracheotomized with PE 240 tubing (Intramedic°, Becton Dickinson and Company, USA) and connected to a small animal ventilator. One catheter of PE 50 tubing (Intramedic®, Becton Dickinson and Company, USA) was placed in a carotid artery for blood sampling and recording of arterial blood pressure. Two catheters of PE 10 tubing (Intramedic°, Becton Dickinson and Company, USA) were inserted into the jugular vein one for infusion of NiAc or saline and the other for infusion of pentobarbital. Blood gas was then analyzed (ABL 505, Radiometer, Copenhagen, Denmark) and the ventilator adjusted to keep blood pH, pCO2 and pO2 within given reference ranges (7.44–7.50, 3.7–4.6 and 11–12, respectively). During the experiment the animals received a constant infusion of pentobarbital (0.18 mg·min−1). A sterile sodium-citrate solution (Na3-citrate, 0.6 % w:v in sterile saline; Pharmaceutical and Analytical R&D, AstraZeneca, Mölndal, Sweden) was used to prevent clotting in the catheters. Body temperature was monitored using a rectal thermocouple and maintained at 38 °C by means of external heating of an external heating lamp.
NiAc (4 mM dissolved in sterile 0.9 % NaCl) was given to each of 3 guinea pigs as 5 consecutive 20 min constant infusions, after each of which the infusion rate was doubled (Table 1). Following the fifth infusion there was a 40 min washout period, after which the protocol was repeated. Blood samples (∼120 μl) were collected prior to each change in NiAc infusion rate and during both washout periods for subsequent analysis of NiAc (Fig. 2). The samples were collected in EDTA-coated polyethylene tubes and kept on ice until they were centrifuged (10 000 × g, 1 min, 4 °C). The plasma was stored at −20 °C pending analysis.
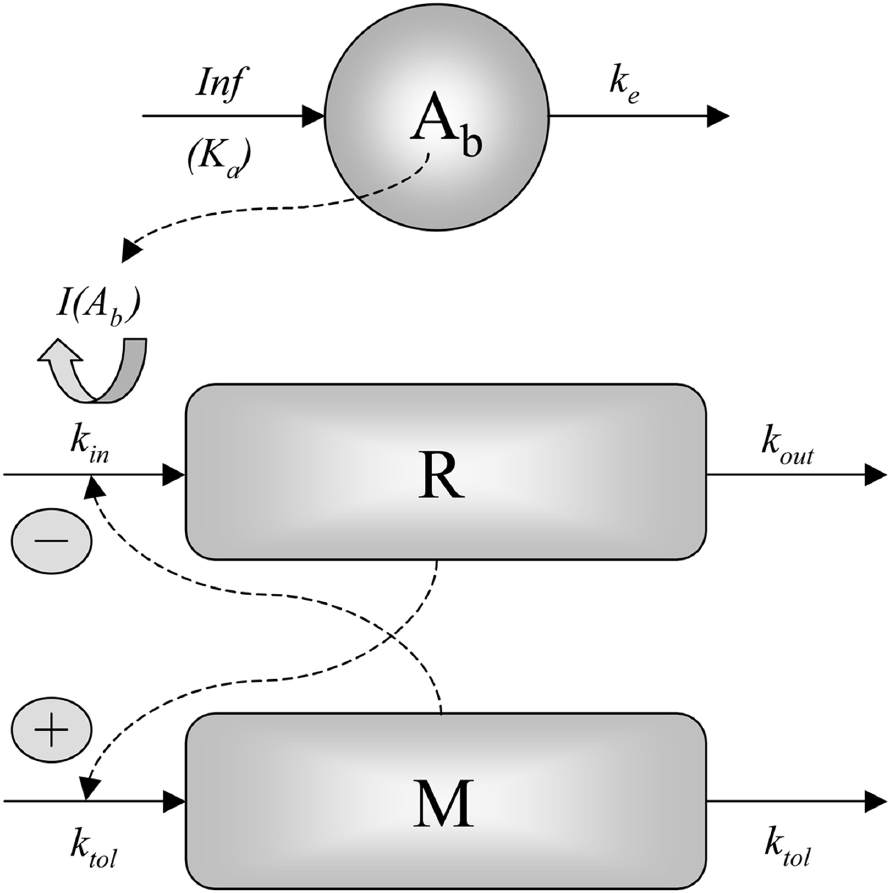
Schematic illustration of the negative feedback model of NEFA metabolism in rats. The biophase kinetics of NiAc acts on the production of NEFA (response R) via the inhibitory drug function I(Ab). R acts linearly on the production of the moderator M, which in turn acts inversely on the production of R. Solid lines denote build-up and loss, and dashed lines indicate how the different compartments influence each other.
NiAc dosing regimens for the pharmacokinetic studies in guinea pigs

Pharmacokinetic model of nicotinic acid in guinea pigs
A one-compartment infusion model (Eq. 1) was used for the pharmacokinetic analysis of NiAc concentration-time data from guinea pigs.
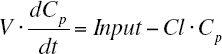
where CP is the plasma concentration of NiAc, Input is the dosing regimen of NiAc, V is the volume of distribution and Cl clearance. A two-compartment model was also evaluated.
Pharmacodynamics in rat
Surgical procedures and experimental design
In order to characterize the complex drug-induced pattern in NEFA response, changes in NEFA plasma concentrations following administration of NiAc were studied in 13 anaesthetized rats (referred to as studies 1 to 4), each of which employed a different constant intravenous dosing regimen (Table 2).
NiAc dosing regimens for the pharmacodynamic studies in rats

n=7 in the treatment group and n=3 in the control group of Study 1
3 min stepwise rate changes
The surgery and handling of the animals before, during and after surgery were similar in all four studies. On the day before the experiment, the rats received 6 g of standard rodent chow (R3) at 3:30 pm. At 7:00 am on the experimental day they were weighed individually and moved to clean cages without food. At 9:00 am they were anaesthetized with an intra-peritoneal injection of Nathiobutabarbital (Inactin®, Sigma Chemical Co., St Louis, MO, USA), 180 mg·kg−1 BW. The rats were tracheotomized with PE 240 tubing (Intramedic®, Becton Dickinson and Company, USA) and allowed to breathe spontaneously. One catheter (PE 50 tubing; Intramedic®, Becton Dickinson and Company, USA) was placed in a carotid artery for blood sampling and recording of arterial blood pressure. Two catheters (PE 10 tubing; Intramedic®, Becton Dickinson and Company, USA) were inserted into one jugular vein, one for infusion of NiAc or vehicle and the other for infusion of diluted Nathiobutabarbital if the level of anesthesia had to be increased. A sterile sodium-citrate solution (20.6 mM Na3-citrate in sterile saline; Pharmaceutical and Analytical R&D, AstraZeneca, Mölndal, Sweden) was used to prevent clotting in the catheters. Body temperature was monitored using a rectal thermocouple and maintained at 37.5 °C by means of an external heating lamp. Blood pressure, heart rate and body temperature were continuously monitored (data not shown) on a custom-made computerized recording system (Pharmlab, AstraZeneca R&D Mölndal, Sweden). The animals were allowed a minimum post-surgical recovery period of 1.5 h to enable glucose levels to stabilize.
NiAc dissolved in sterile 0.9 % NaCl was given to rats in four different dosing regimens (Table 2), with the concentrations of the dosing solutions being adjusted to give infusion flow rates in the range of 0.7–40 μl·min1. Three control animals were given the vehicle (sterile 0.9 % NaCl) in the same dosing regimen as study 1. Following dosing there was a washout period. Blood samples (∼30 μl) were collected for analysis of NEFA predose, and during the infusions and washout period. The total sampled blood volume per rat was 0.7 ml in study 1, 0.5 ml in study 2, 0.4 ml in study 3 and 0.7 ml in study 4. The blood samples were collected in EDTA-coated tubes and kept on ice until they were centrifuged (10 000 × g, 1 min, 4 °C). The plasma was frozen at −20 °C pending analysis.
Pharmacodynamic model in rats
One set of pharmacological experiments was selected for the regression analysis. Because study 1 was the most informative experiment, containing several provocations of the system including a multiple stepwise increase in NiAc infusion rate followed by a washout period and included the highest number of rats, the model was primarily built on this experiment. It was then applied to the other three experiments.
Since no plasma concentrations of NiAc were available from the rat experiments and applying the two-compartment model with parallel first-order and Michaelis-Menten elimination proposed by Iwaki et al. (1996) failed, a biophase kinetic model was applied with the turnover model. The biophase kinetics of NiAc was modeled according to Equation 2:
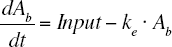
where Ab , Input and ke are the drug amount in the biophase, the multiple infusion regimen and the first-order elimination rate constant of NiAc in the biophase, respectively. Then the biophase kinetics of NiAc was assumed to impact on NEFA turnover via an inhibitory Imax model, as shown in Equation 3:
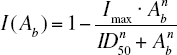
Ab, Imax, ID50 and n are the drug amount in the biophase, efficacy (maximum drug-induced inhibitory effect of formation of response i.e. of the NEFA response), potency (amount in biophase reducing the formation of response by 50 %) and sigmoidicity factor, respectively. The mechanism of action of NiAc on NEFA plasma concentration (response R) is via inhibition of turnover rate, as shown in Equation 4:

where kin, M, kout and I(Ab) are the turnover rate, moderator, fractional turnover rate and drug inhibitory function (Eq. 3), respectively. The moderator M was assumed to inhibit the production of R, rather than stimulating the loss of R. It is known from the literature (Frayn 2003) that e.g. insulin, among other mechanisms of action, suppresses the formation of NEFA. The model aims at mimicking this process. The negative feedback model whereby NiAc regulates NEFA metabolism is shown schematically in Fig. 2.
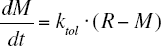
A change in R impacts on the moderator M via a first-order process ktol · R (Eq. 5). The build-up and loss of M are governed by the first-order rate constant for development of tolerance ktol .
The baseline is characterized by
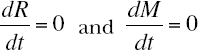
This means that for the baseline (R0, M0 ) there are two equations:

and

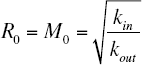
Solving for R0 and M0 yields
At steady state ss and taking account of the inhibitory function I(Ab ss ), Equation 9 becomes:
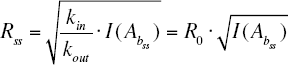
which is the relationship between R0 and Rss with drug present and in the presence of moderator.
Initial parameter estimates of R0 , kout and Imax were derived graphically according to Fig. 3 and Equations 9–15. The initial value of kout was estimated from the slope of the initial downswing of the response-time curve. At a high dose, Ab exceeds ID50 , and Equation 3 reduces to:

Schematic illustration of the rationale for estimating initial values of R0, kout and Δ.

If we assume that Imax ≈ 1, then I(Ab) ≈ 0 and the term kin · 1/M · I(Ab) in Equation 4 cancels out, giving the approximate first-order expression:
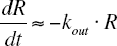
A semi-logarithmic plot of R versus t gives a slope of -kout .
The algebraic solution to the differential Equation 12, kout can be expressed as:
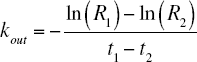
where R1 , R2 , t1 and t2 are the response at one time point, the response at a second time point, and the two corresponding time points, respectively. The maximum decrease in NEFA Rmin at steady state is described by the following expression, where Ab is assumed to be much greater than ID50 :

The efficacy Imax is determined by using the Δ-response (Fig. 3), which is the difference between the baseline R0 and the lowest observable steady state response Rmin , according to:

This equation can be rearranged and solved for Imax . The n parameter was initially set to 2 and the ktol parameter was approximated to one half of kout .
Because no drug concentration measurements were available in the experiments where response was measured, the elimination rate constant ke had to be estimated. The initial parameter estimate of ke was approximated from the guinea pig plasma concentration-time data scaled to rat. From the data shown in Fig. 3, the time for half maximum response was approximated to 35 min. By using the initial estimate of ke it was possible to simulate Ab , hence determining the amount at 35 min. This was then used as an initial estimate of ID50 .
The initial estimate of volume of distribution was scaled from guinea pig to rat. By using this scaled volume of distribution Vrat , the ID50 can be converted to an IC50 value according to:

The expression of Rss for a tolerant system (Eq. 10) can then be rewritten

Removing the impact of the moderator compartment (feedback) results in a non-tolerant system:

Two differential equations (Equations 4 and 5) were individually fitted to the response-time curve obtained from the different dosing scenarios using the Gauss-Newton (with the Levenberg and Hartley modification) algorithm of WinNonlin (version 4.1, Pharsight Corporation, Palo Alto, CA, USA). A constant absolute error model was used for weighting of data.
Analysis of literature data (Carballo-Jane et al. 2007)
In a recent study NiAc or vehicle was given as oral doses (vehicle, 3, 10, 30, 100 and 300 mg·kg−1) to conscious male Sprague Dawely rats (n=30), and NEFA was measured at selected (20 min, and 1, 2 and 4 h post-dose) time points in plasma (Carballo-Jane et al. 2007). In order to quantitatively evaluate their data, the NEFA response time-courses from the 3, 10, 100 and 300 mg·kg−1 doses were digitized. The relative (%) NEFA values presented by Carballo-Jane et al. (2007) were recalculated using a 0.5 mmol·l−1 baseline value. A first-order input-output biophase model was used to drive the drug mechanism function of Equation 3. The drug-mechanism function was then included in the turnover equation as shown in Equation 19:
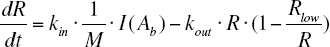
where Rlow is the physiological lower limit of the response.
The model parameters to be estimated were the first-order biophase absorption rate constant Ka , the baseline value R0 , the fractional turnover rate kout , the rate constant of M·ktol and potency expressed as ID50 .
The PK/PD turnover model, used in the previous analysis, was fitted to the NEFA response time-courses of the 3, 10, 100 and 300 mg·kg−1 doses, and the elimination rate constant ke was fixed to 0.4 min−1 according to our previously estimated values, and the bioavailability was assumed to be equal to unity. Although high exposure to NiAc followed the higher doses, the NEFA concentrations were not reduced to zero. Therefore, a physiological lower limit was included into the turnover model according to Yao et al. (2006).
RESULTS
Pharmacokinetics in guinea pig
Observed and predicted (one-compartment model) average plasma concentrations of NiAc following consecutive infusions of NiAc are shown in Fig. 4.

Plasma NiAc concentration-time profile in guinea pigs (n=3) after two intravenous infusion regimens each increasing every 20 min from 32, to 64, 128, 256 and finally 512 nmol·min−1. The two incremental regimens were separated by a washout period of 40 min. The solid squares are the mean observed concentrations, vertical lines show standard deviation, solid lines the average of three model-predicted curves, and shaded areas the stepwise increases in NiAc infusion.
The exposure ranged between 0.05 and 17.5 μmol·l−1. The average clearance was 70.5 ml·min−1·kg−1 ± 2.1 %, the average volume of distribution was 0.15 l·kg−1 ± 10.6 % and the average half-life was 1.5 min ± 10.2%, respectively. The observed and predicted concentrations were consistent.
A two-compartment model was also fitted to the three individual concentration-time profiles. However, this analysis resulted in highly correlated parameters with poor precision. Even though the fit to the terminal concentration-time points was better than analysis using the one-compartment model, the latter approach was preferred because the contribution of the terminal phase of the two-compartment model to the overall assessment of clearance and volume terms was negligible, as a consequence of the plasma concentration falling more than two orders of magnitude within the first 15 min after stopping the infusion.
Pharmacodynamics in rat
The averaged plasma NEFA concentrations after administration of NiAc (n=7) or vehicle (n=3) according to the dose regimen of study 1 are shown in Fig. 5.

Time profiles of the plasma NEFA concentrations after intravenous administration of NiAc ((black filled squares), n=7) or vehicle (0.9 % NaCl (gray filled squares), n=3) as six consecutive infusions of 0.8, 1.6, 3.2, 6.4, 12.8 and 25.6 nmol·min−1 with the infusion rate doubled every 30 min and stopped at 196 min. The break at 90–96 min was due to changing the syringe. Data are presented as mean, and vertical lines represent the standard deviation.
The observed and predicted pharmacological response, expressed as changes in plasma NEFA concentrations, following different infusion regimens of NiAc (study 1, one individual rat) are shown in Fig. 6.

Time course of observed (symbols) plasma NEFA concentrations (mmol·l−1) following constant rate intravenous infusions of NiAc to male Sprague Dawely rats. NiAc administration commenced at t = 0 min. The solid black lines represent the effect predicted by the negative feedback model. A) Study 1 - The fit of an individual rat treated with NiAc as six consecutive infusions of 0.8, 1.6, 3.2, 6.4, 12.8 and 25.6 nmol·min−1 with the infusion rate doubled every 30 min and stopped at 196 min. The break at 90–96 min was due to changing the syringe. The solid gray line represents the fit of the pool/precursor model to the same individual. B) Study 2 - A constant rate of 25.6 nmol·min−1 given over 30 min. C) Study 3 - Two consecutive infusions of 32 and 64 nmol·min−1. The infusion rate was increased at 73 min and the total time of infusion 104 min. D) Study 4 - Infusion rate increased stepwise from 0 to 13 nmol·min−1 over 30 min, held constant at 13 nmol·min−1 over 30 min, and decreased stepwise from 13 nmol·min−1 to 0 over 30 min.
The predose baseline NEFA concentrations were 0.55 (average of 7 rats), 0.49, 0.34 and 0.43 mmol·l−1 in study 1 (n=7 (treated), n=3 (vehicle)), 2 (n=1), 3 (n=1) and 4 (n=1), respectively. In the vehicle group (study 1) NEFA stayed constant throughout the experiment (gray symbols, Fig. 5). NiAc induced decreases in the plasma NEFA concentrations to a minimum of 0.076 (average of 7 rats), 0.11, 0.058 and 0.14 mmol·l−1 in study 1 to 4, respectively. Relative to the predose baseline measurements the concentrations were reduced in the four studies by 86 % (average of 7 rats), 78 %, 83 % and 67 %, respectively. The NEFA concentrations at the peak of the rebound were, respectively, 0.76 (average of 7 rats), 0.84, 0.85 and 0.55 mmol·l−1, which corresponds to a 38, 71, 150 and 28 % rise above baseline, respectively. In study 1, dosing was stopped for about 5 min between infusions 3 and 4. This brief interruption resulted in an increase in average plasma NEFA concentration from 0.36 to 0.57 mmol·l−1. There was a slight indication of development of tolerance in study 1, evidenced as an increase in plasma NEFA concentrations during several of the 30 min infusion periods (Fig. 5 and 6A).
The feedback model with biophase kinetics was fitted to individual response-time data from the different studies. The average final parameter estimates and their precision (average relative standard deviation CV%) are shown for study 1 in Table 3. The model-predicted NEFA concentrations were consistent with the experimental data, the precision of the estimates was high for all parameters, and they showed low correlation. The range of each estimate from applying the model to all four studies is shown in brackets in Table 3. Since no plasma concentrations of NiAc were available from the rat experiments, the applicability of the two-compartment model with parallel first-order and Michaelis-Menten elimination proposed by Iwaki et al. (1996) was evaluated. However, as systematic deviations between fitted and experimental NEFA response-time data were observed, and biased and imprecise parameter estimates were calculated, this disabled its further use as a ‘driver’ of the NEFA response-time data.
Initial and final estimates of the turnover model parameters ± CV %*

Final estimates from study 1 are presented as mean ± mean CV%. Here the CV% is the precision of the parameter estimate calculated as (SD/mean) · 100 in WinNonlin
Range from all studies
From analysis of data reported by Carballo-Jane et al. (2007)
The present analysis of NiAc-induced plasma NEFA responses predicts a t1/2 ke of 2 min (2 – 3 min) ± 18 %, a t1/2 kout of 3 min (2 – 5 min) ± 31 % and a t1/2 ktol for tolerance development of 9 min (9 – 30 min) ± 27 %. Initially, maximum efficacy Imax (Eq. 3) was used as a model parameter. However, as it was estimated to very close to unity, we then assumed complete inhibition of the plasma NEFA turnover rate at a high NiAc concentration, and set Imax to unity.
The ID50 value was translated into an ID50 value according to Equation 16, using an estimate of the volume of distribution of NiAc based on rat data (0.17 l). ID50 was estimated to 0.038 μmol·l−1. The concentration-response relationship between NiAc and NEFA at equilibrium, was then simulated by means of Equation 17 (Fig. 7) with feedback present. The corresponding relationship for a non-tolerant system (i.e. without feedback, Eq. 18) is shown in Fig. 7 for comparison. To reduce plasma NEFA concentrations to about 0.1 mmol·l−1, NiAc concentrations of 0.1 and 0.5 μM are needed for the non-tolerant and tolerant system, respectively.
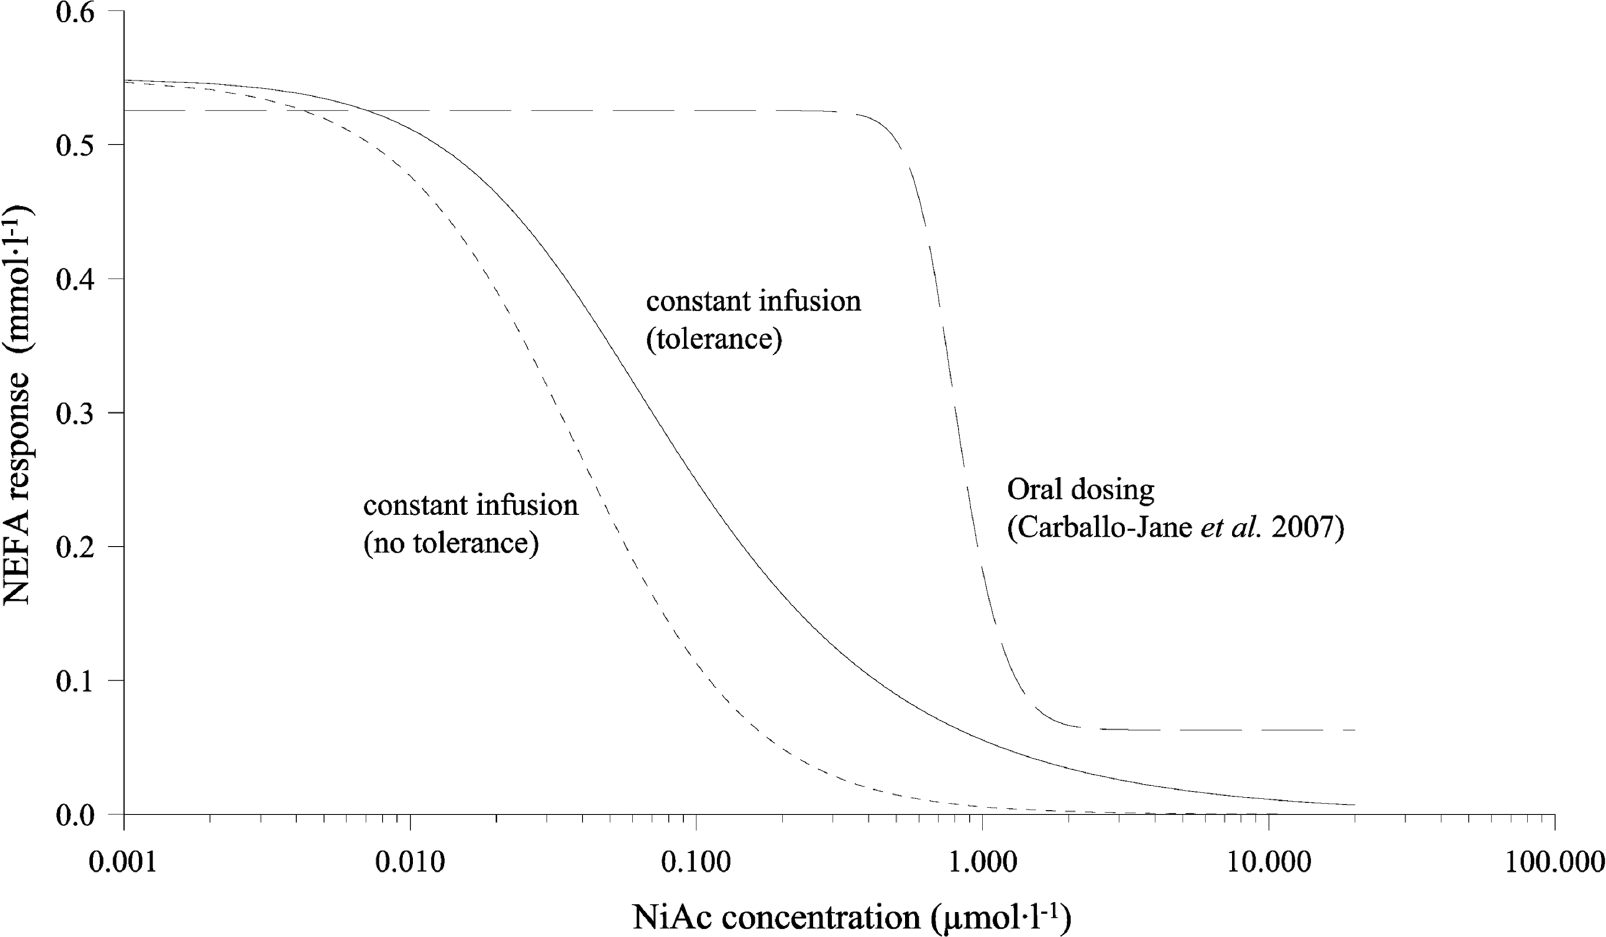
Simulated steady state plasma NiAc concentration vs. response (plasma NEFA concentrations). The solid line uses the final estimates from study 1 of R0 (0.55 mmol·l−1) and n (1.4), and the approximated value of ID50 (0.038 μmol·l−1) with tolerance included (Eq. 17). The lefthand dashed line uses the same estimates but without tolerance included in the model (Eq. 18). The righthand dashed line represents the estimates from Carballo-Jane et al. (2007), with inclusion of a physiological lower limit (Rlow , Eq. 19) of 0.063 mmol·l−1.
The NEFA response-time data were also analyzed by means of a pool/precursor model (Licko and Ekblad 1992, Bauer et al. 1994, Sharma et al. 1998). Since the basic pool/precursor model gives an area under the rebound curve that is per definition equal to the area under the response curve, it failed to acceptably mimic the experimental NEFA response-time data (Fig. 6A), resulting in biased and imprecise parameter estimates and was therefore abandoned in the subsequent analysis.
Analysis of literature data (Carballo-Jane et al. 2007)
The model-predicted responses were consistent with the experimental data as shown in Fig. 8. The final parameter estimates and their precision (CV %) are shown in Table 3. The model predicted equilibrium relationship between NiAc and NEFA response is shown in Fig. 7. When fitting the data of Carballo-Jane et al. (2007), the elimination rate constant ke of the biophase compartment was fixed to a constant value of 0.4 min−1, obtained from the analysis of our own data following multiple intravenous infusion of NiAc. The analysis predicts a t1/2 kout of 4 min ± 12 % and a t1 /2 ktol for tolerance development of 20 min ± 19 %. The absorption rate constant Ka following oral administration was estimated to a twentieth (0.021 min−1) of the elimination rate constant ke of the biophase model, with a half-life of ∼ 35 min, which indicates absorption rate limited elimination of NiAc. We also applied the two-compartment disposition model with parallel first-order and Michaelis-Menten elimination by Iwaki et al. (1996), as a ‘driver’ of the NEFA response-time data. Again, systematic deviations between fitted and experimental NEFA response-time data and biased and imprecise parameter estimates were seen.

Data from a study performed by Carballo-Jane et al. (2007). Observed (symbols) and predicted (solid line) response (plasma NEFA concentrations, mmol·l−1)-time following oral administration of 3 mg·kg−1 (▪), 10 mg·kg−1 (•), 100 mg·kg−1 (▾) and 300 mg·kg−1 (▴) of NiAc to male Sprague Dawley rats. At time t = 0 min and t = 20 min all observed data points are superimposed. The baseline response of 100 % was fixed to 0.5 mmol·l−1 for comparison with the in-house experiments (see Fig. 6).
DISCUSSION
NiAc treatment simultaneously decreases LDL and increases HDL cholesterol levels (Offermanns 2006), and decreases cardiovascular events such as myocardial infarction and death (Canner et al. 1986, Carlson and Rosenhamer 1988, Carlson 2005). While other drugs such as statins produce similar effects, it may be the drug of first choice if tolerated by the patient. However, use of NiAc is limited because it is associated with cutaneous flushing and a substantial rebound of plasma NEFA concentrations above predose baseline levels. For this reason, there is a need for better understanding of the mechanism behind the complex regulation of plasma NEFA metabolism and its feedback mechanisms (e.g. insulin). Thorough quantitative analysis of the time-course of the plasma NEFA response to NiAc provides one source of important information about this system.
In the present work, a one-compartment pharmacokinetic model was developed to describe the concentration time-course of NiAc in guinea pigs. The plasma kinetics of NiAc was rapid, with a clearance of 70 ml·min−1·kg−1 and a low volume of distribution of 0.15 l·kg−1, resulting in a half-life of about 1.5 min. A two-compartment model was also fitted to the concentration-time data but the parameter precision was low, and the contribution of the terminal phase to the overall assessment of clearance and volume terms was negligible because the plasma concentration fell more than two orders of magnitude within the first 15 min after stopping infusion. However, since NiAc exhibits nonlinear pharmacokinetics in rats at higher concentrations (Iwaki et al. 1996), a multi-compartment approach may be necessary to obtain a complete description of NiAc disposition in guinea pig plasma.
A pharmacodynamic feedback model was developed to characterize the turnover of plasma NEFA concentrations in rats following administration of NiAc using different infusion regimens. Regulating processes, which inversely affect the formation of plasma NEFA, are included as a single unit (moderator M) in the pharmacodynamic model. The aim of developing this mechanistic turnover model is to provide a means for obtaining quantitative information about factors that determine the time-course of the plasma NEFA response following acute dosing of NiAc. In short, this model will serve as a preclinical tool for analyzing and simulating drug-induced changes in plasma NEFA concentrations after treatment with, for example, NiAc or NiAc analogues.
An important aspect of physiological systems is that one or more biomarkers can be studied under varying conditions. For example, a biomarker of interest (e.g. glucose) can be administered and its disposition measured after different rates, routes and modes of administration. Alternatively, the system can be perturbed by something (e.g. insulin) that regulates the biomarker of interest (e.g. glucose). The biomarker used in this investigation was plasma NEFA concentrations, which provide a measure of a conglomerate of fatty acids with varying chain lengths targeted by treatment with NiAc (Frape et al. 2000). Because the mechanism of NiAc action is via inhibition of the release of NEFA into plasma, it is preferable to study the turnover of the plasma NEFA pool by varying the rate of NiAc input and the extent of NiAc exposure. To do this, we have used a multiple infusion technique, varying the rate and duration of dosing with NiAc. The NEFA datasets analyzed in this study were originally designed to qualitatively assess the behavior of plasma NEFA concentrations after different NiAc provocations, rather than for modeling purposes. As a result, the sampling schedule was intended to detect the maximum and minimum response to NiAc, and to demonstrate the rebound phenomenon. In view of this, the data collected were more exploratory than optimal in the context of parameter identification.
In spite of the above reservations, however, the experiments display some interesting features of plasma NEFA turnover when analyzed quantitatively using the regression model (Fig. 2), and highlight some of the pros and cons of the proposed turnover model. We will challenge some of these (e.g. the observation that the turnover of plasma NEFA is a more rapid process than that of the regulating processes M) in future experiments. Other findings of particular interest are the almost complete inhibition of NEFA by NiAc and the rapid and pronounced rebound of plasma NEFA concentrations after cessation of NiAc infusion. The primary reason NiAc is a suitable compound for studying tolerance and rebound of NEFA is its rapid plasma kinetics. With a NiAc plasma concentration half-life of only 1–3 min, it is possible to affect multiple changes in NiAc infusion rates and steady-state concentrations all with rapid washout profiles, in turn optimizing conditions for rebound of plasma NEFA concentrations.
The most common approach in PK/PD modeling is to let the plasma concentration time-course drive the drug mechanism function acting on the production or loss term of the turnover model. Three different approaches were used to resolve the lack of good NiAc exposure profiles used to ‘drive’ the pharmacodynamic model, A) High-dose pharmacokinetic data in male Wistar rats were initially used to predict the exposure to low-dose NiAc in male Sprague Dawely rats used for NEFA modeling, B) Pharmacokinetic data from the presented guinea pig studies were scaled allometrically to the Sprague Dawely rats. Both approaches, A) and B), failed to successfully ‘drive’ the pharmacodynamic model fitted to NEFA plasma concentrations. This may be due to the fact that highdose data poorly predicts the time-course of low-dose data particularly when one extrapolates from Wistar to Sprague Dawely rats or from conscious to anaesthetized animals, or scaling from one species (guinea pig) to another (rat). In the absence of measured plasma concentrations or when there is scanty information about exposure-time relationships, a parametric biophase model has been proposed, linking input of dose to drug mechanisms of action (Smolen 1971, Gabrielsson et al. 2000). Although the biophase kinetic model may not exactly represent the plasma kinetics of NiAc, it still contributes to the estimation of the system parameters (e.g. kout, ktol ) and drug parameter ID50 , which in turn can be converted to an IC50 value using the volume of distribution of NiAc. Approach C) resulted in high consistency between experimental and model predicted NEFA data.
Using a multiple intravenous infusion technique, NiAc was shown to reduce plasma NEFA concentrations in rats by 67–86 % below baseline, followed by a post-infusion rebound of 28–150 % above predose baseline. It was assumed that the formation of plasma NEFA could be totally blocked by high exposure to NiAc (Imax equal to 1). Indeed, when Imax was included in the model the estimate approached unity, supporting the assumption of total blockage. Although reasonably high doses of NiAc were given, plasma NEFA concentrations did not decline to zero, which might indicate a physiological minimum below which plasma NEFA concentrations remain unaffected by NiAc. While such a physiological limit was included in the model according to Yao et al. (2006), the estimated minimum was negligible.
The ranges of all final parameters estimates are shown in brackets in Table 3. It can be noted that the final parameter estimates from study 1 fall either on the lower or upper boundary for several of the parameters. We believe that the challenging design of the multiple consecutive infusions regimen (n=7) may reveal a more correct behavior of the system. Studies 2–4 are more of an exploratory nature, with respect to number of animals per design (n=1), dose levels, duration of dosing and sampling schedule, and therefore less information rich. This can give biased results.
The same total dose of NiAc was given in studies 2 and 4, but with different dosing regimens. Approximately the same reduction in plasma NEFA concentrations below baseline was seen in both studies (78 and 67 %, respectively) but the peak of the rebound was significantly lower in study 4 (71 % increase above baseline in study 2 compared to 28 % in study 4) where the infusion rate was increased and decreased in a stepwise manner. Due to the slow decrease in infusion rate, the concentration of NiAc declined gradually, with the result that rebound was less pronounced. It is possible, therefore, that by prolonging the gradual decline in plasma exposure to NiAc the rebound may be abolished. This will be evaluated in future studies. It is also possible that a compound with a longer terminal half-life might have the same inhibitory effect on the rebound, as does the more prolonged exposure to NiAc.
In the present series of experiments, there was little evidence of the development of tolerance apart from the slight increase in plasma NEFA concentrations during all but the last 30 min infusion period in study 1 (Fig. 6A). In our data, the rebound is considerably easier to detect than the tolerance during NiAc exposure. Since the rebound occurs as a result of a counteracting mechanism to the NEFA-lowering effect, it may therefore be a strong indicator of tolerance development. However, the time scale of developing tolerance might differ from (be slower than) that of the primary response (t1/2 kout ) (Gabrielsson and Peletier 2008). If so, extended drug exposure might be needed to capture the tolerance experimentally. As the t1/2 ktol parameter serves as an indicator of the tolerance time scale, it can be used for guidance in experimental design. The present analysis of NiAc-induced plasma NEFA responses predicts a t1/2 kout of 2 min (2 – 5 min) and a t1/2 ktol for tolerance development of 9 min (9 – 30 min). Although there is no generic schedule guiding the design of experiments aimed at capturing tolerance development, multiple provocations for at least 3–4 · t1/2 ktol , coupled to washout dynamics with sufficient baseline data, are commonly needed (Gabrielsson and Peletier 2008).
By modeling the complete NEFA response time-course, we obtained parameter estimates that characterized the concentration-response relationship at equilibrium. As shown in Fig. 7, this relationship was not particularly steep regardless of whether or not we included feedback in the model. This contrasts with the data analyzed from Carballo-Jane et al. (2007). Those authors did not utilize a quantitative model, and the resolution of their exposure-time and response-time data were slightly lower. For this reason we fitted our model to a digitized set of Carballo-Jane et al. (2007) data. The conclusions from this quantitative analysis are consistent with those from our multiple NiAc infusions, and most parameters were in the same range; the exceptions were the potency ID50 and the Hill factor n, which were significantly higher for the Carballo-Jane et al. (2007) data. These differences may be due to differences in the experimental set up, including the use of anesthesia, sampling route, vehicle, dose range, and in the kinetics. According to Kanaris et al. (1975), Renauld and Sverdlik (1975) and Reyes Toso et al. (1993) the metabolism of NEFA may be perturbed by barbiturate anesthesia, so it is noteworthy that Carballo-Jane et al. (2007) used conscious rats while our rats were anaesthetized with Nathiobutabarbital. Furthermore, venous blood samples were used by Carballo-Jane et al. (2007) whereas we collected arterial blood samples. In Carballo-Jane et al. (2007), the vehicle was 0.5 % methylcellulose and the NiAc dose range 3 to 300 mg·kg−1 (24–2440 μmol·kg−1), whereas in our experiments the vehicle was 0.9 % NaCl and the dose range 0.5 to 1 mg·kg−1 (4–8 μmol·kg−1). If the bioavailability is overrated, the amount of drug giving rise to the reduction in plasma NEFA concentrations would be smaller and the potency would increase. The higher value of n for the Carballo-Jane et al. (2007) data is indicative of a steeper dose-response relationship (Fig. 7) than in our study. Finally, in the analysis, the pharmacokinetics was assumed to be linear, although Iwaki et al. (1996) demonstrated capacity-limited disposition of NiAc in rats within the 2–45 mg·kg−1 (16.3–370 μmol·kg−1) NiAc dose range with Km ∼ 40 μM. The Carballo-Jane et al. (2007) doses fall beyond this dose interval (3–300 mg·kg−1). We assumed a first-order elimination term from the biophase compartment, which may confound the estimation of IC50 (ID50 ) and the n terms.
Our data did not support the presence of a physiological lower limit. However, the highest dose administered in Carballo-Jane et al. (2007) was approximately 300 times higher than our highest dose but revealed such a limit. To be able to fit the model to the Carballo-Jane et al. (2007) data the physiological limit had to be included.
This study is the first in a series examining the pharmacodynamics of plasma NEFA concentrations after multiple NiAc provocations, and it will be expanded by experiments designed to further explore NEFA turnover. These will include measurements of exposure to NiAc and its impact on plasma NEFA concentrations in the same animal under varying experimental conditions.
Footnotes
ACKNOWLEDGEMENTS
Therese Hagstedt, Pia Thalén and Nick Oakes are gratefully acknowledged for providing these data, Dr. Jenny Watson for excellent revision of this manuscript and Dr. Hugues Dolgos for financial support of the graduate program.