
Abstract
The recent Dose Response journal article “Protective Bystander Effects Simulated with the State-Vector Model” (Schollnberger and Eck1 2007) identified the suppressive (below natural occurring, zero primer dose, spontaneous level) dose response for HeLa x skin exposure to 137Cs gamma rays (Redpath et al 2001) as a protective Bystander Effect (BE) behavior. I had previously analyzed the Redpath et al (2001) data with a Microdose Model and conclusively showed that the suppressive response was from Adaptive Response (AR) radio-protection (Leonard 2005, 2007a). The significance of my microdose analysis has been that low LET radiation induced single (i.e. only one) charged particle traversals through a cell can initiate a Poisson distributed activation of AR radio-protection. The purpose of this correspondence is to clarify the distinctions relative to the BE and the AR behaviors for the Redpath groups 137Cs data, show conversely however that the Redpath group data for mammography (Ko et al 2004) and diagnostic (Redpath et al 2003) X-rays do conclusively reflect protective bystander behavior and also herein emphasize the need for radio-biologist to apply microdosimetry in planning and analyzing their experiments for BE and AR. Whether we are adamantly pro-LNT, adamantly anti-LNT or, like most of us, just simple scientists searching for the truth in radio-biology, it is important that we accurately identify our results, especially when related to the LNT hypothesis controversy.
DISTINCTION BETWEEN ADAPTIVE RESPONSE AND THE BYSTANDER EFFECT
Relative to the Bystander and Adaptive Response effects, distinction entails the examination of the basic definitions of the BE and AR. We all are cognizant of the Bystander Effect but we can acquiesce to others regarding definitions. Dr. Eric Hall, a very early contributor to Bystander Effects research with his group at Columbia University, recently defined (Hall 2003) the Bystander Effect as “the induction of biological effects in cells that are not directly traversed by a charged particle, but are in the close proximity to cells that are.” Dr. William Morgan, prominent in investigating and interpreting the bio-chemical aspects of low dose response behavior, in his discussion of BE and AR effects relative to the Linear No-Threshold issue (Morgan 2006), provided a similar conventional definition of the Bystander Effect behavior as “those effects occurring in cells that were not hit i.e., traversed by an ionizing particle, but were neighbors of cells that were irradiated”. Investigations have encompassed both deleterious and beneficial results in un-hit cells as Bystander Effects.
Adaptive Response, to many, has meant the reduction in the biological effects of large doses of ionizing radiation by the prior exposure to low doses of radiation. The prior low dose is usually called the “primer” dose and the subsequent large dose the “challenge” dose. However, recent work has shown the priming dose can also result in a reduction of endogenic spontaneous, naturally occurring, potentially carcinogenic cellular damage. Azzam et al (1996), Redpath et al (2001) and others have logically considered the spontaneous damage priming dose protection also as Adaptive Response. The AR protection seen in endogenic spontaneously occurring damage of course has far greater human radiation risks implications. In my microdosimetry work (Leonard 2005, 2007a, 2007b), I have now shown, in the Adaptive Response data of others for a number of cell species, that single (i.e. just one) charged particle traversals through the cell nucleus can activate AR protection. The Adaptive Response term currently only applies to the protective effects in cells directly hit by the priming radiations. Deleterious damage to cells has conventionally been called Direct Damage. To get more specific, the fundamental question then becomes, “When does beneficial charged particle traversals become classified as protective Bystander?” I would first say that any charged particle traversal to any part of a cell, including the cytoplasm and the nucleus, causing a beneficial effect on that specific cell would be considered Adaptive Response. Then what would we call a biological effect to a cell from a traversal through the adjacent intracellular medium? The medium transfer studies of Mothersill and Seymour (1997) are currently considered a Bystander Effect. The supernatant transfer experiment of Iyer and Lehnert (2002) for alpha particle exposure has been interpreted as a protective Bystander Effect although one can as easily interpret the results as Adaptive Response protection of alpha particle damage by priming doses to the supernatant medium. So things are not so clear for intracellular medium. But we can say that, for Adaptive Response, the affected cell must be traversed and for the Bystander Effect the affected cell is not traversed.
To this point I have left out the one behavior that both pro-LNT and anti-LNT constituents can agree on, this is that at high dose the deleterious damage begins to dominate and the response acquires a positive sloped quasi-linear or quasi-linear-quadratic behavior. This high dose response region we can call the Direct Damage Region. In Figure 1A then, I show the three regions of dose response that hopefully we can all accept as was done in Brenner et al (2001) Bystander “BaD” Model development. I show also the normalized data points of Redpath et al (2001) for the 137 Cs exposures at issue here showing the primer dose point (arrow) for a single charged particle traversal (Poisson mean one hit) representing the boundary between the Bystander Effect and the Adaptive Response Regions. It is still not clear about a possible threshold for the onset of the Direct Damage and this too remains a part of the LNT controversy. In most of my Microdose Model analysis, I have had to include a Direct Damage threshold into the Midrodose Model as a data best fit.
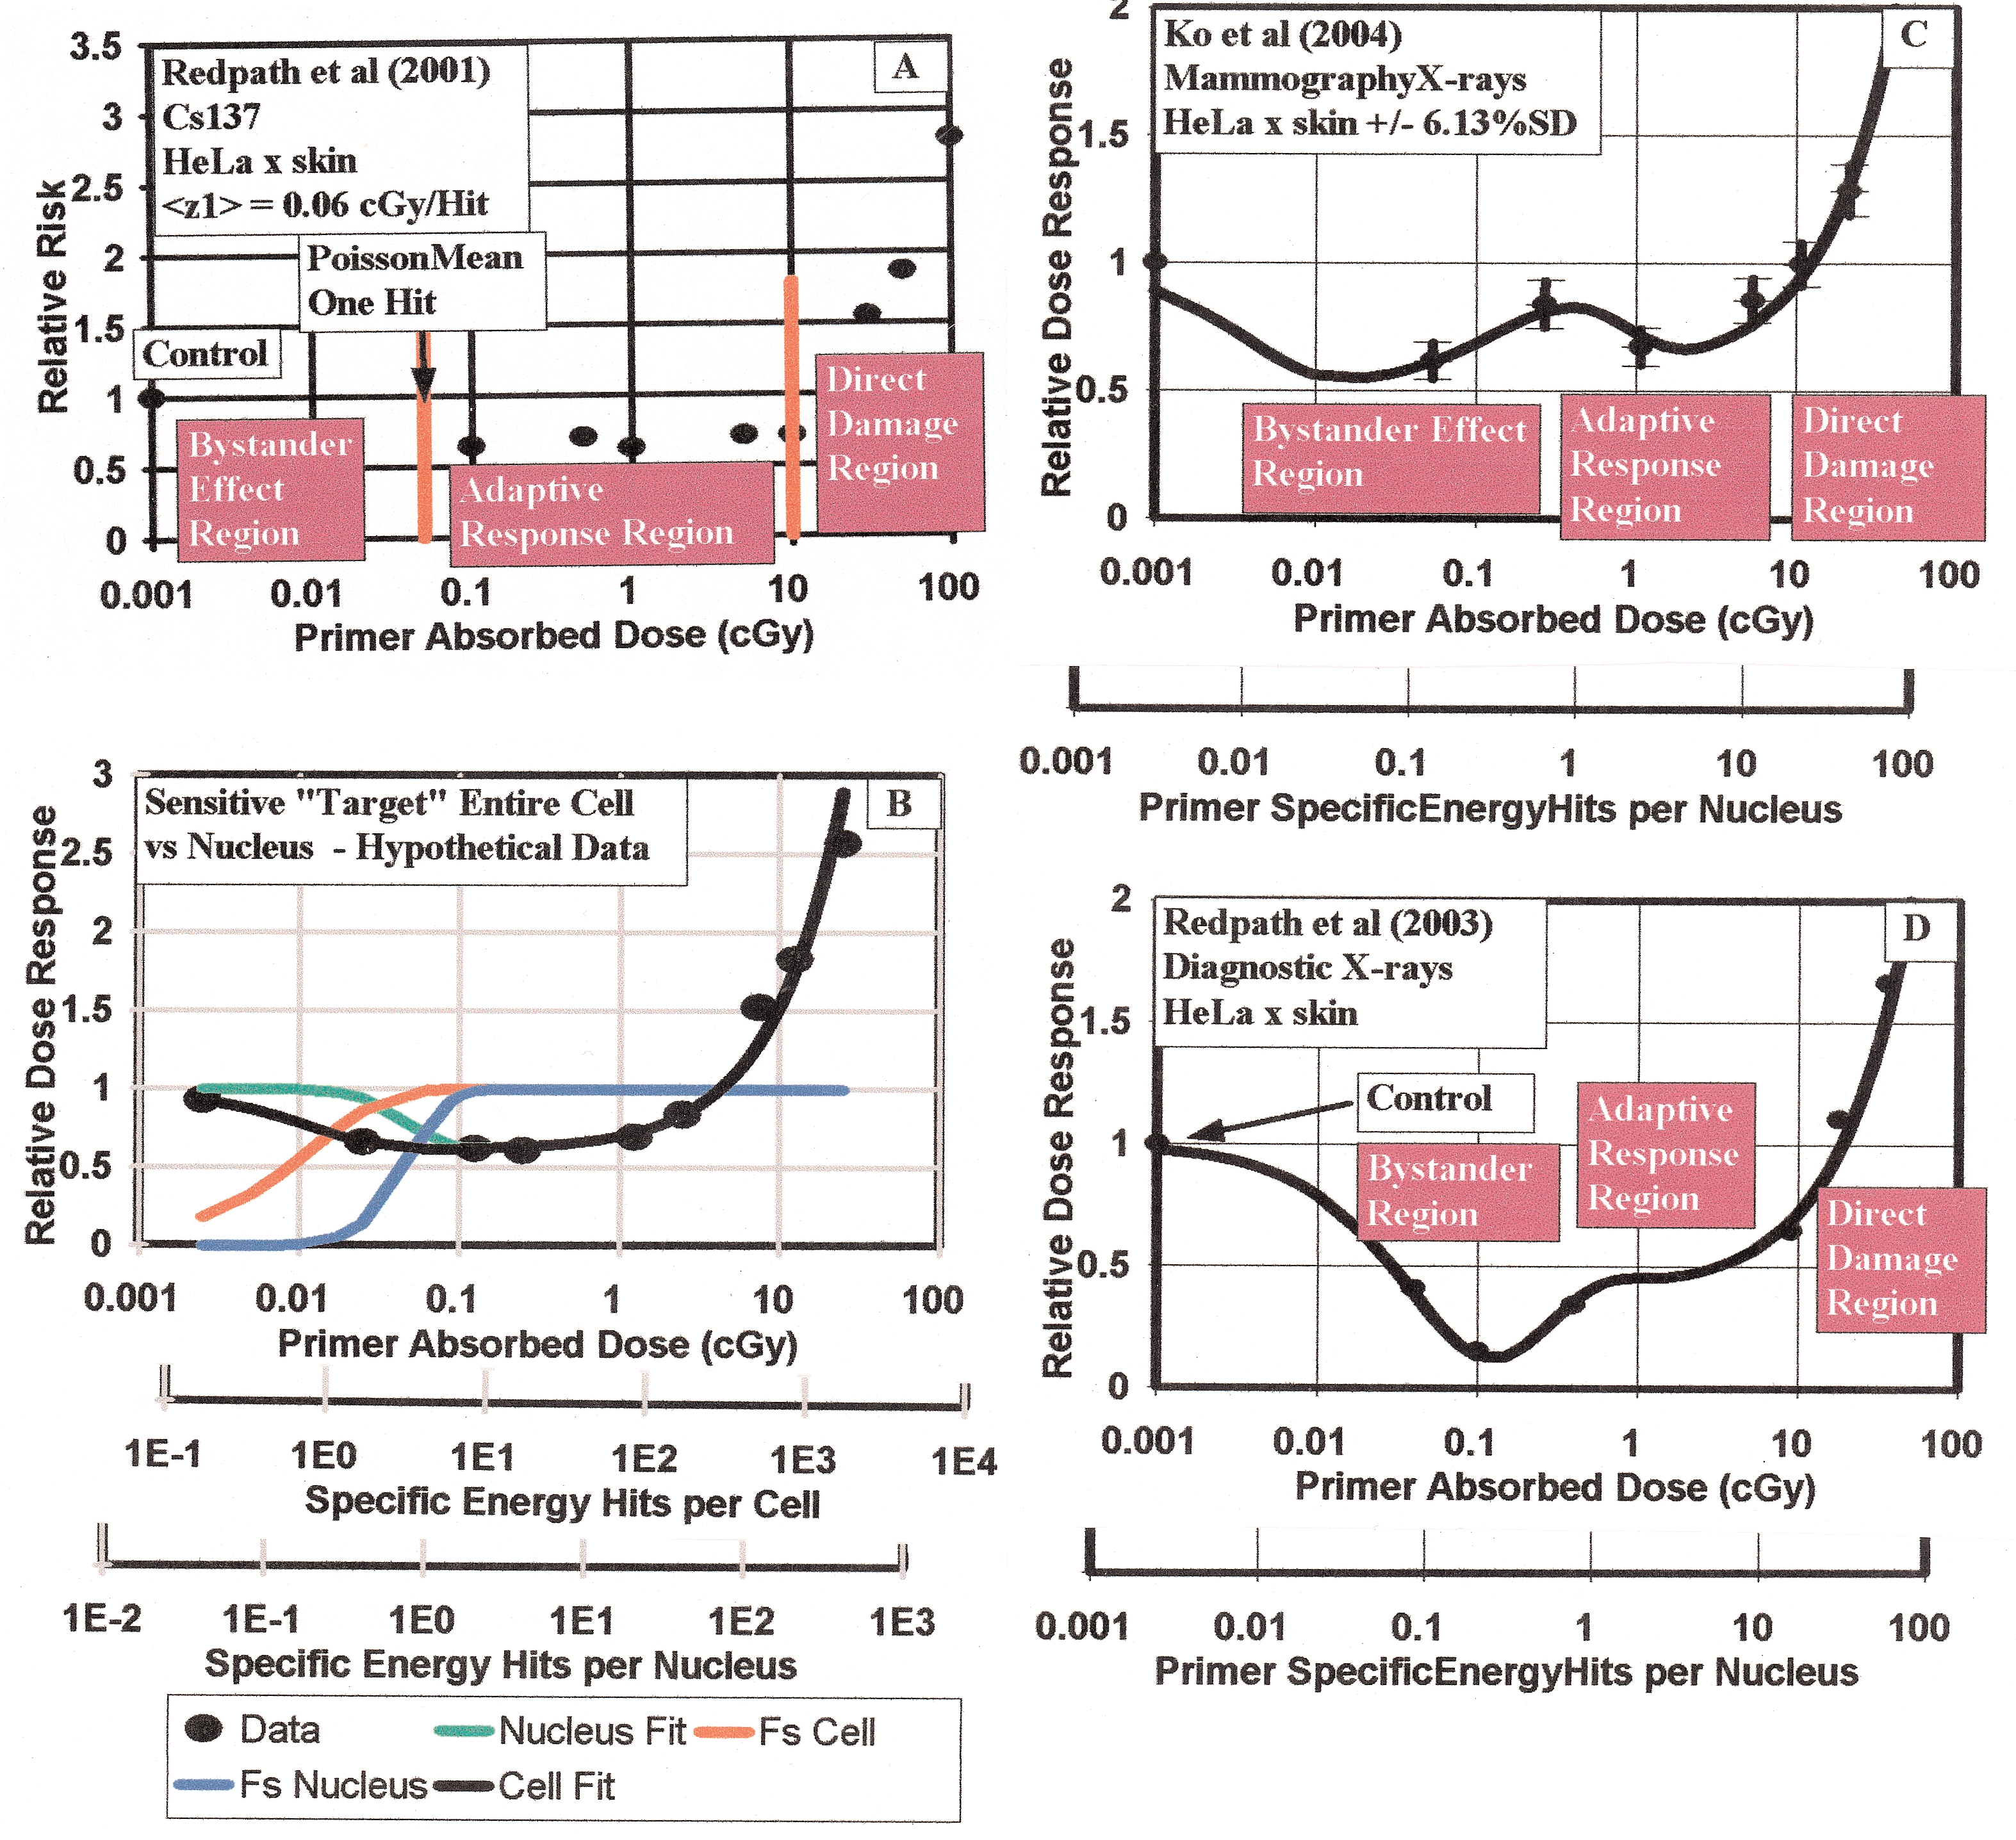
Panel a—Illustration of the three dose response regions encompassing the Bystander Effects Region below the single specific energy Hit per Nucleus value, the Adaptive Response Region beginning at one Specific Energy Hit per Nucleus and the Direct Damage Region where deleterious damage begins to dominate. The data shown is that of Redpath et al (2001) for HeLa x skin cells exposure to 137Cs. Panel B—Illustration of ability of Microdose Model to distinguish cell critical volume being entire cell as compared to just cell nucleus volume. Panel C—Fit of Microdose Model to mammography X-ray data (Ko et al 2004) showing double “U” shaped behavior from both protective Bystander Effect and Adaptive Response radio-protection. Panel D—Fit of Microdose Model to diagnostic X-ray data (Redpath et al 2003) showing also a double “U” shaped dose response from both Bystander and Adaptive Response behavior.
TRAVERSALS—MICRO-DOSE SPECIFIC ENERGY DEPOSITIONS PER CRITICAL VOLUME TRAVERSAL
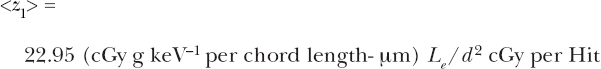
I hope from the above that it is clear to an experimental radio-biologist examining AR and/or BE that it is important in planning experiments or examining experimental results, to consider the microdose charged particle traversals at the cellular level. This is not as painful as it seems. In the Microdose Model development, which I offer an extensive review (Leonard 2008a) in a new Dose Response Journal paper, I have provided the model analytical relations with both tissue absorbed dose, D, and separately the Specific Energy Depositions (Traversals) per Critical Volume Traversed as the independent variables. The key microdose parameter is the radiation induced charged particle energy deposited in the critical volume per particle traversal, conventionally denoted by <z1> (ICRU 1983). For simplicity, in my work I have shortened “critical volume traversals” to “hits”. I have used “cGy per hit” as units for <z1>. In my graphics of Bystander and Adaptive Response data, I have provided the two independent variable scales for the abscissa i.e. the usual Tissue Absorbed Dose and the other, Specific Energy Hits per Nucleus (as I explain below, using the nucleus as the critical volume) given by D/<z1> with D in cGy units. In the next paragraph, I will show, for those not familiar with <z1>, how the parameter depends on the size of the critical volume i.e. whether it includes just the cell nucleus or the entire cell, cytoplasm and nucleus. I briefly describe the method for determination of <z1>.
The amount of radiation energy deposited, on a microdose level, into the cells sensitive volume by a charged particle traversal, is dependent on the linear energy transfer, L
e
(in units of keV/μm) and the mean chord length,  (in units of μm), traversed through the sensitive volume. Tissue absorbed dose is energy deposited per unit tissue mass. The way the charged particles cross the cell is random and is not linearly proportional to the cell volume. To obtain a value for <z1>, knowing the diameter of the sensitive volume, first the volume and the mass, m(g), of the sensitive volume may be obtained using a mean cell density of 1.04 g cm−3 (Attix 1986). This provides the energy deposited per unit mass, E (keV g−1) = L
e
(in units of μm), traversed through the sensitive volume. Tissue absorbed dose is energy deposited per unit tissue mass. The way the charged particles cross the cell is random and is not linearly proportional to the cell volume. To obtain a value for <z1>, knowing the diameter of the sensitive volume, first the volume and the mass, m(g), of the sensitive volume may be obtained using a mean cell density of 1.04 g cm−3 (Attix 1986). This provides the energy deposited per unit mass, E (keV g−1) = L
e
 /m for a single charged particle track across the sensitive volume. With the energy to absorbed dose conversion factor (1.6022 × 10⁻¹¹ cGy g keV−1), we have <z1> = D (cGy) per hit = 1.6022 × 10⁻¹¹ (cGy g keV−1) x E (keV g−1 per hit). Thus,

Several investigators have examined the chord length problem (Kellerer 1984, Ellett and Braby 1972, Enns and Ehler 1983). By considering the mean chord length per cell cross-section area, an analytical approximation for <z1> was offered by Kellerer and Rossi (1972) as a function of spherical cell critical volume diameter, d, and the linear energy transfer, L e , of the radiation, i.e.
Booz (1978) has provided values for L e ; Co-60 0.28 keV/μm, Cs-137 0.37 keV/μm, 250 kVp X-rays (1.77mmCu) 1.22 keV/μm, 250 kVp X-rays (0.44mmCu) 1.85 keV/μm, 200 kVp X-rays (5mmAl + 1mm Cu) 1.52 keV/μm, 65 kVp X-rays (1.9mmAl) 2.19 keV/μm as well as charged particles and neutrons . Attix (1986) provides values of L e for mono-energetic electrons and other charged particles. Ellett and Braby (1972) have computed the mean specific energies per hit, <z1>, (see their Table II) for 60Co gamma rays, 250 kVp (HVL 1.8 mmCu), 250 kVp (HVL 0.44 mmAl), 65 kVp (HVL 1.9mmCu) X-rays and Tritium beta rays. Values of <z1> have been measured for various radiations using tissue equivalent proportional counters (ICRU 1983).
In the use of the Microdose Model, choice of the representative sensitive volume directly influences the value of <z1> and the results in the use of the model. In other works (Leonard 2005, 2007a, 2007b, 2008a) the sensitive volume is chosen to be the cell nucleus. This is primarily because the nucleus has been used by many others as the sensitive region in cellular dose response analysis (Brenner et al 2001, Brenner and Elliston 2001, Brenner and Sachs 2002, Little 2004, Little and Wakeford 2001) when cell hit rates are involved. Also, the microbeam research has primarily focused on alpha particle injection in the cell nucleus even though Wu et al (1999) showed that the alpha particle injection into AL human-hamster hybrid cells cytoplasm produced mutations inside the cell nucleus. Shao et al (2004) also shows Bystander Effects from cytoplasm irradiation. Feinendegen et al (2007) uses, as an estimate, the entire cell volume and a qualitative mass of 1 ng for the microdose target in his qualitative discussions about microdosimetry. Even though there are premises that there are protective Bystander Effects and Apoptosis occurs on a linear fashion beginning at zero dose [see Figure 5, Feinendegen et al (2007)], as well as the high LET deleterious Bystander Effect from microbeam studies, that suggests a larger target; the choice of the nucleus provides a basic “bench-mark” reference target. As discussed above, the larger the critical volume target then the smaller the value of <z1> and the larger the shift to the right for the Specific Energy Hits per Critical Volume scale using the entire cell in D/<z1>. For example, suppose there is a protective Adaptive Response behavior that is reflected in the dose response data from traversals through the entire cell volume including the cytoplasm. The corresponding <z1> value providing the model best fit using the nucleus as the target volume will erroneously result in a fractional number of “Hits” to activate the non-linear AR dose response hence activation below a single nucleus traversal. By using the nucleus as the sensitive volume, in this supposition if there is a larger target the data evaluation with the Microdose Model will reveal this in the use of the Specific Energy Hits per Nucleus, D/<z1>, scale for the abscissa in the data analysis. We show this in Figure 1B, where we reflect the entire cell as being the critical volume for the Poisson distributed hits initiation of AR. We show the Dose scale, the Specific Energy Hits per Nucleus scale and, in this hypothetical case, the correct Specific Energy Hits per Cell scale. Using the nucleus scale, we see a fractional (less than one) number of hits to activate the AR. In this Figure 1B illustration, we have reasonably assumed that the mean chord length and thus the effective diameter, d, in Equations (1) and (2), for the entire cell is twice the nucleus diameter. This means a factor of four larger <z1> and a factor of four inconsistency in using the Specific Energy Hits per Nucleus scale if the critical sensitive volume is the entire cell. In Figure 1B, this inconsistency is clearly discernable and reflects the AR protection being activated below a single charged particle traversal—incorrectly implying perhaps a small protective Bystander Effect and hence signifying to an analyzing investigator that the entire cell is indeed the critical volume. For the many cell species that I have examined with the Microdose Model, in using the cell nucleus as the sensitive volume for AR, no data has shown any evidence of a larger critical volume or that a deleterious or protective Bystander Effects is operative, similar to illustrated in Figure 1B. We will show below however that the failure to perceive any protective or deleterious Bystander Effect has been primarily due to the investigators failure to obtain low enough dose data points, which we will also show is fortunately not the case for the mammography (Ko et al 2004) and diagnostic (Redpath et al 2003) X-ray data.
In studying how investigators have determined cell sizes with primarily microscope images, it must be realized that there is considerable variation in visibly obtaining representative average cell diameters. We would estimate an uncertainty on the order of ± 20% based on our own attempts at performing visual estimates. Due to also some uncertainty in the value of the Linear Energy Transfer constant, L e , for the radiation, this will result in the mean specific energy deposition per nucleus traversal constant, <z1>, being uncertain by about 25%. However, as we have noted, the uncertainty in the use of the Poisson accumulation functions is ± one Specific Energy Hit but, as we have seen, for small numbers of hits for AR activation this is sufficiently accurate, especially if the data is resolved to a single nucleus “Hit”. To show this, in Figure 2A of Leonard (2007a), for the Redpath et al (2001) 137Cs data, we provided the Poisson accumulation functions and the resulting model fit curves for one, two and three specific energy hits, illustrating a significant distinction in the quality of the fits from a difference of one hit. In the Table II therein we provided the trial fits %SDs showing the resolution ability to ± one specific energy hit.
MICRODOSE EVALUATION OF THREE REDPATH GROUP ADAPTIVE RESPONSE HELA X SKIN DATA SETS—137CS, MAMMOGRAPHY AND DIAGNOSTIC X-RAY SOURCES
In Figure 2A of Leonard (2007a) and Figure 1A herein it is clear that the lowest data point for the 137Cs dose response data is above the dose for single charged particle traversals induced by the low LET gamma rays shown by the arrow. In analyzing the three dose response data sets together in more detail, we will use <z1> values based on the nucleus being the critical sensitive volume of the cell for any Adaptive Response or Bystander behavior. The size of the HeLa x skin nucleus was estimated by Miller et al (1999) to be 11.9 μm. Using a Linear Energy Transfer (LET) value of 0.37 keV per μm from Booz (1978) for the 137Cs 0.662 Mev gamma ray source used by Redpath et al (2001), we obtained from Equation (2) a <z1> value of 0.060 cGy per nucleus hit in the analysis of their work. Here for the significant Ko et al (2004) mammography data, the target cells are the same but the LET is very different for the very low energy photons from the mammography X-rays. Attix (1986) and other text provide values of the mass energy transfer coefficients and stopping powers for photon energies from 0.010 to 10 Mev based on the Klien-Nishina formulation, however recent LET measurements by Kellerer (2002) for these very low energy mammography X-rays provides the best, most direct, relative data. He determined the Frequency Mean Photon Energies from the X-rays to be about 20 keV and the LET of these electrons to be 4.34 keV per μm. If we use this LET value for the 30 kVp X-rays reported to be used by Ko et al (2004), the <z1> would be the LET ratio relative to the 137Cs value i.e. <z1> = 0.06 cGy hit−1 x (4.34 keV μm−1)/(0.37 keV μm−1) = 0.703 cGy hit−1. In using this value here, we will place an uncertainty of about ± 25% such that we let <z1> = 0.703 ± 0.176 cGy hit−1 for our analysis.
With the Microdose Model, it is important to compare the results for the other different sources used by the Redpath group to study AR. The value of 0.703 cGy per hit for the mammography X-rays for <z1>, the mean Specific Energy Deposition per radiation induced charged particle traversal through the HeLa x skin cells, is very large as compared to the <z1> values for the low LET 137Cs (Redpath et al 2001), 125I brachytherapy photons (Elmore et al 2006) and 235 MeV protons (Elmore et al 2005) but comparable for the 60 kVp diagnostic X-rays (Redpath et al 2003). We could perhaps classify the LET of 4.34 keV per μm for the mammography X-rays as an intermediate LET value and the <z1> value of 0.703 cGy per Hit as an intermediate <z1> value between large values for high LET radiation (i.e alpha particles—10 to 20 cGy per hit) and the smaller values for low LET radiations (from 0.02 to 0.20 cGy per hit). This means that the very first single charged particle traversal occurs at a much higher Primer Absorbed Dose. The chosen lowest exposure dose then has a very large influence in what can be observed from the laboratory in vitro measurements. For the Ko et al (2004) mammography measurements the lowest dose was fortunately 0.054 cGy. Comparing this to the <z1> value of 0.703, the Ko et al (2004) lowest data point was over a factor of 10 lower [we show this as Figure 1C here—a reproduction of Figure 2B of the review paper (Leonard 2008a)] and well within the Bystander Effect Region on the graph, hence a protective Bystander Effect could be and indeed was observed. The simplest way to show this is with the ratio of the lowest dose data point divided by the <z1> value yielding the Poisson distributed minimum observable Specific Energy Hits. This means an average of only 0.054 cGy/0.703 cGy Hit−1 = 0.0768 Hits per cell have occurred for the mammography data. This means that the lowest data point is well within the Bystander Effects Region as shown in Figure 1C. The Redpath et al (2001) 137Cs with the lowest data point at 0.1 cGy (<z1> = 0.06 cGy per Hit −0.1 cGy/0.06 cGy Hit−1 = 1.67 Hits per cell), the Elmore et al (2005) 232 proton with the lowest data point at 0.5 cGy (<z1> = 0.06 cGy Hit−1 −0.5 cGy/0.06 cGy Hit−1 = 8.33 Hits per cell), the Elmore et al (2006) 125I lowest dose data points were at 1.0 cGy (<z1> = 0.60 cGy Hit−1 −1.0 cGy/0.60 cGy Hit−1 = 1.67 Hits per cell) and the Redpath et al (2003) 60 kVp X-rays with the lowest data point at 0.04 cGy (<z1> = 0.40 cGy Hit−1 −0.04 cGy/0.40 cGy Hit−1 = 0.1 Hits per cell) well within the Bystander Effects Region. Thus, except for the Redpath et al (2003) 60 kVp diagnostic X-ray data, the lowest data points were above single hit doses and hence above the Bystander Effect Region and no Bystander Effects could be observed. This also applies to the 10T1/2 cells (spontaneous data) exposures to 60Co gammas of Azzam et al (1996), with his lowest data point of 0.10 cGy (z1> = 0.04 cGy Hit−1 −0.10 cGy/0.04 cGy Hit−1 = 2.5 Hits per cell). We show as Figure 1D the dose response data and fit of the Microdose Model to the diagnostic X-ray data clearly showing both a protective Bystander Effect and the Adaptive Response radio-protection. It is most likely for the 125I low energy photons, that if the Elmore et al (2006) lowest dose was administered at a lower dose such as 0.054 cGy, a Bystander Effect would have been seen due to the high <z1> value close to that of the mammography X-rays. If the lowest dose data point for the 137Cs exposures were at 0.01 cGy, with the <z1> value for the 137Cs gamma rays is about 0.06 cGy per Hit, then most likely a protective Bystander Effect would have been observed. We must qualify our synopsis, however. It is not certain, that even if the lowest 137Cs exposure had been chosen well below the <z1> value of 0.06 cGy per Hit, whether a Bystander behavior would have occurred. Bystander Effects have only consistently been observed for high LET alpha particles and the observed protective Bystander Effect for the mammography and diagnostic X-ray data may be because the LET is what we have called “intermediate”. The reason then that the Ko et al (2004) and Redpath et al (2003) data observed protective Bystander Effects could be that the amount of energy delivered to each cell was large enough to exceed a BE threshold (if there is such a thing) that the alphas also greatly exceed with their <z1> values between 10 and 20 cGy per Hit. So, at this juncture, we do not know if, say an exposure of 0.01 cGy of 137Cs, will induce a Bystander Effect in the HeLa x skin cells. It would be interesting to test this scenario. The same considerations apply for the 232 MeV proton data where the lowest dose point was 0.5 cGy and our estimate of <z1> = 0.06 cGy per Hit—no chance of observing any BE behavior. The same is also true of the many other Adaptive Response effect data sets that we have studied (Leonard 2005, 2007a, 2007b, 2008a, 2008b).
As we noted above, others have mistakenly claimed a protective Bystander Effect in the Redpath et al 137Cs data (Schollnberger and Eckl 2007, Schollnberger et al 2007) but our Microdose Model clearly shows (Leonard 2005, 2007a, 2008c) that the sub-spontaneous response is simply Adaptive Response radio-protection. Our further analysis here confirms this.
In summary, with the risk of overusing the word “conclusive”; in the context of the conventional definitions of Bystander Effect, I show conclusive evidence that 1.) the dose response data of Redpath et al (2001) for HeLa x skin cell exposure to 137Cs gamma rays conclusively does not exhibit either a protective or deleterious Bystander Effect 2.) the dose response data of the Ko et al (2004) for HeLa x skin cell exposure to low energy mammography X-rays and the Redpath et al (2003) low energy diagnostic X-rays, due to their very low dose data points and high degree of accuracy of the data, conclusively exhibit significant protective Bystander Effect as well as Adaptive Response radio-protection. This is shown in Figures 1C and 1D. The SVM model (Schollnberger and Eckl 2007, Schollnberger et al 2007) should reveal this for the mammography and diagnostic X-ray data. The SVM has potential for bio-chemically explaining dose response data and could, for example, perhaps help understand the dose and dose rate coupling recently shown between HRS/IRR and the low LET “inverse” dose rate effect (Leonard 2007c) and a similar dose and dose rate coupling (but apparently from different mechanisms) for the Adaptive Response radio-protection (Leonard 2007b, 2008a, Shadley and Wiencke 1989, Ko et al 2004). In both, the effects occur at lower doses for higher dose rates and at lower dose rates for higher doses.
The protective results for the mammography and diagnostic X-rays are very significant due to the millions of humans exposed each year to these radiations. It is important, due to the LNT issue, to properly identify the many observations of non-linear behavior at low doses and dose rates. There are instances where speculation, especially by correlation for low doses with the high dose Japanese A-bomb studies, has resulted in undue concern about the human cancer risks i.e. from mammogram radiation (Heyes et al 2004, 2006, Brenner et al 2002), as noted by Redpath and Mitchel (2006) and Redpath (2007) and possibly the recent warnings about the 120 to 150 kVp X-ray Computed Tomography (CT) scans (Brenner and Hall 2007), since 60 kVp diagnostic X-rays have been shown to exhibit both Adaptive Response protection and protective Bystander behavior [Figure 1D herein].