
Abstract
Prior work has provided incremental phases to a microdosimetry modeling program to describe the dose response behavior of the radio-protective adaptive response effect. We have here consolidated these prior works (Leonard 2000, 2005, 2007a, 2007b, 2007c) to provide a composite, comprehensive Microdose Model that is also herein modified to include the bystander effect. The nomenclature for the model is also standardized for the benefit of the experimental cellular radio-biologist. It extends the prior work to explicitly encompass separately the analysis of experimental data that is 1.) only dose dependent and reflecting only adaptive response radio-protection, 2.) both dose and dose-rate dependent data and reflecting only adaptive response radio-protection for spontaneous and challenge dose damage, 3.) only dose dependent data and reflecting both bystander deleterious damage and adaptive response radio-protection (AR-BE model). The Appendix cites the various applications of the model. Here we have used the Microdose Model to analyze the, much more human risk significant, Elmore et al (2006) data for the dose and dose rate influence on the adaptive response radio-protective behavior of HeLa x Skin cells for naturally occurring, spontaneous chromosome damage from a Brachytherapy type 125I photon radiation source. We have also applied the AR-BE Microdose Model to the Chromosome inversion data of Hooker et al (2004) reflecting both low LET bystander and adaptive response effects. The micro-beam facility data of Miller et al (1999), Nagasawa and Little (1999) and Zhou et al (2003) is also examined. For the Zhou et al (2003) data, we use the AR-BE model to estimate the threshold for adaptive response reduction of the bystander effect. The mammogram and diagnostic X-ray induction of AR and protective BE are observed. We show that bystander damage is reduced in the similar manner as spontaneous and challenge dose damage as shown by the Azzam et al (1996) data. We cite primary unresolved questions regarding adaptive response behavior and bystander behavior. The five features of major significance provided by the Microdose Model so far are 1.) Single Specific Energy Hits initiate Adaptive Response, 2.) Mammogram and diagnostic X-rays induce a protective Bystander Effect as well as Adaptive Response radio-protection. 3.) For mammogram X-rays the Adaptive Response protection is retained at high primer dose levels. 4.) The dose range of the AR protection depends on the value of the Specific Energy per Hit, <z1>. 5.) Alpha particle induced deleterious Bystander damage is modulated by low LET radiation.
1. INTRODUCTION
Radio-protective mechanisms from ionizing radiation have been extensively observed and studied. The major mechanisms, where a large amount of experimental data are available, are adapative response (AR), dose induced radio-resistance (IRR) from hyper-radiosensitive (HRS) cells i.e. HRS/IRR and the low linear energy transfer (LET) inverse dose-rate effect (IDRE). Apoptosis is further suspected to be a radio-protective cellular action. There is conclusive evidence for some cells that radio-protection induction from adaptive response may be activated by a few or single charged particle track traversals (Leonard 2005, 2007a, 2007b) through the sensitive region of individual cells, which in the prior work has been assumed to be the cell nucleus. Adaptive response (AR) occurs when with an initial priming dose, after a delay period on the order of 4–6 hours, a second higher challenge dose exhibits a reduced dose response as compared to the dose response without the initial priming dose, thus a delayed reduced dose response. Recently a “reverse” adaptive response has been observed where the challenge dose is administered first, still showing an AR reduction after a later priming dose (Day et al 2007). Very low priming doses of radiation have also been shown to reduce natural, spontaneous occurring carcinogenic causing chromosome mutations in vitro (see Figures 2A–2C, Leonard 2007a) and in vivo (see Figure 3, Leonard 2007a). Thus, the potential benefit of adaptive response to human health risks is significant in the possible reduction in naturally occurring carcinogenic diseases. Benefits from adaptive response would apply to
Nuclear workers receiving routine low level exposures
Patients receiving diagnostic x-ray, mammography, Computerized Axial Tomography (CAT) scans, and Positron Emission Tomography (PET) scans
General Public—Alleviate public fear from environmental levels
Nuclear Technology—Facilitate more use of nuclear technology such as nuclear power
Nuclear Cleanup—Reduce costs of nuclear cleanups
Important questions regarding the characteristics of adaptive response protection are
Threshold—What is the minimum threshold dose and dose rate at which the human risk protection is activated?
Magnitude—What is the magnitude of the radio-protection when it is fully operative?
Fading time—How long do the individual cells retain the radio-protective capability?
Retention—Is the human risk protection cumulative, being sustained with successive exposures?
Radiation damage—At what level will the deleterious effects at higher dose and dose rates of the priming radiation dominate the AR benefit?
Radiation quality—What influence does radiation quality have on the protective and damaging mechanisms? We humans experience a very broad spectrum of radiations from background radiation, very low energy mammography X-rays (∼30 keV), brachytherapy and external source cancer treatment radiations, normal diagnostic X-rays, CAT and PET scans, internal radio-isotope injections and solar and galactic radiations.
Bystander effect—How does adaptive response and the bystander effect interplay? If there is adaptive response radio-protection in the region above the threshold, can there still be deleterious human risk from the bystander effect at lower doses? If there is a bystander effect, is a little radiation above background safer than just background?
Adaptive response inducing drug—Could a mildly toxic drug, taken internally provide endogenic activated protection seen to be afforded by the exogenic priming radiation?
Probably most crucial of these are item “6. Bystander effects” because if deleterious bystander damage occurs at even lower doses any benefit would be questionable and also item “1.) Threshold,” because the threshold dose and dose rates may be above the harmless, regulated levels permitted to be received routinely and thus potential human benefits from AR would be a moot issue. This would be if this threshold was 1.) above about 10 mRem (0.01 cSv) per weekday for nuclear workers, i.e., nuclear electric generator plants, hospital and therapeutic lab radiation centers, nuclear research facilities (the U.S. Nuclear Regulatory Commission limits radiation workers to exposures to 1.25 Rem (cSv) per calendar quarter), 2.) above about 40 mRem (0.04 cSv) per treatment nominally received by diagnostic x-ray, mammography, CAT and PET scan patients (Hall 2000). The recent works (Leonard 2005, 2007a, 2007b) provide the only biophysical and/or a biochemical model presently available for application to AR experimental data to evaluate the above uncertainties.
We have developed and applied this biophysical model that facilitates quantitative examination of the above cited properties of cellular adaptive response, for carcinogenic causing damage, using the basic cell microdosimetric concepts proposed by the International Commission on Radiation Units and Measurements (ICRU 1983) and formulated by Dr. Ludwig Feinendegen and his group. As noted by Feinendegen (2003) and Feinendegen et al (2000, 2007), to determine the minimum radiation necessary to activate and sustain the adaptive response protection and then be able to compare the results with other radiations and cell species at the cellular level, microdosimetry methods are required. Our model presented in the prior works does not as yet encompass bystander effects or spontaneous, potentially carcinogenic damage, which we shall address herein.
As we note, priming dose adaptive response radio-protection (AR) has been observed both for naturally occurring, potentially carcinogenic, spontaneous chromosome aberrations from just the small priming doses and also for potentially carcinogenic radiation induced chromosome aberrations—in this later case from relatively large challenge doses several hours subsequent to small priming doses. AR protection from the spontaneous neoplastic transformation chromosome damage offers the most promise for human health benefit because it may be activated at priming dose levels received at human domestic and workplace environs. The benefit from the challenge dose effect would only be for the relatively rare incidence of accidental, large radiation dose exposures for individuals that happened to previously received a sufficient priming dose. Many investigators have preferred to study in vitro AR effects from the large challenge doses since chromosome aberration levels produced for scoring purposes are much larger, and better accuracy can be achieved, than that obtained solely from the low spontaneous cell damage (Wiencke et al 1986, Wolff et al 1989, Shadley and Wolff 1987, Shadley et al 1987, Shadley and Wiencke 1989, Broome et al 2002, Wang et al 2003, Iyer and Lehnert 2002, Day et al 2006). However, some investigators have measured the ability of cells to undergo AR protection (from only low-LET priming dose radiation) of only the natural spontaneous aberrations continually occurring in cells from endogenic toxic damage to chromosomes (Pohl-Ruling et al 1983, Azzam et al 1996, Redpath and Antoniono 1998, Redpath et al 2001, 2003, Ko et al 2004, Hooker et al 2004, Elmore et al 2006, Koana et al 2007).
Using this recently developed dose dependent microdosimetry model for adaptive response behavior (Leonard 2005, 2007a), we have analyzed the effect of AR on several of these dose dependent works i.e. Pohl-Ruling et al (1983), Wiencke et al (1986), Azzam et al (1996) and Redpath et al (2001, 2003). It was found that the AR protection was activated by at most one or two radiation induced charged particle traversals (specific energy hits) to the cell nucleus (see Figure 5, Leonard 2007a). Dose rate, as well as dose, is relevant to potential human benefit from AR protection. Until recently only the works of Shadley and Wiencke (1989), cited above for human lymphocytes, had provided dose rate dependent AR response data, in their case involving challenge doses (1.5 Gy). We subsequently modified the microdosimetry model (Leonard 2007b) to encompass both dose and dose rate dependent activation of AR with priming doses and analyzed this challenge dose data of Shadley and Wiencke (Leonard 2005, 2007b) again showing that a minimum of at most two specific energy hits to the nucleus is sufficient to active AR but conclusively showing also the additional requirement that they occur within an interval of 9 seconds or rate of 6.7 hits per minute (see Figure 2, Leonard 2007b).
Recently, significant data has now been provided on dose rate effects for the activation of AR protection from low energy brachytherapy 125I photons effect on the production of spontaneous chromosome aberrations—provided by Koana et al (2007) and Elmore et al (2006), the later which we shall analyze here. Perhaps even more significant are the AR radio-protection from the low energy mammogram (Ko et al 2004) and diagnostic (Redpath et al 2003) X-rays that has led to conclusions that the low energy mammography X-rays do not result in excessive cancer risk as premised by others (Heyes et al 2004, 2006, Brenner et al 2002) but conversely provides potential protection from breast cancer (Redpath and Mitchel 2006, Redpath 2007). For analysis purposes, the Koana et al (2004) provides only several data points of chromosome mutation frequencies and not sufficient for detailed microdosimetry model analysis. The work of Elmore et al (2006) provides 20 dose and dose rate dependent data for the spontaneous chromosome neoplastic transformation adaptive response behavior from priming dose only exposures of HeLa x skin. The AR microdosimetry model requires resolution of at most ten parameters (but we will show that applying to experimental conditions, four to six parameters may be sufficient) and thus model analysis herein provides 10 degrees of freedom. Further, the dose dependent data of their investigative groups prior works (Redpath and Antoniono 1998, Redpath et al 2001) for HeLa x skin cells exposure to 137Cs was analyzed earlier with our model and provides additional dose dependent data for comparison.
The prior works have, through an evolutionary process in a piece-meal fashion, offered a Microdose Model, first for dose dependence only (Leonard 2007a), to analytically describe the adaptive response radio-protective behavior for cells exposed to low levels of ionizing radiations. In further work, the model was extended to dose-rate dependence for challenge dose adaptive response and for time dependent effects (Leonard 2007b). We have now, herein, extended the model to encompass dose and dose-rate dependence for adaptive response radio-protection for both the challenge dose chromosome damage and the more human risk significant naturally occurring and potentially carcinogenic, spontaneous chromosome damage. With this model extension, we have examined the spontaneous neoplastic transformation chromosome damage data of Elmore et al (2006) with respect to priming dose only AR radio-protection. This included determination of threshold specific energy hits (and minimum dose) and hit rate (and minimum dose rates), the magnitude and duration of the protection and the possible deleterious influence of the increasing priming dose and dose rates. We have also extended the model to encompass cellular behavior from both deleterious and protective bystander effects (BE) as well as AR. We have then applied this composite AR and BE model to the examination of the recent low LET chromosome inversion dose response data of Hooker et al (2004) that, in this rare case for low LET radiation, exhibits both protective adaptive response and deleterious bystander effects at very low doses. The very important low photon energy mammogram (Ko et al 2004) and diagnostic (Redpath et al 2003) X-rays are also examined revealing in these cases a protective bystander effect. The composite Microdose Model is also used to examine high LET (alpha) dose response data also showing BE and potential AR behaviors. The objective of the work reported here is to present a review of the prior modeling and provide, in a comprehensive manner, the full development of this composite AR and BE Microdose Model, identify this comprehensive models' properties and limitations and illustrate its' use by applying it to these important dose response cases cited above. An important part of this is to standardize the nomenclature for the comprehensive model.
2. METHODS AND MATERIALS
2.1 Development of the Adaptive Respose Microdosimetry Model
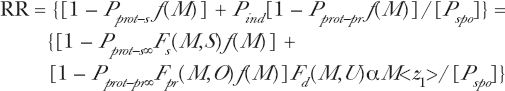
The microdosimetry model is developed in accordance with basic microdosimetry principals provided by the International Commission on Radiation Units and Measurements (ICRU 1983) and the works of Feinendegen, Bond, Sondhaus, Kellerer, Rossi, Booz, Zaider and others (see ICRU 1983). We have endeavoured to explicitly identify our formulation with the notations of Feinendegen and his cohorts. We particularly refer to the microdose notations of Feinendegen et al (2000), Feinendegen et al (2002, see their Figure 4 insert formulation) and the un-numbered equation on page 43 of Feinendegen et al (2007). We thus provide a basic microdose equation for cancer risk, R,

where P spo = the naturally occurring spontaneous damage at zero radiation exposure per cell, P ind = the radiation induced damage from microdose hits (and radiation dose) caused by the priming dose, P enh = an enhancement factor for the P ind damage, P prot = cumulative fractional magnitude of the activated radio-protection that operates against, and would reduce radiation produced DNA damage causing chromosome aberrations for both the exogenic radiation induced and endogenic spontaneous damage. The f(D, tp) is a protection activation, fading and dissipation function for adaptive response protection as a function of dose, D, and duration time of protective effectiveness, t p . If we are modeling for data that does not reflect significant damage enhancement behavior such as bystander effects, apoptosis or genomic instability, we have

To apply the Feinendegen et al (2007) formulation to experimental data, we have found that it is necessary to more specifically define these quantities and functions contained in Equations (1) and (1a).
2.1.a The f(D, tp) Protection Activation, Fading and Dose Dissipation Function
An AR activation and fading function, RP(t, t0), has been developed in prior work and is given by Equation (5) of Leonard (2007b), illustrated in Figure 1C therein for the Shadley et al (1987) data and repeated here as Equation (2).

The f(D, tp) function proposed by Feinendegen et al (2007), and included in Equations (1) and (1a) above, provides for this observed activation and fading of AR with time, as we have modeled for the Shadley et al (1987) data and also, with increasing dose, provides for the possible dissipation of the AR protection as the deleterious radiation induced damage begins to dominate. The Equation (2) does not accommodate this high dose dissipation effect which has not yet experimentally been verified nor hence clearly understood. The Equation (2) does provide for the fully developed AR protection with the constant RP o , which provides that at time, t = 0, before the priming dose the protection RP(t, t0) = 0 and at time t > 1/p but t < t0, RP(t, t0) = RP o i.e. fully developed AR protection. As time further increases RP(t, t0) → 0 again from the fading effect that was observed by Shadley et al (1987). Here RP o in Equation (2), we shall denote as maximum protection factor, Pprot–∞, in our modeling equations beginning in Section 2.1.b. So we reformulate Equation (2) for our model in Equation (3) by letting

such that Equation (3) for RP(t, t0) provides the fraction of the protection offered as a function of time after the priming dose exposure is administered. The maximum magnitude of the protection, Pprot–∞, will be included in the model equations beginning in Section 2.1.b for P prot from Equations (1) and (1a). In our modeling here, we shall accommodate both the time based activation and fading and also the possible dose imposed dissipation then by a composite relation for f(D, tp) → RP(t, t0) f(D) where f(D) is the undefined dose dissipation function developed further in Section 2.9, applied to the Ko et al (2004) data in Section 3.4.c and discussed in Section 4.1.d. What we had found, for the time activation and fading, is that the Shadley et al (1987) data indicates the AR protection persisting up to 38 hours and fading does not begin until this “threshold” time, t0 = 38 hours, as shown in the Figure 1C of Leonard (2007b). We have premised that the fading stems from two causes, i.e. first limitation of (or willingness of the cell to devote) protection resources indefinitely and also secondly mitotic cycle dilution of the resources. The p factor is the mean time constant for the activation of the protection which is seen for a number of cell species to be about 4–6 hours. The H(x) is the Heaviside step function i.e. H(x) = 0 for x < 0 and H(x) = 1 for x ≥ 0. The Shadley et al (1987) data have not explicitly shown a fading function that diminishes with increased dose so Equations (2) and (3) were not formulated as a function of dose, D, just time after administration of the priming dose and does not include the function f(D).
2.1.b The Poisson Accumulation Function as the AR Protection Threshold and Transition Function Based on the Equations (1) and (1a) Protection Factor, Pprot
Feinendegen (2005), Feinendegen and Neumann (2006) and Feinendegen et al (2000, 2002, 2007) do not specify the form of the adaptive response protection function, P prot . They note that the mechanisms would encompass Reactive Oxygen Species (ROS) reduction by scavenging, increased DNA repair, activation of immune responses and cell death by apoptosis (see their Figure 5, Feinendegen et al 2007). The combined overall behavior certainly would not be expected to be an instantaneously “triggered” step function of dose (or dose rate). Tissue equivalent ionization chamber event distribution <z1> measurements (energy deposition per radiation induced charged particle traversal) in the proportional counter mode have been performed to simulate radiation events in cell volumes. The fractional increase in hits has been found to approximate the Poisson distribution accumulation function (ICRU 1983). This is true even in cases where microdose data suggest a threshold for the event sizes, i.e., <z1>, to cause an observed hit effect (Bond et al. 1985, see Figure 1). Thus an S-shaped hit size effectiveness function, HSEF, was proposed for the accumulation of radiation induced cellular events without specifically identifying the mathematical form of the function. Broad beam exposures are assumed to deliver Poisson distributed cellular events (Brenner et al. 2001, Miller et al. 1999, Little and Wakeford 2001). The Poisson distribution function, given by Equation (4) below, is presented in the Handbook of Mathematical Functions published by the United States Department of Commerce (USDOC 1970). They refer to the function in Equation (5) below as the Cumulative Sum of the Poisson Function therefore we feel it appropriate to call it Poisson accumulation function. The Poisson distribution function and the Poisson accumulation function are provided in the group of functions provided by the Quattro-Pro and Excel spread sheet computer programs. The differential fraction normal Poisson probability relation is given by

Graphic illustration of the Brenner et al (2001) BaD bystander model showing Bystander produced damage and Direct induced radiation damage.

where M is the mean number of events occurring (such as microdose hits) from the radiation dose and n is the number of incidental events (hits) necessary to produce the effect. M is the mean number of events for a statistically significant large cell population and is not an integer but a continuous function of dose. For microdosimetric hits then P(M, n) is the hit probability at a value of M in the differential range dM that the required n hits have occurred. The probability weighed net fractional increase in hits as dose is increased (and tracks) is given by the Poisson accumulation function

We are interested in determining for experimental dose response data, showing possible radio-protective behavior, the event accumulation in terms of minimum number of hits required to activate the radio-protection and also produce the deleterious damage. In Equations (4) and (5), if n = 0 then the value is one hit, if n = 1 the values are two hits, etc. We have demonstrated the use of these differential [Equation (4)] and accumulation [Equation (5)] Poisson functions in Figure 1 of Leonard (2007a) by actually applying them to the Redpath et al (1998, 2001) analysis. Radiation exposure, even at very small doses is expected to produce a proportionate amount of additional deleterious biological damage above natural spontaneous incidence observable at the measurable “end point.” However, some evidence shows that the nature of the radiation damage (such as the types of DNA double strand breaks and the resulting multiple break chromosomal lesions) may be different from the nature of the damage caused by natural spontaneous toxic endogenic influence, as compared to exogenic radiation induced damage. Ward was one of the first to examine the different modes of DNA damage that cause cell killing and potentially carcinogenic mutations (Ward 1985, 1988). Ward (1995) hypothesizes that the endogenic spontaneous chromosome damage is primarily from oxidized DNA base damage and further concludes that the exogenic radiation induced mutagenesis is not primarily from DNA base damage but from multiple damaged sites as a consequence of the spatial distribution of the deposition of the ionizing energy. We conclude that spontaneously and radiation induced chromosome damage must be analyzed separately and requiring separate Microdose Model parameters. Also, however, if there is a challenge dose (and its respective AR protection) using different quality radiation then we need to analyze this protection separately also. An example of this is the AR results of Wiencke et al (1986) where tritiated thymidine beta rays were used as the priming radiation source and 250 kVp X-rays were used as the challenge dose of 150 cGy. We thus define four such quantities from the Equation (5) Poisson accumulation function which we refer to as Activation Functions. We let Fs(M, S) = protective Poisson activation function for reduction in spontaneous damage, Fpr(M, O) = protective Poisson activation function for reduction in radiation damage from the priming dose, Fchal(M, Q) = protective Poisson activation function for reduction in the radiation damage for the challenge dose and Fd(M, U) = damage Poisson activation function for a possible threshold for activation of radiation damage. Here S, O, Q and U are the values of n in the evaluation of equation (5). The minimum number of hits in the respective critical volumes to produce the four effects are S + 1, O + 1, Q + 1 and U + 1 hits. This is assuming, for a given cell species that exhibits adaptive response behavior, that a specific number of radiation events, with a transition Poisson accumulation function, given by Equation (5), will activate the spontaneous and radiation damage radio-protections and a separate specific number of radiation events, also with a transition Poisson accumulation distribution, will initiate the induction of the priming dose deleterious damage. This provides a potential threshold for the priming dose radiation damage induction, if the data so reflects, as has been premised by some investigators. These continuous Poisson accumulation functions range in value from zero to unity as dose and number of hits increase. For the separate AR protections for spontaneous and radiation induced damage, we have also then separate protection transition functions, P prot–s , P prot–pr and P prot–chal respectively. These are given by P prot–s = P prot–s∞ Fs(M,S), P prot–pr = P prot–pr∞ Fpr(M,O) and P prot–chal = P prot–chal∞ Fchal(M,Q) where P prot–s∞ , P prot–pr∞ and P prot–chal∞ are the magnitudes of the AR protections when they are fully developed as discussed in Section 2.1.a and given in Equation (3) (the ∞ in the notations implies the fully developed protection). Thus, the protection will go from zero to P prot–s∞ , P prot–pr∞ and P prot–chal∞ , respectfully as hits and dose increase.
The radiation damage induction would be expected to be Linear-Quadratic at high dose and at low dose, where AR is activated, to be Linear with dose. So we have let priming dose induced damage response be given by P ind–pr = αFd(M,U)D which permits the potential of a Poisson accumulation threshold function, Fd(M,U), for damage induction, again based on a specific number of events, with also a transition Poisson accumulation function. α is the conventional damage rate per unit dose for single event radiation damage in the Linear-Quadratic formulism (Kellerer and Rossi 1972).
2.1.c The Concept of Microdose Specific Energy Hits to Critical, Sensitive Volume—Minimum Hits
At high radiation absorbed dose levels, the dose in a large tissue mass is essentially the same as a small tissue mass (micromass) such as a single cell. But due to the stochastic behavior, at low absorbed dose the total energy absorbed in the two masses are not the same. Adaptive response is found to be activated at low doses, thus it is necessary to define an energy deposited per unit micromass per microdose deposition event (hit). A cell cannot be aware of the presence of radiation unless a charged particle track has traversed its sensitive volume (or an adjacent cells sensitive volume if there is a bystander effect). Hence we must examine in a tissue micromass, a microdose, with the individual specific energy depositions, z1, and its fluence-derived mean value <z1>. <z1>, the probability weighted mean value of all the individual z1, is not a stochastic quantity and depends on the quality of the radiation and the size of the micromass. Absorbed dose, D, in terms of these individual specific energy depositions is the ratio of microdose hits in the micromasses, N H , per number of exposed micromasses, N e , times the mean microdose per hit, <z1>, i.e.,

Higher LET charged particles will produce higher microdose, i.e., higher <z1> and hence lower number of hits, N H , in Equation (6) for the same dose as compared to low LET tracks with lower <z1>. For the sake of consistency in terminology, we shall in the following text herein refer to microdose specific energy deposition events to the critical volume simply as microdose hits. A primary application of the microdosimetric approach to radiation damage has been the evaluation of relative biological effectiveness of radiations of different qualities in specific tissues i.e. Kellerer (2002).
A precise determination of the activation process is accomplished with the use of Microdose Model equations and the correlation of macroscopic dose to mean specific energy hits per sensitive target volume <z1>, at low doses, discussed in detail in Section 2.10. We will see, with the use of the Poisson functions, that the accuracy of the model is within ± one microdose hit since the best fit values of S + 1, O + 1, Q + 1 and U + 1 hits will define the Poisson accumulation functions. We have, to this point in our development, used a Poisson formulation variable M (i.e. dose induced “events”) contained in Equations (4) and (5) for Poisson distribution of events. Here we are applying the formulation to the specific energy hits per target volume to examine radiation dose response on a microdosimetry scale. From Equation (6), the average number of hits per critical volume (nuclei) is given by

and hence for our analysis the events variable M = N H /N e . With a knowledge of <z1> in units of cGy per hit, the average number of microdose hits necessary to activate the spontaneous or radiation damage protections or radiation damage induction can be expressed for each S, O, Q and U in hits. With then a knowledge of <z1>, we can reformulate dose response equations in terms of specific energy hits per target volume as the independent variable which would be valuable to the experimental radiobiologist in planning their exposures and analyzing their results in terms of bio-physical and bio-chemical behavior in resolving the eight unknowns enumerated in the Introduction Section.
2.1.d The Separate Thresholds and Transitions for AR Protection of Both the Spontaneous and Radiation Induced Damage from the Priming and Challenge Doses
There are three sources of damage in adaptive response exposures if subsequent challenge doses are delivered after exposure to small priming doses. They are the spontaneous endogenic damage, the exogenic radiation damage from the challenge dose and the exogenic radiation damage from the priming dose at higher dose where it begins to dominate over the protection. Each of these have the potential for AR protection at low priming dose levels and we can express the separate damage and AR protection thresholds and transitions. In Equation (1a), then the induced damage, P ind will be from priming radiation, which we call P ind–pr , and the challenge radiation, which we will call P ind–chal . In Equation (1a), we specify the four components of the dose response taking into account the adaptive response radio-protection:


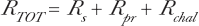
We can write a total dose response relation, R TOT , from these separate components based on the separate spontaneous and radiation damage protections and Equation (2) for the time dependent activation and fading.

where M = D/<z1>. To summarize, the net rate of incidence of total damage, R TOT , is the sum of the natural spontaneous (including the zero dose incidence rate) damage, R s , and the radiation induced damages, R pr and R chal , given by

where

and

and

with

where M = D/<z1> and from Equation (2) we let f(D,t p ) → RP(t, t0)f(D) from Equation (3).
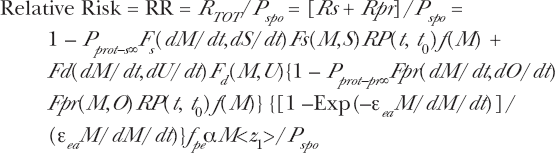
2.1.e The Normalized Relative Risk Dose Response Encompassing Adaptive Response Protection for Spontaneous Damage and Radiation Induced Damages from the Challenge and Priming Doses
As is frequently the case for radiation risks reported by the Radiation Effects Research Foundation for the Japanese A-bomb survivor data, we wish to express the relative risk, RR, (normalized with respect to zero radiation primer dose, natural spontaneous and challenge dose risks—P spo and P ind–chal ). In Sections 2.2, 2.3 and subsequent sections, we will express the dose response in terms of RR. In Equation (11), we express the adaptive response Microdose Model in terms of dose as the independent variable. It is also important to express the Microdose Model in terms of the Specific Energy Hits per Sensitive Volume as the independent variable by the relation M = D/<z1>. This enables the experimental dose response data and model fit to be displayed graphically on the abscissa in terms of both D and M [as we have done in Leonard (2007a, 2007b)] and offers the experimentalist better insight from a microdose perspective. We obtain

Here, for the Microdose Model to be structured solely with Specific Energy Hits, M, as the independent variable, we have used M = D/<z1> thus D = M<z1> for the Linear dose response. We see at zero dose, D = 0, M = 0, Fs(M,S) = Fpr(M,O) = Fchal(M,Q) = Fd(M,U) = 0 and RR = 1.0.
If there is no adaptive response protection of either the spontaneous or radiation damages, both P prot–r∞ , P prot–pr∞ and P prot–chal∞ = 0 and R TOT = P spo + Fd(M,U)αM<z1> and RR = 1 + Fd(M,U)αM<z1>/P spo = 1 + Fd(M,U)αD/P spo (with dose as the independent variable) showing a potential broad beam Poisson threshold and conventional Linear dose response at low doses past the threshold. If there is no threshold, Fd(M,U) = 1. Equation (17) is quite complex, but we will show that applying it to AR experimental conditions usually results in considerable simplification.
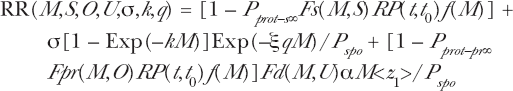
2.2. Large Challenge Dose with Same Radiation Source as Priming Dose Source
Usually the experimentalist uses the same radiation source to administer the priming and challenge doses. Then P prot–pr = P prot–chal . Also, if the challenge dose is sufficiently large, the effect of the spontaneous damage may be neglected i.e. P ind–chal > P spo . Then Equation (17), for challenge dose adaptive response studies becomes

where the chal&pr and O&Q denote both the challenge and priming dose protections. So only four parameters are required to be resolved in the fit of the model to challenge AR data i.e P prot–chal&pr∞ , O&Q, U and α. We have assumed that the prudent investigator has allowed time after the priming dose for the adaptive response to become fully activated (4–6 hours) and thus RP(t, t0) → 1.0. The behavior of the f(M) dissipation function would be determined by extrapolation of the high dose data points (see Sections 2.9, 3.4.c, 4.1.d and 5.4.
2.3. Spontaneous Adaptive Response Protection Only—No Challenge Dose
As noted above, some investigators have measured the adaptive response behavior of spontaneous, naturally occurring, potentially carcinogenic, damage. Noteworthy is the work of Dr. Redpath and his group for HeLa x skin cells. Equation (17) becomes
since we do not have a challenge dose damage component. Here only six parameters are required to be resolved to fit data to the model i.e. P prot–s∞ , S, P prot–pr∞ , O, U and α. If we assume that the AR protection is the same for both the spontaneous and radiation produced damage (which has not experimentally been established), then the Relative Risk, RR, becomes

with only four resolvable parameters, P prot–s&pr∞ , S&O, U and α. RR and P spo (the zero dose control value) are measured during the experiments and D is determined from the dose calibration for the experimental set-up. This excludes the retention and/or dissipation function, f(M), which is addressed in Section 2.9. We use the subscripts s&pr and S&O to denote that the spontaneous and radiation AR protections are the same. Equation (20) would also be the case as in our prior work, we have found that the threshold and transition of the Poisson accumulation functions for the spontaneous and priming damage AR protection are not separately resolvable. The priming dose damage AR protection, however, should be resolved by companion challenge dose AR measurements with the same radiation and cell species. Such companion measurements have not been done yet. We will discuss this in Section 5.9. It would be significant to determine if spontaneous and radiation damages are AR protected in the same way, even though we know that the initial damages are different (Ward 1985, 1988, 1995).
2.4 Extension of Adaptive Response Microdose Model to Dose and Dose Rate Dependence
As noted, in the later work (Leonard 2007b), the model was also modified to encompass dose rate as well as dose dependent adaptive response behavior for challenge dose damage radio-protection and applied to the dose and dose rate dependent data of Shadley and Wiencke (1989) for the challenge doses, as discussed above. We wish to explicitly formulate the dose and dose-rate dependent equations to model for AR protection of priming doses for challenge dose damage and also here for naturally occurring spontaneous damage. Again our basic dose response relation is given by Equation (12)
but now encompassing dose and dose-rate dependence where


and

with

The f(ɛ ea t) is the dose rate sparing function (DRSF), developed in earlier work [see Equation (3), Leonard (2000) and Equations (11)–(13), Leonard (2007c)] and is given by {[1 – Exp(–ɛ ea M/ dM/ dt)]/ (ɛ ea M/ dM/ dt)}f pe where exposure time, t = D/ dD/ dt = dM/ dM/ dt. The factor f pe is a constant repair factor for repair after exposure till either immediate or delayed plating of in vitro samples. We have introduced a dose rate dependence for the Specific Energy Hits vaiable, M, and the Poisson function parameters, S, Q and U. In Section 2.7 below, we will discuss the coupling between the dose-rate dependent Poisson accumulation functions and the dose dependent Poisson accumulation functions that is reflected in Equations (21) through (24).
2.5 The Spontaneous Only Dose and Dose-Rate Case
Using the Equations (21) through (24) relations, as Equation (25) below, we first provide the simpler relative risk relation for the spontaneous damage adaptive response protection (no challenge dose, priming dose only), dose and dose-rate dependent Relative Risk relation.
As in Equations (18) through (20), the total risk (dose response), R TOT is normalized here to the zero dose control (spontaneous) level, P spo , to provide a Relative Risk, RR, of unity at zero dose. This dose and dose rate dependent model is also for broad-beam exposures, such as for in vitro cultures and whole body animal and humans, where the random event Poisson accumulation of exogenic radiation induced charged particle tracks and deposition of energy (in microdose terms—specific energy hits, <z1>) through the sensitive region of the cell to initiate the radiation effects. The Poisson accumulation of the hits is given by the Poisson accumulation functions, F, defined by Equation (5). The M′s in the Poisson functions are the accumulated number of hits (Specific Energy Hits per Sensitive Cell Volume) proportional to dose i.e. M = D/<z1> since the units of <z1> used here is cGy per Specific Energy Hit per Sensitive Cell Volume. The Poisson accumulation of the hits produces the three effects, the activation of the AR radio-protections for the spontaneous damage protection, Pprot—s∞, with the coupled dose and dose rate Poisson functions Fs(dM/dt, dS/dt) Fs(M,S) and the priming dose radiation damage protection, P prot—pr ∞ with the coupled dose and dose-rate Poisson function Fpr(dM/dt, dO/dt) Fpr(M,O) and also the threshold for the initiation of the normalized deleterious damage, (α/P spo ) with the coupled Poisson accumulation function Fd(dM/dt, dU/dt) F d (M,U). The important features, of the Fs and Fpr Poisson functions are, in our analysis that at the AR thresholds, the minimum number of hits, S+ 1, O+ 1 and U+ 1 respectively must be received before the hit dose rates, dS/dt, dO/dt and dU/dt respectively can initiate the protection (even if the hit rates, dM/dt's have reached the minimums dS/dt and dO/dt). First the minimum hits, S+ 1, O+ 1 and U+ 1 hit values are determined from constant dose rate data points for varying dose and M. Equation (25) appears very forbearing but we will show below in application to experimental data that the relation becomes considerably simplified. If as in Equation (20) above, the AR protections for the spontaneous and priming dose damage are assumed the same or can not be resolved separately, then we let

We have then only seven parameters, Pprot—s—pr4, dS/dt, S, dU/dt, U, ε ea , and the product f pe α to be fit by the model to data.
This AR dose and dose-rate dependent microdosimetry model is fit to the Elmore et al (2006) dose and dose rate dependent spontaneous data in Section 3.1 using the same iterative Method of Least Squares described and used in the prior works (Leonard 2005, 2007b) to examine the challenge dose data, from dose and dose-rate dependent priming dose exposures, of Shadley and Wiencke (1989).
2.6 Use of the Microdose Model to Analyze Dose and Dose-Rate Dependent Challenge Dose Adaptive Response Data
Equation (25) is applicable to the dose and dose-rate dependent adaptive response protection of spontaneous damage. We noted in Section 2.2 that only if the challenge dose is sufficiently large, such that P chal > P spo , can the spontaneous contribution be neglected. In such case the dose and dose-rate dependent Microdose Model normalized relative risk response is given by stipulating R s << R chal . Then, from Equation (24)

Note as above that to obtain Relative Risk, R TOT is normalized by the initial challenge dose damage, P chal . Again if the same radiation is used to administer the priming and challenge doses, then their protective functions will be the same and we have

where again chal&pr denotes challenge and priming dose protection being the same. We thus have seven parameters to resolve in applying the model to data i.e. Pprot—chal&pr∞, dQ&DO/dt, Q&O, dU/dt, U, ε ea , and the product f pe α.
2.7. The Coupled Dose and Dose Rate Poisson Accumulation Functions
In Section 5.5, we discuss possible other dose and dose-rate coupling functions for the dose and dose-rate dependent Microdose Model for adaptive response. Similarly, we have shown in prior work (Leonard 2007c) that the dose dependent HRS/IRR and dose-rate dependent IDRE apparently have dose and dose-rate couplings (see Figure 4, Leonard 2007c). We had proposed earlier a product dose and dose-rate transition relation for those two radio-protective effects (see Section 2.3, Leonard 2000). No cellular bio-chemical premises from experimental results have yet been provided for the couplings. The coupled Poisson product notation, F(dM/dt, dn/dt) F(M,n), is our own contrivance and is not conventional. We define the notation as meaning that first the threshold value of n number of events must be reached by increasing M. The Poisson accumulation function then becomes event rate dependent and satisfies Equation (5) with increasing M by

and then for the Poisson accumulation functions, at issue here


It is important to point out that the Poisson distribution and Poisson accumulation functions may be considered probability functions, in fitting to experimental data by the Method of Least Squares. Determination of the best fit S, O, Q and U facilitates the use of them as continuous functions of dose, D, and M just as other mathematical functions such as for example the exponential function in Equations (26) and (27) for the dose rate sparing. Hence the model becomes an analytical model and is applicable to quantitative estimation of the measured values of Relative Risk on the left side of the equations.
2.8. Extension of the Dose Dependent Only Microdose Model in Section 2.1.e to Encompass Bystander Damage
Morgan (2006) premises that the outcome of the Linear-No Threshold controversy for human radiation risks (which we discuss in Section 5.7 below) will depend on what is concluded relative to the bystander and adaptive response effects. The Microdose Model developed above and in prior work (Leonard 2000, 2005, 2007a, 2007b, 2007c) is here modified to encompass bystander dose response. In the Results Section, we will then apply this composite AR-BE Microdose Model to the recent dose response data of Hooker et al (2004) for low LET radiation exhibiting both adaptive response and deterious bystander behavior and to some micro-beam data explicitly exhibiting bystander damage and to the low LET mammogram and diagnostic X-ray data showing conclusive evidence of protective bystander behavior.
2.8.a. The Brenner et al (2001) BaD Bystander Model For Broad-beam Exposures
We have noted above that to adequately anticipate human risk there is the need for evaluating broad-beam in vivo exposure responses (a whole body exposure as received by a nuclear worker would be considered “broad-beam”) experienced by human exposures by extrapolation from the micro-beam in vitro data. Brenner et al. (2001)—(see their Figure 3a)—have made a direct comparison of the bystander effect between single-cell micro-beam and broad-beam cell population exposures in vitro. They have modeled the dose response behavior for the bystander effect for both single-particle in vitro and what may be predicted for Poisson distributed particle broad-beam exposures in vivo and in vitro laboratory exposures. A simplified version for their broad-beam, BaD model [see their Equation (13)], relation is

We provide as Figure 1 a reproduction of their Figure 4 illustration of the BaD bystander model. In Equation (33), TF is the oncogenic transformation frequency, Brenner et al (2001) define γq as the slope of the direct damage dose response for oncogenic transformation for a Poisson distributed mean number of alpha particle traversals <N> and thus is the direct damage oncogenic transformation production rate per mean alpha particle traversal, q is the probability of a cell surviving a single alpha particle traversal of its nucleus, γ then is the direct damage production rate of oncogenic transformations per surviving cell that has experienced an alpha particle traversal, <N> is the Poisson distributed mean number of alpha particle nucleus traversals (hence proportional to absorbed dose, D, and equal to our microdosimetry M independent variable), σ = the fraction of cells that are hypersensitive to oncogenic transformation (or prevention of transformations for protective bystander mechanisms, in which case σ would be negative but would be the fraction of the total damage receiving protection) by the bystander signal and k is the number of the unirradiated neighbor cells that receive a bystander responsive signal (Brenner et al 2001). The first term in Equation (33) is the linear direct damage term as shown in Figure 1. As noted by Brenner et al (2001), since <N> is proportional to dose (in our composite model, we will allow for both linear and quadratic direct damage although at low doses the behavior is primarily linear), this corresponds to the αD linear term in the conventional linear-quadratic dose response equation. The second term in Equation (33) is the bystander damage contribution to the transformation frequency. Brenner et al (2001) proposes that the bystander effect is as a result of a small population of hypersensitive bystander receptor cells such that the [Exp(–q<N>)] “Depletion” transition function in Equation (33) characterizes the depletion of these hypersensitive cells by inactivation by hits from the direct damage. The [1 – Exp (–k<N>)] “Hit probability” transition function provides the probability that at least one cell is directly hit where as noted k is the number of un-hit neighbor cells receiving the bystander signal. In Figure 1, we show how these two functions behave with increased dose (and alpha charged particle track traversals) and combine as the product [1 – Exp (–k<N>)] [Exp (–q<N>)] to facilitate the total Bystander Damage component of BaD. Figure 3 of their work (Brenner et al 2001) provides a representation of Equation (33) for k = 10 and 500 showing the initial bystander damage effect and then the dominance of the linear direct damage term at higher dose. This BaD Model Equation (33) has been applied to high LET Radon dose response (Little and Wakeford 2001, Little 2004, Brenner and Sachs 2002).
2.8.b Oncogenic Transformations, Chromosome Damage Such As Aberrations and Carcinogenesis
In the Equation (33) above, Brenner et al (2001) expressed their model in terms of the experimentally observable cell assay parameter, oncogenic transformation frequency—TF, since this assay parameter is used in the Columbia microbeam studies. As described in Miller et al (1999), they identified morphologically transformed types II and III foci in their microbeam and broadbeam comparisons [see Hall (2000) pages 258–261 for the oncogenic transformation assay method and laboratory results]. Observing the induction of transformed foci is one way to detect the expression of potential carcinogenesis. As we shall show, studies such as those of Hooker et al (2004) for low LET radiation and Pohl-Ruling and her associates (Pohl-Ruling and Fischer 1979, Pohl-Rüling 1988, Pohl-Ruling and Pohl 1990) of alpha particle production of chromosome aberrations, are directly applicable to potential bystander effects since they too have direct correlation to carcinogenesis by non-lethal mutations. We thus assume a direct correlation between transformation frequency and other cellular damage such as chromosome aberrations, micronuclei frequencies, dicentrics and rings etc. just as Brenner and Sachs (2002), Little (2004) and Little and Wakeford (2001) did between the BaD model transformation frequency and lung cancer with respect to analyzing radiation cell damage effects.
The BaD model should also be applicable to other high and low LET radiations as suggested by Brenner and Elliston (2001) for galactic radiations.
2.8.c. The BaD Bystander Model Adapted to Both Dose and Specific Energy Hits as the Independent Variables for Synthesis with the Adaptive Response Microdose Model to Provide an AR-BE Microdose Model
The Equation (33) for the BaD bystander model uses the parameter <N>, Poisson distributed mean number of charged particle traversals, as the independent variable for the description of the activation and progression of the Bystander and Direct Damage dose response. Then <N> is equivalent to the independent variable M in our adaptive response Microdose Model. We provide our model with both M and dose, D, as independent variables for the benefit of the radio-biologists. The experimental radio-biologists report their dose response in terms of tissue absorbed dose since their experimental setups utilize this parameter which is easily quantified by dosimetry instruments usually calibrated by national standard agencies such as the U.S. National Institute for Standards and Technology (NIST). The experimentalist needs to correlate our AR-BE composite model with their dose response data but also use the microdose concepts to evaluate their results and to plan their future experiments. In encompassing the BaD model, we shall therefore present our composite model, as was done with Equations (14) and (16) of Leonard (2007a) and here, in terms of both critical volume traversals (Specific Energy Hits) and dose as the independent variables. Tissue absorbed dose is linearly proportional to <N> by the relationship Absorbed Dose = D = <N><z1> as is the case for M<z1>, where <z1> is the microdosimetry quantity Specific Energy Deposition per Critical Volume Traversal (Hits). The units of <z1> are cGy per critical volume track (hit). We note above that this quantity is used extensively in the theory of microdosimetry (ICRU 1983) and in our prior work is quantified in subsequent sections and reported in Table 1 of Leonard (2007a). We shall here refer to <z1> as Specific Energy per Hit.
Summary of Composite AR-BE Micro-dose Model Parameters Best Fit By Iterative Method of Least Squares

NA, not analyzed; NR, not resolved.
In our model, with absorbed dose—D—as the independent variable and for production of cellular damage such as chromosome aberrations, then in Equation (33) we wish k and q to be converted to cGy−1 units instead of tracks–1 by letting
 . Also, Brenner et al (2001) propose that every “neighbor” bystander cell is hypersensitive to transformation and quantified by the parameter q. The portion that is transformed is quantified by the parameter, γ, which provides for the direct damage term,
  It is also specified that all cells that are traversed become inactivated with the depletion factor [Exp
  ]. We can imagine that this may not be true since at least some of the transformed fraction may remain viable cells. So considering the possibility that this is not 100% the case, we include in our model a hit inactivation efficiency factor, ξ, which should be 0 < ξ < 1.0, such that we let the depletion factor be given by [Exp
  ] where D is absorbed dose. Then for the Direct Damage, we have
  where again γ = direct damage production rate of oncogenic transformations per surviving cell.
  is the probability of a cell surviving per unit dose (here in cGy) and
  is the direct damage cellular damage production rate per unit dose in cGy−1 (which is equal to the linear, single event damage coefficient per unit dose, α, found in the conventional linear-quadratic dose response formalism). We have thus made the correlation between oncogenic transformations and dose dependent cellular damage such as chromosome aberations. So the BaD relation we shall use is thus given by.

where the above defined parameters are applicable to dose dependent cellular damage “endpoints”.
2.8.d. The Composite AR-BE Microdose Model with Bystander and Adaptive Response Effects
In the formulation of a composite BE and AR model, the radiation dose response can be expressed in terms of charged particle traversals through the exposed medium [Equation (33)] and also tissue absorbed dose [Equation (34)]. We shall assume that there are no intracellular interactions between the separate processes creating the potentially deleterious (or protective) bystander and the potentially protective adaptive response mechanisms. The composite model encompassing both processes can be given by
Dose Response = Initial Spontaneous Damage (with AR protection) + Bystander Effect Damage + Direct Deleterious Damage (with a possible threshold and AR protection)
As defined above, the zero dose natural spontaneous damage is given by P spo . From Equations (19) and (34), we have for the normalized relative risk, RR = Dose Response/P spo and

where M = D/<z1>. Again for absorbed dose = D = 0, M = 0 and RR = 1.0. If there is no AR protection or bystander effects i.e. P prot—s∞ = Pprot—pr∞ = σ = 0, then R TOT = P spo + Fd(M,U) αD, thus we have the initial spontaneous damage and Linear radiation damage response after a possible threshold.
Note that we do not have the BaD model Direct Damage term, γq<N>, since we have the linear Direct Damage dose response term, αD, already in the AR portion of the composite model. Further, (D/<z1>) = <N> and M in units of charged particle tracks (hits), So the first term, [1 – Pprot—s∞ Fs(M,S) RP(t,t0) f(D)], is the normalized natural spontaneous damage including reduction by adaptive response radio-protection; the second term,  , is only the bystander damage part from the BaD model normalized to the initial spontaneous damage and the third term, [1 – Pprot—pr∞ Fpr(M,O) RP(t,t0) f(D)] Fd(M,U) αD/P
spo
, is the normalized (to the initial spontaneous level, P
spo
) direct linear response (deleterious direct damage) including adaptive response radio-protection of this damage (by the Poisson Fpr function) and a possible Poisson accumulated threshold for the initiation of this direct damage (Fd).
, is only the bystander damage part from the BaD model normalized to the initial spontaneous damage and the third term, [1 – Pprot—pr∞ Fpr(M,O) RP(t,t0) f(D)] Fd(M,U) αD/P
spo
, is the normalized (to the initial spontaneous level, P
spo
) direct linear response (deleterious direct damage) including adaptive response radio-protection of this damage (by the Poisson Fpr function) and a possible Poisson accumulated threshold for the initiation of this direct damage (Fd).
The composite bystander and adaptive response AR-BE Microdose Model Relative Risk, in terms of Specific Energy Hits per Critical Volume, M, as the independent variable, is given by
with M = D/<z1>. Here if M = 0, then absorbed dose = D = 0 and RR = 1.0.
2.8.e. Protective and Deleterious Bystander Effects
Both protective and deleterious Bystander Effects in the presence of Adaptive Response radio-protection can be examined with the modeling in this Section 2.8. We will show the case of deleterious Bystander Effects reported by Hooker et al (2004) and examined in Sections 3.2.a and 4.2. We will show a protective Bystander Effect behavior, which can be modeled in Equations (35) and (35a) by setting negative values to the parameter σ, the fraction of cells that are hypersensitive, providing for them to be hypersensitive to protective Bystander signaling. We will examine, in Sections 3.4 and 4.1.c, the data of Ko et al (2004) that shows conclusive protective Bystander Effect behavior by using a negative value for σ.
2.9. Modeling for Adaptive Response Retention or Dissipation at High Dose (and High Dose Rate)
We have in prior works [see section “High dose dissipation of protective effect” in Leonard (2007a)] raised the question of whether the Adaptive Response radio-protection is retained or dissipated at high doses (and high dose rates). This relates to whether, bio-chemically, the protective mechanisms and damage mechanisms are inter-connected. As Equation (1) above, we have provided the Feinendegen et al (2007) formulism for Adaptive radio-protection. The term Pprot f(D,t p ) = cumulative probability of adaptive protection per individual per unit D against cancer by any cause (i.e. both Pspo and Pind), as a function of D and duration of the protective time, t p , which we interpreted as both fading and high dose retention times as discussed in Section 2.1.a. where we have thus let the Feinendegen et al (2007) f(D,t p ) → RP(t,t0) f(D) to separate the fading [RP(t,t0)] and the dose dependent retention or dissipation [f(D)]. In Feinendegen et al (2007) they show in their Figure 4, t p , this mean protection fading time constant and the fading function f(D,t p ), to vary with the type of endogenic AR protection that is induced—currently unknown and which we shall examine.
We reproduce the Feinendegen et al (2007) Figure 7, as our Figure 2 herein, that graphically illustrates the possible dose response behaviors from the above Equations (1) and (1a) Feinendegen et al (2007) formulism. Two scenarios are shown in Figure 2. One is the premise that the Adaptive Response protection is sustained at the high radiation levels (the lower of the two fine dashed “Effect of Adaptive Protection” curves and the two course dashed “Net Rad. Cancer Risk” curves). The second scenario is the premise that the AR protection is dissipated with the increased radiation level, in which case the upper curves would apply. At these low levels of radiation on the graph, the “Induction (of carcinogenesis) by DNA-Damage” is shown to be linear with dose for both low LET and high LET radiations. As seen from the two scenarios, if the AR protection is dissipated at higher dose then extrapolation of the “Net Rad. Cancer Risk” back to the zero dose origin will intercept at the spontaneous “Metabolic Cancer Risk” on the graph. If, on the other hand, the AR protection is retained, extrapolation of the high dose linear region of the “Net Rad. Cancer Risk” curve back to the origin will intercept below the spontaneous “Metabolic Cancer Risk” level at approximately a negative value equal to the amount of AR protection that is retained at high dose.

Dual Effect of Low-Dose (Low-LET) Radiation simplified scheme
In our development of the Micro-dose Model equations herein, we have assumed that the experimental radiobiologist, in planning their research, is aware of the AR activation and fading work of Shadley et al (1987) and others and our modeling of them in Leonard (2007b). Thus we have set RP(t,t0) = 1.0 for fully developed AR such that our equations still however contain the yet undetermined retention and/or dissipation function f(D) [and f(M) for micro-dose hits] depicted in the Feinendegen et al (2007) illustration—our Figure 2. After the dissipation (or absence thereof) the high dose behavior is expected to be linear as shown in Figure 2. Geometry states that two points in space define a linear straight line. Thus, two high dose data points should provide the straight line, linear extrapolation back to the origin. For example, in Equation (20) for spontaneous only damage at high dose and large hits (M), F s—pr (M,S&O) and F d (M,U) → 1.0 and

If the AR is retained, f(M) = 1.0 and if then we extrapolate Equation (36) back to the origin i.e. for D = M = 0 Equation (36) becomes

If AR is totally dissipated, f(M) = 0 and we have by extrapolating back to the origin i.e. for D = M = 0

So if the AR radio-protection is retained in spite of the high radiation induced primer dose Direct Damage, the origin intercept will yield reduced spontaneous AR protection level. To determine the linear relation for the high dose behavior several statistical methods are specifically designed for analyzing linearly behaving data. They are the well known Method of Rank Regression, MRR and the Method of Maximum Likelihood Estimator, MLE (Papworth 1975, Kellerer 2003). We shall use the MLE method to analyze the high dose region of the Ko et al (2004) mammogram X-ray data in Sections 3.4.c and 4.1.d.
2.10. Determination of the Mean Specific Energy per Sensitive Volume Hit—<z1>
The amount of radiation energy deposited, on a microdose level, into the cells sensitive volume by a charged particle traversal, is dependent on the linear energy transfer, L e (in units of keV/μm) and the mean chord length, l (in units of μm), traversed through the sensitive volume. The mean chord length, of course, depends on the size of the Sensitive Volume. With the observed transmission of bystander signals by intracellular medium (Mothersill and Seymour 1997) and alpha particle targeted cytoplasm induction of bystander effects (Shao et al 2004), it is difficult to define a Sensitive Volume (Goodhead 2006). In the use of the Microdose Model, choice of the representative sensitive volume directly influences the value of <z1> and the results in the use of the model. In the earlier works (Leonard 2005, 2007a, 2007b) the sensitive volume is chosen to be the cell nucleus, based on the micro-beam measurements by Miller et al (1999) where it was found that the cytoplasm is insensitive to alpha particle traversals. The nucleus has been used by many others as the sensitive region in cellular dose response analysis (Brenner and Elliston 2001, Brenner and Sachs 2002, Little and Wakeford 2001, Little 2004). Feinendegen et al (2007) uses, as an estimate, the entire cell volume and a qualitative mass of 1 ng for the microdose target in his qualitative discussions about microdosimetry. Even though there are premises that there are protective bystander effects and apoptosis occurs on a linear fashion beginning at zero dose (see Figure 5, Feinendegen et al 2007), as well as the high LET deleterious bystander effect from microbeam studies, that suggests a larger target; the choice of the nucleus provides a basic reference target. For example, if there is a protective “bystander type” adaptive response, finite integer values of S and O will not be obtained (i.e. S and/or O < 0 then S + 1 and/or O + 1 < 1 Hit) hence indication of the protective “bystander type” adaptive response activated below a single nucleus traversal. By using the nucleus as the sensitive volume, if there is a larger target, the data evaluation with the Microdose Model will reveal this in the use of the Specific Energy Hits per Nucleus scale for the abscissa—see Figures 2, 3A and 3B and 4A of Leonard (2007a). We will discuss this further in Sections 5.2 and 5.3 below and illustrate with Figure 10.
To obtain a value for <z1>, knowing the diameter of the sensitive volume, first the volume and the mass, m(g), of the sensitive volume may be obtained using a mean cell density of 1.04 g cm−3 (Attix 1986). This provides the energy deposited per unit mass, E(keV g−1) = L e l/m for a single charged particle track across the sensitive volume. With the energy to absorbed dose conversion factor (1.6022 × 10⁻¹¹ cGy g keV−1), we have <z1> = D (cGy per hit) = 1.6022 × 10⁻¹¹ (cGy g keV−1) × E (keV g−1 per hit). Thus,

Several investigators have examined the chord length problem (Kellerer 1984, Ellett and Braby 1972, Enns and Ehlers 1993). By considering the mean chord length per cell cross-section area, an analytical approximation for <z1> was offered by Kellerer and Rossi (1972) as a function of spherical critical volume diameter, d, and the linear energy transfer, L e , of the radiation, i.e.

Booz (1978) has provided values for L e ; Co-60 0.28 keV/μm, Cs-137 0.37 keV/μm, 250 kVp X-rays (1.77mmCu) 1.22 keV/μm, 250 kVp X-rays (0.44mmCu) 1.85 keV/μm, 200 kVp X-rays (5mmAl + 1mmCu) 1.52 keV/μm, 65 kVp X-rays (1.9mmAl) 2.19 keV/μm as well as charged particles and neutrons. Attix (1986) provides values of L e for mono-energetic electrons and other charged particles. Ellett and Braby (1972) have computed the mean specific energies per hit, <z1>, (see their Table 2) for 60Co gamma rays, 250 kVp (HVL 1.8mmCu), 250 kVp (HVL 0.44mmAl), 65 kVp (HVL 1.9mmCu) X-rays and Tritium beta rays. Values of <z1> have been measured for various radiations using tissue equivalent proportional counters (ICRU 1983).
In studying how investigators have determined cell sizes with primarily microscope images, it must be realized that there is considerable variation in visibly obtaining representative average cell diameters. We would estimate an uncertainty on the order of ± 30%. Due to also some uncertainty in the value of the Linear Energy Transfer constant, L e , for the radiation, this will result in the mean specific energy deposition per nucleus traversal constant, <z1>, being uncertain by about 45%. However, as we have noted, the uncertainty in the use of the Poisson accumulation functions is ± one Specific Energy Hit but, as we have seen, for small numbers of hits for AR activation. To show this, in Figure 2A of Leonard (2007a) we provide the Poisson accumulation functions and the resulting model fit curves for one, two and three specific energy hits, illustrating a significant distinction in the quality of the fits from a difference of one hit. In the Table 2 therein we provide the trial fits %SDs showing the resolution ability to ± one specific energy hit. Here, in the Figure 3B analysis of the Elmore et al (2006), we show a distinct superior fit of one Specific Energy Hit data to their data. This will mean that, for the small numbers of hits as seen to occur for the initiation of the adaptive response protection i.e. N + 1 and Q + 1 hits, the ± 45% uncertainty in the absolute value of <z1> becomes less significant. This 45% uncertainty has a larger effect on any deleterious damage threshold for larger values of specific energy hits, U + 1.
3. RESULTS
We have in the above sections developed Microdose Models for instances 1.) where only adaptive response radio-protection is observed in experimental data and also 2.) where, in yet experimentally rare low LET in vitro or in vivo cases, there is evidence of deleterious bystander damage as well as possible adaptive response protection. We note above that adaptive response radio-protection against naturally occurring, potentially carcinogenic spontaneous chromosome aberrations is far more significant with respect to implications of human radiation health risks. We here, in Section 3.1, apply the dose and dose-rate dependent adaptive response Microdose Model, Equation (19) for spontaneous AR protection, to the very significant recent work of Dr. Redpath's group (Elmore et al 2006). In Sections 3.2 and 3.4, we shall apply the composite bystander and adaptive response (AR-BE) Microdose Model, Equations (35) and (35a) to relatively rare low LET data of Hooker et al (2004) and Ko et (2004) reflecting both bystander and adaptive response, the former—deleterious—and the later—protective.
3.1 Analysis of the Elmore et al (2006) Dose and Dose Rate Dependent Adaptive Response Data
We have previously examined spontaneous adaptive response for several cell species (Leonard 2005, 2007a), but for only dose dependent data that is also rather sparse in the very low threshold and transition dose region and making it difficult in accurately defining these initial threshold and transition of the protective damage reduction. The very recent dose and dose rate dependent data, of AR effects on spontaneous damage, of Elmore et al is a welcome exception.
3.1.a Graphical Examination of the Elmore et al (2006) Data
Elmore et al (2006) provided dose dependent graphs of their data as their Figures 4 and 5. As was done in our prior work and noted above, we have normalized the neoplastic transformation frequency data to the zero dose control values, P spo , providing RR = R TOT /P spo in Equations (25) and (26), which we have referred to here as Relative Risk dose response. We wish to examine how the dose response varies with dose rate as well as dose, so as Figure 3, we provide the variation of relative dose response with priming dose for the four separate dose rates in cGy min−1 units, 0.019, 0.047, 0.091 and 0.19 cGy min−1. As Figure 4, we provide the variation of dose response with priming dose rate for the four doses in cGy units, 1.0, 10, 50 and 100 cGy.

For the four different dose rates, 0.019, 0.047, 0.091 and 0.190 cGy min−1, used by Elmore et al (2006), the Relative Dose Response data are presented as a function of dose in the four Panels 3A–3D for the four dose data points 1.0, 10.0, 50.0 and 100 cGy. The solid black curve is the microdose model best fit, the solid red curve is the Poisson Accumalation Function, Fs, for the activation of the spontaneous damage adaptive response protection based on the best fit value, S + 1 = 1 specific energy hit and the solid blue curve direct radiation damage threshold, Fd for U + 1 = 4. The Specific Energy Hits per Nucleus scale is based on <z1> = 0.638 cGy per nucleus “hit.” This scale is the same for all figures. In Panel 3B, we show the fit of the adaptive response parameter, S, to the threshold and transition region. It is shown that S = 0 and s + 1 = 1 Specific Energy Hit activates the AR.
In Figure 3, we can see in Panels A and B a distinct presence of an AR type response reduction at the 1.0 cGy dose data point and the persistence to the highest dose of 100 cGy. We have used a logarithmic scale for Figure 3 due to the large range of doses. In Panel C, we see minimal response reduction and the beginning of an apparent deleterious priming dose direct damage at the 50 cGy data point. We see the same in Panel D, with here essentially no AR reduction and the continuation of the direct damage behavior. In the dose rate dependent Figure 4, we can see, with the two lowest dose rates of 0.019 and 0.047 cGy min−1, the initiation and transition of the AR reduction for all four Panel doses. This means a definite dose rate threshold. We further see, in terms of dose rate, that the AR protection does not dominate at the higher dose rates of 0.091 and 0.190 cGy min−1. We see the deleterious priming dose direct damage beginning to again dominate, this time in terms of increased dose rate, which suggests the low dose rate sparing is seen to become diminished by increasing dose-rate toward acute dose rates—as was seen for the Shadley and Wiencke (1987) data (see Figure 1B, Leonard 2007b).

The Elmore et al (2006) dose and dose rate dependent Relative Dose Response data graphed versus the four dose rate data points. Each of the four Panels 4A–4D are for each of the fixed priming doses of 1.0, 10.0, 50.0 and 100 cGy. As in Figure 1, shown is the solid black curve model best fit and the Poisson Accumulation Function, Fs, for the spontaneous damage adaptive response protection and the solid blue curve for the direct radiation damage threshold transition.
3.1.b Determination of an Effective Value for the Microdose Parameter Specific Energy Deposition (Hit) per Nucleus Traversal, <z1>, for 125I Radiation
Microdosimetry involves the analysis of individual radiation induced charged particle traversals through the sensitive region of the cell. To correlate these traversals to the macroscopic dose administered to the cell, it is necessary to know the energy deposited per traversal which is commonly called the Specific Energy Deposition per Nucleus Traversal (Hit), given by <z1>, assuming the sensitive cell region is the cell nucleus. This parameter is discussed in detail in prior works (see Table 1 of Leonard 2007a, 2007b) and in Section 2.10 above and depends on the mean Linear Energy Transfer constant (LET) and the size of the cell nucleus. The size of the HeLa x skin nucleus was estimated by Miller et al (1999) to be 11.9 μm. Using a Linear Energy Transfer (LET) value of 0.37 keV per μm for the 137Cs 0.661 Mev gamma ray source used by Redpath et al (1998, 2001), we obtained a <z1> value of 0.05 cGy per nucleus hit in the analysis of their work (Table 1, Leonard 2007a). Here for the Elmore et al (2006) data, the target cells are the same but the LET is very different for the very low energy photons from 125I (30 keV). Attix (1986) and other text provide values of the mass energy transfer coefficients and stopping powers for photon energies from 0.010 to 10 Mev based on the Klien-Nishina formulation, however recent LET measurements by Kellerer (2002) for very low energy mammography, 30 kVp, X-rays provides the best, most direct, relative data. He determined the Frequency Mean Photon Energies from the X-rays to be about 20 keV and the LET of these electrons to be 4.34 keV per μm. If we use this LET value for the 125I photons (since the average energy of the Compton scatter electrons will be lower than the photon energy), the <z1> would be the LET ratio relative to the 137Cs value i.e. <z1> = 0.05 cGy hit−1 × (4.34 keV μm−1)/(0.37 keV μm−1) = 0.638 cGy hit−1. In using this value here, we will place an uncertainty of about ± 45% such that we let <z1> = 0.638 ± 0.29 cGy hit−1 for our analysis.
3.1.c. Application of the Microdosimetry Model to the Elmore et al (2006) Data
We have fit the adaptive response microdosimetry model to the Elmore et al (2006) dose and dose rate dependent data by the iterative minimum “Method of Least Squares” used in prior data analysis. What the model yields and we have obtained are the best fit parameters, Pprot–s∞—the maximum AR protection from the spontaneous damage, μ + 1—the Poisson distributed minimum number of specific energy hits (and thus dose) that activates the protection for the spontaneous damage (as noted above and in prior work, in the Poisson relation, S = 0 provides 1 hit, S = 1 is thus 2 hits, etc.), dS/dt + 1—the Poisson distributed minimum specific energy hit rate (and thus corresponding dose rate) that activates the spontaneous protection, O + 1—the Poisson distributed minimum hits to activate AR protection for the priming dose induced direct damage, dO/dt + 1—the Poisson distributed minimum hit rate for the AR direct damage protection, U + 1—the threshold Poisson distributed number of specific energy hits (and thus dose) where the direct damage begins to occur, dU/dt + 1—the threshold Poisson distributed hit rate (and thus dose rate) at which the direct damage occurs and finally the contribution of reduction in dose rate sparing to the increased direct damage by determination of the dose rate repair rate constant, ε ea , in the dose rate sparing function, f(ε ea t) = [1 – Exp (–ε ea t)]/(ε ea t) = [1 – Exp (–ε ea D/dD/dt)]/(ε ea D/dD/dt) = [1 – Exp (–εM/dM/dt)]/(ε ea M/dM/dt) since exposure time, t = D/dD/dt = M/dM/dt. Altogether there are then ten parameters to be resolved, α, Pprot–s∞, S, dS/dt, O, dO/dt, U, dU/dt and εea, with 20 data points, thus providing 10 degrees of freedom. As was the case in the Shadley and Wiencke (1989) data, there was insufficient data to separately resolve O, dO/dt and Pprot–r∞ values which may be the same as S, dS/ dt and P prot–s . Here then we have used Equation (28) above requiring only seven parameters were actually obtained providing 13 degrees of freedom. The zero dose, control spontaneous damage, P spo and dose and dose rates are measured. The solid black lines in the Figures 3 and 4 provide the model best fit Relative Dose Response to the data. The percent standard deviations (%SD) are shown. In Figures 3 and 4, the lowest dose (left) solid red curve is for the F s (spontaneous) and the right solid blue curve is the dose rate Poisson threshold for the deleterious damage, F d . The Figures 3A and 3B show no direct damage and no F d curves are presented. As was done for the challenge dose AR behavior of Shadley and Wiencke (1989) (see Figure 3, Leonard 2007b), we provide as Figure 5A here a 3-dimensional graph of the model fit. The overall fit was to ± 21.7 %SD. The following values were obtained for the best fit. S+ 1 = 1 hit (In Figure 3B, we show the trial fits for S+ 1 = 1, 2 and 3 hits); dS/dt= 0.03 hit per minute (1.8 hits per hour); U+ 1 = 4 hits; dU/dt= 0.16 hits per minute; Pprot–s∞ = 0.54; αf pe /P spon = 0.005 cGy−1 and ε ea = 0.01 min−1. The best fit values of the parameters are given in Table 1. In the use of Equation (18), the AR activation and fading function, RP(t,t0) = 1.0, since the Elmore et al (2006) group allowed sufficient time for any AR protection to materialize. We will discuss this limitation in Section 5.6 below. We know that there is AR protection for radiation induced damage by virtue of the protection that is observed for challenge dose experiments, even though here separate values for O, dO/dt and Pprot–r∞ were not resolvable. The model fit in Panel D of Figure 3 for the highest dose of 100 cGy suggests one data point, at the dose rate of 0.091 cGy min−1, to perhaps be an “outlier” due to its unreasonably high value when fit to the model. Also, Panels C and D of Figure 3 show no adaptive response reduction behavior, which is unexpected. In Figure 5, we provide dose and dose rate 3-D graphical correlations with the Shadley and Wiencke (1989) challenge dose rate dependent data.

Panel A—Three-dimensional presentation of the dose rate dependent microdosimetric model Equation (1a) estimation of the variation of Relative Dose Response with both dose and dose rate. Fit to data for activation of adaptive response in HeLa x Skin cells from Elmore et al (2006). Panel B—For a comparison, the three-dimensional presentation of the dose and dose-rate dependent data for challenge dose adaptive response from Shadley and Wiencke (1989) fit to the Microdose Model. Panel C—graph illustrating the dose response behavior given in 3-D Panel A. Upper right, high dose and dose rate is region where radiation damage dominates with increasing dose from both reduction in dose rate sparing with increasing dose rate and increase in chromosome damage from increased dose. Lower left, low dose and low dose rate is region where no adaptive response reduction is present because the respective thresholds, S + 1 and dS/dt + 1, have not been reached. The illustration is more explicit than the Figure 3C of Leonard (2007b), here showing the thresholds. Panel D—To evaluate the Fs and Fd thresholds, we show their Poisson accumulation curves versus Time Between Nucleus Hits in minutes per Hit, similar to Figure 2, Leonard (2007b). The point where the accumulations curves reach the value 0.5 mean value provides the mean time between nucleus hits to activate the thresholds. We obtain for the Fs spontaneous AR protection, 20 minutes between hits and for the Fd primer dose direct damage a more frequent, 9 minutes between hits. The data is for the lowest dose of 1.0 cGy exposure from Figure 2A but the results are the same for the 10.0, 50.0 and 100 cGy graphs.
3.2 Analysis of Low LET Cell Dose Response Exhibiting Both Bystander and Adaptive Response Effects
Above we show a microdosimetry model, Equations (35) and (35a), providing a relative risk dose response relation encompassing both the bystander and adaptive response effects. We will apply this AR-BE Microdose Model first to the recent low LET in vivo exposures of Hooker et al (2004).
3.2.a. Analysis of the Hooker et al Low LET Dose Response Data Containing Bystander Effect and Adaptive Response
Figure 6 provides the dose response data of Hooker et al (2004) for broad-beam whole body exposure of pKZ1 mice for a range of doses from 1 μGy to 2.0 Gy with 250 kVp X-rays. The mice were then sacrificed and the inversion frequencies in the mice spleen were determined and compared to controls. The Figure 6 data are the mean inversion frequencies normalized to the control frequencies for each data point. In our analysis, we have applied the composite Bystander and Adaptive Response Microdose Model given by Equations (35) and (35a). Shown in Figure 6A are the separate components of the data delineated for our analysis. To understand separately the bystander and the adaptive response behaviors, we show the bystander behavior region in Figure 6B, the adaptive response behavior region in Figure 6C and the high dose Direct Damage behavior region in Figure 6D. The scales are also given in Specific Energy Hits per Nucleus so that the effect of the radiation induced charged particle traversals can be seen. The value of Specific Energy per Hit = <z1> = 0.07 cGy per hit (private communication, Hooker 2007). The solid black curve in all four Figure 6 panels is the model net best fit to the data—solid black circles. In Figure 6B, the net bystander damage consists of the bystander accumulation function (green solid curve) given by σ[1 – Exp(–kD)] which exhibits the growth of the damage in the bystander neighbor cells and the depletion function (dashed curve) given by Exp which represents the depletion of the bystander signaling cells as dose is increased and the directly hit signaling cells are dissipated. The solid red curve shows the net bystander response given by the product of the growth and depletion
  . The following are the values of the bystander parameters for this best fit: σ = 2.25 inversions, k= 1900 Hit−1 and
  with q= 1.00 Hit−1 and ξ = 1.0. For the parameters as defined by Brenner et al (2001), they explicitly note that the model requires that σ > γ, k ≥ 1, and q ≤ 1 and we require ξ ≥ 1. These conditions are satisfied for our analysis of the Hooker et al (2004) data.

Analysis with the AR-BE microdose model of Bystander and Adaptive Response Effects from the data of Hooker et al (2004) for 250 kVp X-ray dose response of chromosome inversions in pKZ1 mice spleen cells. Panel A data and fit of model showing the 3 regions of dose response. Panel B—Details of the analysis of the Bystander Effect behavior. Shown are the “Hit” probability transition function ((green), the “Depletion” transition function (black dashed), the Net Bystander curve (Red), the Bystander Ratio (purple) and the zero dose spontaneous level (yellow). Panel C—Shown is the Adaptive Response behavior. The red curve is the Poisson Accumulation Function for activation of the AR. The blue curve is the Direct Damage component and the yellow line is the normalized zero dose spontaneous level. Panel—Shown is the high dose Direct Damage region domination.

Shown are data from the Columbia University microbeam facility for 5.3 MeV alpha particles (Panels A and C) and the broad-beam exposures of Nagasawa and Little (1999). Panels A and B—We show the Bystander Damage and the Direct Damage components to the total dose response and the Bystander Ratio (Bystander/Direct). Panel C—We show the Zhou et al (2003) data for their study of Adaptive Response effects on the microbeam induced Bystander Damage. The Bystander Damage was normalized to damage without X-ray priming dose. We show the reduction of the Bystander Damage aqs a function of priming dose, showing an Adaptive Response induced radio-protection. As a comparison we shown the zero dose spontaneous normalized Adaptive Response reduction data of Azzam et al (1996) showing nearly the same degree of AR protection.
In Figure 6C we show the adaptive response behavior contributing AR reduction to the Net Dose Response. The solid red curve is the Poisson accumulation function, Fs, that produces the adaptive response protection transition for the spontaneous damage protection. The net adaptive response reduction in the zero dose natural spontaneous damage is caused by the Poisson transition of F s and given by [1 – Pprot–s∞ Fs(M,S)] where we obtained Pprot–s∞ = 0.61 and S= 1 such that S+ 1 = 2 ± 1 minimum Hits. Finally, in Figures 6C and 6D panels as the solid blue curve, we show the Direct Damage induced dose response given by damage [1 – Pprot–pr∞ Fr(M,O)] Fd(M,U)αM<z1>/P spo . Best fit values are: α/P spo = 0.153 cGy−1, Pprot-pr∞ = 0, Fpr= 1.0, Fd= 1.0, and <z1> = 0.07 cGy per hit. The best fit parameter values are given in Table 1.
3.3. Examination of High LET Bystander Effect Deleterious Damage and Adaptive Response Radio-protection From Alpha Particle Exposures
We here present the analysis of the purely Bystander Effect alpha particle data of Miller et al (1999) and Nagasawa and Little (1999) and the BE (micro-beam) and AR (priming X-rays) study of Zhou et al (2003).
3.3.a. Broad-beam Alpha Exposures at the Columbia University Micro-beam Facility
To compare the relative dose response of microdose single alpha particle traversals through 10T1/2 cell nuclei to the dose response from broad-beam alpha exposures, Miller et al (1999) provided the in vitro broad-beam dose response data shown as Figure 7A herein, with the zero dose spontaneous, control levels subtracted. We have fit the data to the AR-BE composite model as shown with the solid black line in the Figure (fit to 5.9 %SD). There was no evidence of an Adaptive Response radio-protection. The fit was performed using both a linear and a linear-quadratic Direct Damage response with the linear-quadratic providing a better fit (5.9 to 12.9 %SD, respectively). The values of the model fit parameters are given in Table 1 for both cases. All bystander effect parameters are in microdose units (per hit not cGy−1) in Table 1. We show the separate BaD model Direct Damage and Bystander Damage components. A Specific Energy Hits per Nucleus scale is also provided, clearly showing a bystander effect.
3.3.b. Broad-beam 238Pu Alpha Particle Exposures of Nagasawa and Little (1999)
Nagasawa and Little (1999) measured the induction of HPRT mutations in CHO cells exposed to very low fluences of 238Pu alpha particles in vitro for absorbed doses ranging from 0 (controls) to 10 cGy. They calculated the Specific Energy Deposition per Nucleus Traversals, <z1>, to be 17.4 cGy per hit. Figure 7B provides their dose response data with the zero dose control value subtracted. As with the Miller et al (1999) data, we have fit the data to the AR-BE microdose model. Again there was no evidence of Adaptive Response reduction from radio-protection. Comparing the linear and linear-quadratic fits for the Direct Damage, we obtained a slightly better linear-quadratic fit (8.0 to 8.9 %SD, respectively). We again show the Direct Damage and Bystander Damage components from the model. The fit parameters are given in Table 1. We show a separate scale for Specific Energy Hits per Nucleus.
3.3.c. Examination of Effect of Adaptive Response Priming Doses of Microbeam Induced Bystander Effect
A large amount of investigations have found that low doses of Radon alpha particles induce significant bystander damage. This, from micro-beam facility studies, by injecting individual targeted cell nuclei with alpha particles one alpha particle at a time. The individual bystander dose responses for the injection of up to 20 Radon alpha particles per nucleus have been studied. This study of injection of 20 alpha particles per cell is of no human interest. More realistically to study possible adaptive response effects on alpha induced bystander damage, at the Columbia University micro-beam facility, Zhou et al (2003) injected a population of AL human-hamster hybrid cells, each with one alpha particle. To examine any adaptive response effect, they performed a second series of exposures where the populations were pre-exposed to X-rays 4 hours prior to the micro-beam alpha particle injections. Our Figure 7C, from their Figure 6A, provides the data for priming doses of 0.02, 0.10 and 0.50 cGy of X-rays showing a significant AR reduction of about 0.60 from the priming dose X-rays prior to the challenge dose single alpha particle each with a Specific Energy per nucleus Hit, <z1>, of about 9 cGy. Using the <z1> value for the priming dose X-rays, we show the Poisson accumulation function, Pchal, for the induction of AR. We show also the Adaptive Response behavior measured by Azzam et al (1996), and analyzed as Figure 2B in Leonard (2007a), for priming dose AR protection of spontaneous chromosome damage for 10T1/2 density inhibited cells showing the same level of AR protection.
3.4 Ko et al (2004) Mammography Data—An Example of Protective Bystander and Adaptive Response Radio-protection and High Dose AR Retention
3.4.a. Determination of an Effective Value for the Microdose Parameter Specific Energy Deposition (Hit) per Nucleus Traversal, <z1>, for 30 kVp X-ray Radiation
As noted above, the size of the HeLa x Skin nucleus was estimated by Miller et al (1999) to be 11.9 μm. Using a Linear Energy Transfer (LET) value of 0.37 keV per μm for the 137Cs 0.667 Mev gamma ray source used by Redpath et al (1998, 2001), we obtained a <z1> value of 0.05 cGy per nucleus hit in the analysis of their work (Table 1, Leonard 2007a). Here for the Ko et al (2004) data, the target cells are the same but the LET is very different for the very low energy photons from the mammography X-rays. Also noted above, the recent LET measurements by Kellerer (2002) for these very low energy mammography X-rays provides the best, most direct, relative data. He determined the Frequency Mean Photon Energies from the X-rays to be about 20 keV and the LET of these electrons to be 4.34 keV per μm. If we use this LET value for the 30 kVp X-rays reported to be used by Ko et al (2004), the <z1> would be the LET ratio relative to the 137Cs value i.e. <z1> = 0.05 cGy hit−1 × (4.34 keV μm−1)/(0.37 keV μm−1) = 0.638 cGy hit−1. In using this value here, we again place an uncertainty of about ± 45% such that we let <z1> = 0.638 ± 0.29 cGy hit−1 for our analysis.
3.4.b. Composite Microdose Model Fit to Ko et al Mammogram X-ray Data
The Ko et al (2004) mammography X-ray dose response data has achieved considerable significance since it verifies a reduction in the spontaneous frequency of chromosome transformations (Redpath 2006). In Figure 8A, we show, with their Standard Error (SE) bars, that Ko et al (2004) report unusually high accuracy in their seven primer dose dependent data points. The data, as well as conclusively showing AR radio-protection, strongly support a protective Bystander Effect for the very low dose, 0.054 cGy, data point and possibly an AR protection retention for the 5.4, 10.8 and 21.6 cGy high dose data points. Figure 6, used for the microdose analysis of the Hooker et al (2004) data has illustrated the three dose response regions in the case of a protective Bystander behavior. As Figure 8B, we show the possible three regions, Bystander Region, Adaptive Response Region and the Direct Damage Region, for the Ko et al (2004) data. Using Equations (35) and (35a), we have fit the composite AR-BE Micro-dose Model to the Ko et al (2004) data. The iterative least squares best fit provided parameter values of σ = −0.50, k= 100 hit−1, q= 2 ± 1 hit−1, Pprot-s∞ = 0.39, S+ 1 = 2 ± 1 hits, <z1> = 0.638 cGy hit−1 and α/P spo = 0.034 cGy−1 per transformation. Note that σ is negative to provide the protective Bystander Effect. The fit, shown as Figures 8B and 8C, is to ± 6.13 %SD.
3.4.c. Retention of Adaptive Response Radio-protection at High Primer Dose Levels
To obtain an estimate of the amount of Adaptive Response protection that is retained at high dose where deleterious Direct Damage dominates, we used the most recent version of the Method of Maximum Likelihood Estimator (MLE) for linear best fit given by Kellerer (2003) specifically for fitting linear or linear-quadratic dose response data. For our linear case, this involves the minimization of the weighted sum, C, of the data set residuals, i.e.

where Nis the number of dose and transformation frequency data sets and s Yi are their standard errors. The minimization is obtained by setting the partial derivatives with respect to the parameters, a and b, equal to 0, i.e.

and

and finding the minimization values of a and b. The best fit values obtained by MLE are a= 0.71239 per spontaneous transformations and b = 0.026533 cGy−1 per spontaneous transformation and the standard errors are s a = 0.0006412 and s b = 0.00002385.
In Equation (4) above then, we have a = [1 – Pprot–s–pr∞] = 0.712392 ± 0.0006412 and b = [α/Pspo] [1 – Pprot–s–pr∞] = 0.026533 ± 0.00002385 and thus with Pspo = 8.07 × 10⁻⁵ zero dose transformations, α = 0.3006 × 10⁻⁵ cGy−1. Figure 8D provides the resolved primer dose Direct Damage linear curve (solid line) and the extrapolation to the origin (dashed line), intercepting at the value of 0.71. We thus estimate that an Adaptive Response protection of about 29% is retained at high dose where the deleterious primer dose Direct Damage dominates. Further, from the fit of the MicroDose Model in Figure 8B and 8C, there is a factor of about 0.50 protective Bystander reduction (σ = −0.50) and about 39% Adaptive Response radio-protective reduction in dose response in the AR Region. Thus, we show the rare instance of conclusive evidence of protective Bystander behavior for the low photon energy mammography X-rays, Adaptive Response radio-protection behavior and AR protective retention at high dose levels, the values being 39% and 29% respectively indicating within the accuracy of the data that some of the AR protection is dissipated at high dose levels but a significant amount is still retained up to the highest dose of 21.6 cGy.
4. ANALYSIS
4.1 Application of Microdose Model to Elmore et al (2006) Data
4.1.a Hit and Hit Rates for Activation of Adaptive Response
As noted above using the best fit parameters in the dose and dose rate dependent AR microdosimetry model, we provide as Figure 5A a three dimensional graph (dose and dose-rate) of the Elmore et al (2006) data. The overall fit for all the data points is to ± 21.7 %SD. As a basis of comparison, as Figure 5B, we show the three dimensional graph for the dose and dose-rate response from 150 cGy challenge dose in human lymphocytes from Microdose Model analysis (Leonard 2005, 2007b) from the Shadley and Wiencke (1989) data, with similar dose and dose rate dependent adaptive response radio-protective behavior. It is quite significant that our model analysis here, again as was similar to our earlier works, shows that only one radiation induced charged particle traversal through the cell nucleus is sufficient to activate the adaptive response. Figure 5C provides a sketch showing the low dose and dose rate regions where the adaptive response protection is in transition and the low regions where the thresholds occur. We show in Figure 5C the region where the low middle regions where AR is fully operative. At the higher dose and dose rates, we show the region where the AR becomes dominated by the increased damage by both a decrease in the dose rate sparing as dose rate is increased towards acute rates and by the increased dose producing greater damage, from the conventional linear-quadratic dose response effect (Kellerer and Rossi 1972). For the analysis of the Shadley and Wiencke (1989) prior work it was only possible to set the lower limit as S = 1 ± 1 thus S + 1 = 2 ± 1 hits whereas for the Elmore et al data analyzed here a value of S = 0 thus S + 1 = 1 hit is by far the best value as seen in Figure 3B. To obtain the Specific Energy Hits and Hit Rates per Nucleus scales for the graphs, it is necessary to divide the dose and dose rates by <z1> = 0.638 (the units of <z1> are cGy per hit). We have done this and provide the scales for Figures 3 and 4. The threshold dose and dose rate for initiation of the adaptive response are both found to be independent of both dose and dose rate, respectively, and are seen to be the same F s and F d curves on the graphs. They are S<z1> = 0.64 ± 0.19 cGy dose and dS/dt<z1> = 0.102 ± 0.030 cGy min−1 dose rate for activation of the adaptive response protection for the spontaneous damage and U<z1> = 2.60 ± 0.78 cGy dose and dU/dt<z1> = 0.26 ± 0.08 cGy min−1 dose rate for the threshold for induction of the direct radiation damage, respectively. These values for S and dS/dt are much higher than the Redpath et al (1998, 2001) values for the 137Cs irradiations on the same cell species. This can be attributed to the fact that the low energy, high LET 125I photons deposit a much greater amount of energy per individual hit i.e. <z1> much greater, and here secondly and conclusively only one hit activates AR for HeLa x skin cells.
4.1.b. A Dilemma for the Dose Rate Threshold if Only One Hit Activates Adaptive Response
The dilemma is—How can there be a dose rate threshold if only a single specific energy hit to the nucleus activates the Poisson accumulated adaptive response radio-protection? To show the dose rate Poisson accumulation threshold functions, F s and F d , for the priming dose AR protection and the deleterious priming dose damage, we provide Figure 5D, similar to Figure 2 of Leonard (2007b). Figure 5D shows, for the dose rate, the maximum time between hits that will, with Poisson hits, trigger the activation of the AR protection and the damage. We see that about 20 minutes between hits (3 hits per hour) will produce AR and about 9 minutes between hits (6.7 hits per hour) will begin to cause the damage. These are at the mean Poisson accumulation value of 0.50 on the graph. These values are the same for all doses as can be seen from the initial curves in Figures 3A through 3D. We noted in prior work the fact that a very low number of hits activates AR, but we see a dose rate effect that is curious since, certainly, to have a dose rate effect for the threshold there must be more than one hit. The dose rate effect is clearly present by comparing Figures 4A and 4B where the AR reduction is only about 0.14, below the control, zero dose spontaneous level, for the dose rate of 0.019 cGy min−1 as compared to about 0.42 for the higher 0.047 cGy min−1 dose rate. It is important to note that the shapes of the AR transition regions from 0 to 0.04 cGy min−1 in all four Figure 4 dose rate graphs are almost exactly the same. The dilemma may simply be from the artifice that, in graphing the data, there can be no dose rate effect with zero dose and the dose rate curve must reflect a Relative Dose Response of unity for zero dose rate as well as dose. Again as in all the prior data analyzed, we see that the initiation of the primer radiation dose induced deleterious direct damage requires greater hits than the single or several hits needed to activate AR, thus a threshold for the direct damage (see Figure 5, Leonard 2007a). New data for HeLa x Skin dose response (private communication Dr. Redpath) show AR protection at even much lower dose rates than used here. This may suggest that the actual dose rate threshold for activation of AR could be simply one hit per cell cycle but in perhaps a specifically sensitive mitotic phase. We have shown in Figure 1C of Leonard (2007b) that AR protection fading dose does not begin until about 38 hours, the cell cycle time for human lymphocyte cells.
4.1.c. Comparison of the Elmore et al (2006) 125I and Redpath et al (2001) 137Cs Exposures to the Ko et al (2004) Mammogram X-ray Spontaneous Data
Dr. Redpath's research group (Redpath and Antoniono 1998, Redpath et al 2001, 2003, Ko et al 2004, Elmore et al 2006, Redpath and Elmore 2007), to date, has provided the most abundant and accurate data relative the Adaptive Response radio-protection from ionizing radiations. Further, the data are very significant because they clearly show that there is a reduction in cancer risks of about 50% in spontaneously produced endogenic cellular damage from the Adaptive Response radio-protection that is induced by very small primer radiation doses. The data of Ko et al (2004) for mammography X-rays analyzed here impacts on millions of American women and hundreds of millions of women world-wide who receive two or more breast exposures annually in the cancer diagnosis program.
We will show below that the mammogram (Ko et al 2004) and diagnostic (Redpath et al 2003) X-ray data are the only data sets that conclusively shows a protective Bystander behavior. With the Microdose Model, it is important to compare the results for the other different sources used by them to study AR. The value of 0.638 cGy per hit for the mammography X-rays for <z1>, the mean Specific Energy Deposition per Radiation Induced charged particle traversal through the HeLa x skin cells, is very large as compared to the <z1> values for the low LET 137Cs and 235 MeV protons (Elmore et al 2005). We could perhaps classify the LET of 4.34 keV per μm determined by Kellerer (2002) for the mammography X-rays as an intermediate LET value and the <z1> value of 0.638 cGy per Hit as an intermediate <z1> value between large values for high LET radiation (i.e alpha particles—10–20 cGy per hit) and the smaller values for low LET radiations [from 0.02 to 0.20 cGy per hit, see Table 1, Leonard (2007a)]. This means that the very first single charged particle traversal occurs at a much higher Primer Absorbed Dose. The chosen lowest exposure dose then has a very large influence in what can be observed from the laboratory in vitro measurements. For the Ko et al (2004) mammography measurements the lowest dose was wisely chosen to be 0.054 cGy. Comparing this to the <z1> value of 0.638, the Ko data (2004) was over a factor of 10 lower (as shown in Figures 8A and 8B) and well within the Bystander Effect region, hence a Bystander Effect could be and indeed was observed. The simplest way to show this is with the ratio of the lowest dose data point divided by the <z1> value yielding the Poisson distributed minimum observable Specific Energy Hits. This means an average of only 0.054 cGy/0.638 cGy Hit−1 = 0.0846 Hits have occurred, well within the Bystander Region for the mammography X-rays. The Redpath et al (1998, 2001) 137Cs with the lowest data point at 0.1 cGy (<z1> = 0.05 cGy per Hit-0.1 cGy/.05 cGy Hit−1 = 2 Hits per cell), the Elmore et al (2005) 232 proton with the lowest data point at 0.5 cGy (<z1> = 0.06 cGy Hit−1–0.5 cGy/0.06 cGy Hit−1 = 8.33 Hits per cell), the Azzam et al (1996) 60Co with the lowest data point at 0.1 cGy (<z1> = 0.04 cGy Hit−1 −0.1 cGy/0.04 cGy Hit−1 = 2.5 Hits per cell) and the Elmore et al (2006) 125I lowest dose data point was at 1.0 cGy (<z1> = 0.638 cGy Hit−1 −1.0 cGy/0.638 cGy Hit−1 = 1.57 Hits per cell), are all above the single hit AR Poisson threshold within the Adaptive Response Region and could not show any Bystander Effect behavior. The Redpath et al (2003) diagnostic X-rays lowest dose data point was at a very low first data point of 0.04 cGy (<z1> ≈ 0.40 cGy Hit−1 −0.04 cGy/0.40 cGy Hit−1 = 0.10 Hits per cell) and within the Bystander Region by a factor of 10. We note in Figure 1 and Table 1 of Redpath et al (2003) that the dose response exhibits a double “U” type behavior consistent with that seen for the mammography X-ray data where we conclusively show protective Bystander and Adaptive Response effects in Figures 8A through 8C. Thus the 60 kVp diagnostic X-rays show a protective Bystander behavior, also, as should be expected. It is most likely for the 125I low energy photons, that if the Elmore et al (2006) lowest dose was administered at 0.054 cGy, a Bystander Effect would have been seen due to the high <z1> value close to that of the mammography X-rays. In our analysis (Leonard 2005, 2007a), we show no evidence of either a protective or deleterious Bystander Effect for the Redpath et al (1998, 2001) 137Cs data. We must qualify our synopsis, however. It is not certain, that even if the lowest 137Cs exposure had been chosen well below the <z1> value of 0.05 cGy per Hit, whether a Bystander behavior would have occurred. Bystander Effects have only consistently been observed for high LET alpha particles and the observed protective Bystander Effect for the mammography data may be because the LET is what we have above referred to as “intermediate.” The reason then that the Ko et al (2004) mammography and the Redpath et al (2003) diagnostic X-ray data observed a protective Bystander Effect could be that the amount of energy delivered to each cell was large enough to exceed a BE threshold (if there is such a thing) that the alphas also greatly exceed with their <z1> values between 10 and 20 cGy per Hit. So, at this juncture, we do not know if, say an exposure of 0.01 cGy of 137Cs, will induce a protective Bystander Effect in the HeLa x skin cells. It would be interesting to test this scenario. The same considerations apply for the 232 MeV proton data where the lowest dose point was 0.5 cGy and our estimate of <z1> = 0.06 cGy per Hit—no chance of observing any BE behavior. The same is also true of the many other Adaptive Response effect data sets, such as that of Azzam et al (1996), that we have studied (Leonard 2005, 2007a, 2007b, 2007c) where the experimentalists have failed to use sufficiently low doses.
Others have mistakenly claimed a Bystander Effect in the Redpath et al (1998, 2001) 137Cs data (Schollnberger et al 2007, Schollnberger and Ecki 2007) but our Microdose Model analysis clearly shows, from the 137Cs data that the sub-spontaneous response is simply the expected Adaptive Response radio-protection in the AR Region.
4.1.d. Retention of Adaptive Response Radio-protection at High Primer Dose
In Figure 8D, we conclusively show that, at high primer dose levels, the Adaptive Response radio-protection of about 29% is retained. This was determined to a high degree of accuracy using the Method of Maximum Likelihood Estimator (MLE) for fit of linear equations. In examining the Redpath et al (1998, 2001) 137Cs Adaptive Response data using MLE, we found, also to a high degree of accuracy, that the AR was totally dissipated by the high priming dose radiation. One reason for the difference in the results, in analyzing the high dose region, could be that the three highest dose data points available to evaluate the mammography X-ray data are much lower than the three highest for the 137Cs exposures and, at higher doses, dissipation would be observed. A second possible reason for these two divergent results could be the large difference in the LET's and the <z1>'s. A third reason could be the fact that the 137Cs high dose data was obtained at large differences in exposure dose rates for the individual data points. The 30 and 50 cGy data used 4.13 cGy min−1 and the 100 cGy data was obtained at 1.61 Gy min−1. The dose rate AR data of both Shadley and Wiencke (1989) [see Leonard 2007b)] and the Elmore et al (2006) show a very large dose rate effect for induction of AR.
We mentioned the Figure 2 of Mitchel (2004) that shows an extrapolation to the origin for the 137Cs data, as we have done. Dr. Mitchel (2004) notes that the data and his Figure 2 “suggest the existence of a transition dose point between 10.0 and 30.0 cGy, below which protective effects, including protective bystander effects, predominate, and above which detrimental effects overwhelm the protective effects.” In the extensive work of him and his colleagues, studying the Adaptive Response protective behavior exhibiting increasing latency of tumor development in mice (Mitchel et al 2004), they have found that an AR priming dose of 1.0 cGy is effective in increasing the time before development of some carcinogenesis but a 10.0 cGy priming dose is less effective or not effective at all, implying an upper threshold for the loss of protection between 1.0 and 10.0 cGy (Mitchel 2004, Mitchel et al 2004). We have found that mammography X-rays retain the protection up to 21.6 cGy in the region where the deleterious primer dose Direct Damage begins to dominate. This is not so for the 137Cs data but here we show for up to 100 cGy. Of significance is the most recent analysis of the Adaptive Response studies cited above, by Redpath and Elmore (2007) shows, in the analysis of the high background and low background spontaneous data sets that the extrapolation to the origin of the high dose Direct Damage values above 10 cGy up to 85 cGy yields origin intercepts well below the zero dose spontaneous level indicating retention of the AR protection [see Figure 1, Redpath and Elmore (2007)]. It is then important to examine this behavior more thoroughly. A separate study is underway to specifically analyze the AR retention behavior with the Microdose Model and the MLE method for the number of other AR data sets already examined in earlier works (Leonard 2005, 2007a, 2007b, 2007c).
4.1.e. Examination of Adaptive Response And Direct Damage “Thresholds”—Range of Adaptive Response an Important Health Risk Factor
In Figure 9, we examine the relative Bystander, Adaptive Response and Direct Damage Regions first shown in Figures 6 [for the Hooker et al (2004) data] and then in Figure 8 [for the Ko et al (2004) data]. We examine the low photon energy mammography X-rays and the relatively high photon energy 137Cs gamma rays, respectively. We compare the two data behavior by plotting them in terms of Primer Absorbed Dose in Figure 9A and then in terms of Primer Specific Energy Hits per Nuclei in Figure 9B. We show in Figure 9A that, in spite of the very large differences in LET and <z1> values, the high dose Direct Damage components very nearly coincide. This means that in both cases the primer exogenic radiations induction of the radiation damage (neoplastic transformations) are independent of the large differences in the energy deposited per individual hit but rather seems to be solely dependent on the total energy being enough to cause the transformations, at perhaps a threshold, irrespective of how it was deposited from the number of Specific Energy Hits. In Figure 9B, we show, as we have for a number of other data in our other work, that the beginning of the Adaptive Response radio-protection occurs from single Specific Energy Hits and is likewise independent of the Primer Absorbed Dose, simply dependent on the minimum single Hit. We have shown this to be true, in other work, for even the very low values of <z1> where no more than 0.04 cGy of Specific Energy [for the 60Co gammas—see Table 1 and Figure 2B of Leonard (2007a) for the Azzam et al (1996) AR measurements] is sufficient to activate the AR protective mechanisms. For such a small amount of energy the cellular sensory mechanism must be extremely sensitive to perhaps either perceivingly sense the disruption of the nucleus membrane, the very small amount of increased Reactive Oxygen Species occurring from the single tracks and/or the production of DNA single strand breaks. For specific cell and radiation quality conditions, exposures involving low LET and small <z1> values will have wide Adaptive Response Regions [as is the case for the Redpath et al (1998, 2001) 137Cs] and exposures with intermediate or high LET and <z1> values will have narrow Adaptive Response Regions [as is the case for mammography X-rays and also the low energy 125I photons in the Elmore et al (2006) exposures]. We can see the narrow AR region of the Elmore et al (2006) data in the 3-D Figure 5A.

Using the Microdose Model that encompasses Bystander and Adaptive Response behavior (Leonard 2007c), the Ko et al (2004) dose response data for mammography 30 kVp X-rays is examined. Panel A—The data points and standard errors are presented, showing the wide range of doses measured and the high degree of accuracy. Panel B—Division of the dose response into dose regions. The boundary between the Bystander Region and the Adaptive Response Region is determined by the energy deposition value for a single radiation induced charged particle traversal, given by <z1> = 0.638 cGy per hit. The Direct Damage Region is determined to be at the dose where the high priming dose begins to dominate. Panel C—Fit of the Microdose Model to the Ko et al (2004) data to ± 6.13 %SD. Shown is the protective Bystander distribution in purple, the Poisson accumulation of single hits to active the Adaptive Response in red, and the linear responding Direct Damage in green. Panel D—Application of the Method of Maximum Likelihood to fit the linear Direct Damge behavior for dose data points 5.4, 10.8 and 21.6 cGy. Extrapolation to the origin as provided by Equation (4) provides the retained Adaptive Response level of 0.71 or 29 % AR protection at high dose. This would imply a retention of [0.29/0.39] = 0.75 or 75% at 21.6 cGy.9.

Comparing the Ko et al (2004) mammography data and the Redpath et al (2001, 2003) 137Cs data. Panel A—the simultaneous plot of the two data sets and Microdose Model fits as a function of Primer Absorbed Dose. We see that the two high dose Direct Damage curves very nearly coincide even though the LET's and <z1> values are very different, indicating the the total energy deposited to the cells dictates the priming dose induced high dose Direct Damage response, not the Specific Energy for each hit. Panel B—Plot of the data and fits as a function of accumulated Primer Specific Energy Hits per Nuclei. We see that, as determined from our Microdose Model analysis, that a Poisson distributed mean of one single Specific Energy Hit activates the Adaptive Response protection. This means that Adaptive Response activation is solely dependent on a single Specific Energy Hit irregardless of the size of the energy in the deposition and independent of the Primer Absorbed Dose.
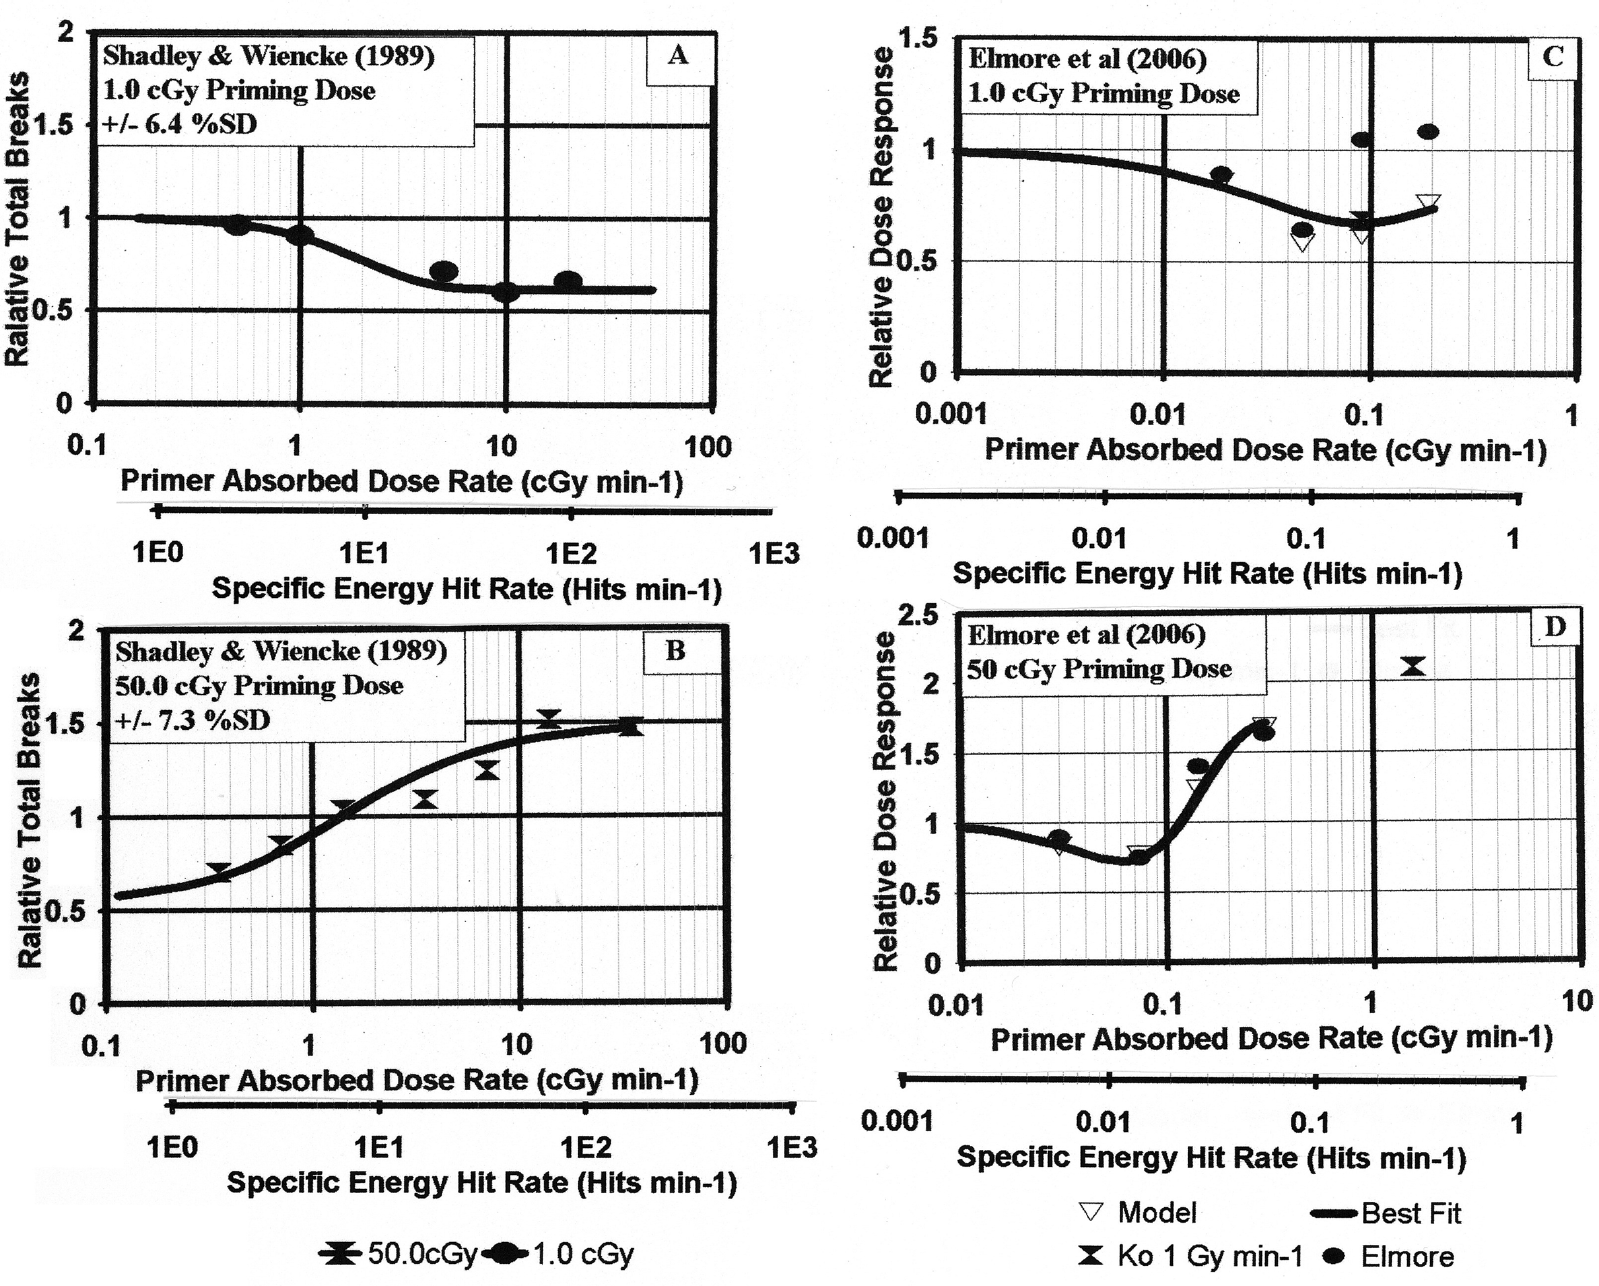
A comparison of the priming dose rate dependent AR behavior for the Shadley and Wiencke (1989) AR challenge dose chromosome damage study for human lymphocytes and the Elmore et al (2006) AR spontaneous chromosome damage study for HeLa x skin. Panels A and B—The dose rate dependent data of Shadley and Wiencke (1989) for 1.0 and 50 cGy priming exposures fit to microdose model (see Figure 5, Leonard 2007b). Panels C and D—The dose rate dependent data of Elmore et al (2006) for 1.0 and 50.0 cGy priming exposures fit to model. The shapes of Panels A and C are similar for the low priming dose where the adaptive response protection transition is operative. There is however about a factor of 60 difference in dose rates for the same behavior. The shapes of Panels B and D for the high priming dose are similar showing the reduction in dose rate sparing in both as dose rate is increased towards acute. The Panel B asymptotic behavior of the two highest data points reflect that their dose rates are acute with respect to dose rate sparing. This is not true for the Panel D data. We show the Ko et al (2004) 1.0 cGy min−1 value showing this to be an acute value as far as dose rate sparing for the HeLa cells. The model fit values of the repair rate constants, ε ea , in the dose rate sparing function are 0.09 min−1 and 0.01 min−1, respectfully for the Shadley and Wiencke (1989) and the Elmore et al (2006) fits. The smaller the value of ε ea the more rapid the high dose response approaches the acute level, as is the case.
Mourad (2005) provides dose distribution data accumulated by the U.S. Food and Drug Administration's Division of Mammography Quality and Radiation Program showing an average of 0.1518 Rad with a standard deviation and coefficient of variance of 0.0365 and 0.23 respectively. The net range was from 0.057 to 0.298 Rad (1 Rad = 1cGy). This is below the Poisson “threshold” for the mammogram and diagnostic X-rays in HeLa x skin. With a newly developed low dose Sectr MicroDose Mammography System in Sweden, based on direct photon counting, Hemdal et al (2005) report a very low range of Average Glandular Dose (AGD) from 0.021 to 0.028 cGy, which is in the protective Bystander Region of Figure 8B.
4.1.f. Comparison of the Dose Rate Dependence of Adaptive Response for Spontaneous and Challenge Dose Chromosome Damage
Both the studies of the challenge dose and dose rate behavior of Shadley and Wiencke (1989) (Leonard 2007b) and the Elmore et al (2006) spontaneous dose and dose rate behavior analyzed here show a dose rate threshold for the initiation of adaptive response radio-protection. They both also show a dose rate sparing effect at the low dose rates which, as would be expected, in both cases is reduced as the dose rate approaches acute values. We have shown the 3-D comparisons in Figures 5A and 5B. Figure 10 provides a comparison of the two behaviors from the two investigative groups as determined from the microdose model fits. Panels 10A and 10B show the AR challenge dose chromosome damage behavior from the two dose rate sets of Shadley and Wiencke (1989) for human lymphocytes for constant priming doses of 1.0 and 50 cGy with then subsequent challenge doses of 1.5 Gy for both. These were provided as Figures 1A and 1B in the prior work (Leonard 2007b). Panels 10C and 10D are the same priming doses of 1.0 and 50 cGy (which are also shown here in Figures 4A and 4C) reported by Elmore et al (2006) but for HeLa x Skin cells and without a challenge dose thus showing AR behavior for spontaneous chromosome damage. For Shadley and Wiencke (1989), dS/dt=6.7 hits min−1 and dS/dt<z1> = (6.7 hits min−1) × (0.20 cGy hit−1)—(see Table 1, Leonard 2007a) = 1.34 cGy min−1. For Elmore et al (2006), dS/dt<z1> = (0.03 hits min−1) × (0.638 cGy hit−1) = 0.019 cGy min−1. There is thus a large difference in the dose rate thresholds for the two sets of data. One reason for this is the difference in the energy deposited per radiation induced charged particle traversal i.e. values of <z1>, a factor of 3.18. The lower energy, higher LET electrons from the 30 keV photons are much more effect than the 250 kVp X-rays in depositing energy for each “hit.” Even so this does not explain the factor of about 60 in the dose rate thresholds, which we are not at this time able to explain other than the fact that the challenge damage is exogenic radiation induced and the spontaneous is endogenic toxic induced. A number of investigators have premised that the type of DNA damage from spontaneous versus radiation induced is significantly different. In comparing the Panels 10B and 10D for the 50 cGy high priming doses, we see for both that the dose rate sparing effect modeled with the f(εeat) function is operative and the shapes of the curves are very similar. The dose rate sparing function only reaches its asymptotic value of unity at acute dose rates which here appears to be the case for the two high dose rate data points above 10 cGy min−1 in Figure 10B but not for the Elmore et al (2006) highest data point of 0.19 cGy min−1 in Figure 4D. Considering the Ko et al (2004) data point in Figure 10B, the dose rate sparing function appears to have reached unity at the dose rate of 1.0 Gy min−1. We show the estimated Relative Dose Response value of 2.1 for a dose rate of 1.0 cGy min−1 at 50 cGy dose obtained by extrapolating the Ko et al (2004) data (which we have given the same <z1> value). The values of the dose rate repair rate constants, ε ea , in the model fittings are significantly different i.e. 0.09 and 0.01 min−1 for the Shadley and Wiencke (1989) and the Elmore et al (2006), respectively to explain the differences in Figures 10B and 10C. The smaller the value of ε ea means a more rapid approach to the acute asymptotic response for the same exposure times and thus dose and dose rates.
4.2 Analysis of Hooker et al (2004) Adaptive Response and Bystander Effect Data
The bystander effect behavior in the Hooker et al (2004) is unique since, with low LET micro-beam facilities, no conclusive deleterious bystander behavior has yet been observed.
4.2.a. Some Uncertainties in the Hooker et al (2004) Data Points Noted by the Model Fit
The data in Figures 7A through 7D shows serious uncertainty created by the 20 μGy and 2 Gy data points. We show the error bars for both with good accuracy shown for the 20 μGy value and very poor accuracy for the 2 Gy value. Errors may occur in the determination of exposed dose, as well as in the magnitude of the biological “endpoint” response, thus affecting the location on the abscissa. Compared to other cellular dose response data the selection of dose data points is reasonably good. The data clearly shows that, to detect bystander effects, data need be obtained at orders of magnitude below the mean specific energy dose per hit, in their case 2.5 decades below the <z1> = 0.07 cGy per nucleus hit value as seen from the Specific Energy per Nucleus scales. It is relatively certain that the 20 μGy data point is an “outlier.” There are not enough data above the zero dose crossover dose to determine if the 2 Gy value is realistic and estimate the amount of AR retention in the high primer Direct Damage Region. For this reason in Figure 7A we made two high dose region fits in estimating the AR retention. With only two data points above the zero dose crossover value, linear extrapolation of the 10 cGy and 200 cGy data points provides an origin value of about 2.0 and extrapolation of the 1.0 cGy and 10 cGy points yields an origin value of about 0.5.
We also have concerns about the use of multiple dose rates to obtain the very large range of doses in the Hooker et al (2004) exposures. In our earlier analysis of the dose rate dependent work of Shadley and Wiencke (1989) (Leonard 2007b) and the work of Elmore et al (2006) here, we show a very large effect of dose rate on the thresholds and transitions of Adaptive Response that would impact on the Hooker et al (2004) data.
4.2.b. Estimate of Bystander Factor for Hooker et al (2004) Data
In the micro-beam facility single particle track studies, Randers-Pehrson (2001) has raised concerns about the appropriate representation of microdosimetry bystander damage level radiation deposition and the need for a possible new dose quantity, specific dose. To quantify a magnitude for the bystander signaling and reaction by neighbor cells, Brenner et al (2001) in formulating the BaD model suggested the bystander factor to be represented by the initial slopes of the bystander response and the direct damage response, the responses given by σ[1 – Exp(– , respectively. Since there are only enough high dose data to estimate αD/<z1>, the bystander factor (BF) would then be σ
4.2.c. Estimate of the Adaptive Response Protection and Activation Threshold Minimum Specific Energy Hits for Hooker (2004) Data
We find the Adaptive Response protection of the naturally occurring, spontaneous spleen inversions for in vivo exposure of pkZ1 mice spleen to be 61% (Pprot—s∞ = 0.61). The best fit value of the Poisson accumulation factor for activation of the protection was between S = 0 and S = 1.0 and thus the minimum mean Specific Energy Hits to activate the AR is S + 1 = 1.5 ± 0.5. The dose range of the protection extends from about 0.01 to about 4.0 cGy.
4.3 The Micro-beam Facility High LET Bystander Effect Data
Both the micro-beam data of Miller et al (1999) and Nagasawa anf Little (1999) show conclusive bystander behavior. It is significant to note that neither data show a strong non-monotonic “U” shaped behavior as premised by our Figure 1 reproduction of the Brenner et al (2001) Figure 4. In fact we know of no published data showing high LET bystander effects that exhibit a non-monotonic “U” shaped behavior, even the numerous micro-beam data. The induction of adaptive response behavior with the priming dose of X-rays, we feel is significant, for the Zhou et al (2003) data, since it verifies that the bystander effect is strongly affected by AR. Thus, a “U” shaped response would be likely if there are low LET radiations present in conjunction with alpha particle radiation, such is indeed the case for Radon and its progeny where along with the alphas there are 14 gamma rays and 5 beta particles in the decay to the quasi stable Polonium-210. Such “U” shaped dose response data are seen in the Pohl-Ruling (1979, 1988) and the Brooks et al (1990, 1994) Radon data where the progeny betas and gammas were present to activate adaptive response. At even lower domestic and workplace Radon levels, and in the presence of low LET background radiations a greater “U” shaped behavior may be present.
4.4. Model Quantization of Key BE and AR Parameters
The AR-BE Microdose Model is useful in evaluating the significance of the deleterious (or protective) bystanders effect and the protection of adaptive response. Just as Randers-Pehrson (2002) noted the ambiguity in defining microbeam dose, we see several ways that the magnitude of the bystander effect can be quantized (bystander factor = BF). Brenner et al (2001) has proposed the use of the initial slopes obtained from the BaD model i.e. the slope of the Bystander Damage to slope of the Direct Damage given by BF = σk/νq. This would provide the relative bystander effect at the very lowest doses, but would be at the doses where the biological significance is the least. Another option would be to consider the mean BE (Mean Bystander Ratio) over the dose range that BE is greater than the Direct Damage or, if AR is present, where, in the Hooker (2004) data AR begins to become dominant. We show these Bystander Ratios, as a function of dose, in Figures 6B, 7A and 7B. for the Hooker et al (2004), Miller et al (1999) and Nagawasa and Little (1999) data, respectively. The BF and Mean Bystander Ratio values are 27410 and 4320; 408 and 64.1; and 10.4 and 4.2, respectively.
The most important parameters with respect to Adaptive Response radio-protection are the magnitude of the protection given by Pprot and the minimum Specific Energy Hits to activate the AR (for spontaneous protection the value of N + 1 and for challenge dose protection the value of Q + 1 in the model). For the Hooker et al (2004) data, these are 0.61 and 2 ± 1. For the other AR data studied (Leonard 2005, 2007a, 2007b), the magnitude of the AR protection has ranged from about 0.25 to about 0.75 but the Poisson accumulation for initiation of AR has been consistently one or two charged particle tracts (Specific Energy Hits).
For both BE and AR, another significant consideration is the range of dose (and dose rate) over which the effects occur. Here the Hooker et al (2004) data shows BE extending from about 0.0001 to 0.01 cGy and the AR from about 0.01 to 4.0 cGy. BEIR VII (2006) notes as typical the range of AR to be from about 0.1 to 10.0 cGy (see Section 2, page 50, BEIR VII 2006). We have found that this is true for most of our analysis, however the examination of the low energy mammogram X-rays and 125I Brachytherapy photons found that with the high Specific Energy per Hit (<z1> = 0.638 cGy per Hit) the AR threshold is higher, because a single Hit delivers an unusually large amount of energy for low LET radiation, 0.638 cGy. Thus we found the AR range is narrower, from 0.638 to about 10 cGy as seen in Figure 5A and Figure 10 and discussed in Section 4.1.e.
5. DISCUSSION
In this Discussion section we wish to examine the properties and uncertainties that are known with respect to protective and deleterious mechanisms from low levels of ionizing radiations. Further, we will examine the properties and limitations of the Microdose Modelling provided here.
5.1. The Poisson Distribution as a Valid Estimator of the Adaptive Response Activation Functions
Poisson distributions describe random processes where the probability of occurrence is small and constant. It therefore has wide and diverse applicability for describing statistical fluctuations in observed event analysis such as radioactive decay of atomic nuclei. A prime example of its application to radiation biology is its use in analyzing chromosome aberrations in Cytogenetic Dosimetry (IAEA 2001). In low LET, sparsely ionizing radiation, ionizations are randomly distributed amongst cells and there are a large number of tracks present. Assuming an equal probability that any DNA damage can interact with a nearby similar break and form an aberration, it has been found, as it should, that the aberrations follow closely to a Poisson distribution. Frequently, more than one human lymphocyte donor and more than one laboratory is used in the experimental development of the cytogenetic Linear-Quadratic (L-Q) dose-response calibration curve and a very large number of blood samples are analyzed for each calibration dose point. Prior to fitting the data points to the L-Q polynomial, a test of the distribution of aberrations from the pooled data from all the donors and all the laboratories is carried out in order to determine whether the yields at each data point conform to the Poisson distribution about the mean value.
For our data analysis here to investigate the thresholds and transitions of adaptive response by individual charged particle tracks, the accumulation of these tracks amongst the cell population will also be random and Poisson distributed about a mean track (hit) value. This will also be true for the initiation of the deleterious damage threshold at the beginning of the Direct Damage Region. Prescribing a Poisson accumulation about the mean hit value for the deleterious damage does not mean that there is no damage produced at very low dose. At a dose infinitesimally above zero dose, there is a finite probability, but small, that damage occurs. We have illustrated the Poisson distribution functions and the corresponding Poisson accumulation functions as Figure 1 of Leonard (2007a). For a large number of hits the Poisson functions become very broad as seen in the Figure 1A for the threshold for Direct Damage for the Redpath et al (1998, 2001) 137Cs AR data fit. It is conventional to assume that the random production of radiation effects from broad-beam exposures is Poisson (Nagasawa and Little 1999, Little and Wakeford 2001, Little 2004, Brenner and Sachs 2002).
5.2 Known Protective and Deleterious Low Level Mechanisms and the Microdose Model
Feinendegen and his cohorts (Feinendegen 2003, 2005, Feinendegen et al 2000, 2007, Feinendegen and Neumann 2006, Polycove and Feinendegen 2003) have identified the primary adaptive mechanisms that are protective against the development of carcinogenesis. They are 1.) radiation induced increased ROS scavenging, 2.) DNA repair (this would include increased perception of the damage, increased rate of location of the damage site, increased rate of mobilization of repair resources and increased rate of actual repair of the damage), 3.) development of defensive immune responses and 4.) activation of increased beneficial apoptosis processes—removing potentially carcinogenic damaged cells from the population (Portess et al 2007). Known primary deleterious mechanisms are 1.) the well studied deleterious bystander effect and 2.) deleterious apoptosis and 3.) recent observation of latent effects from genomic instability (Mothersill and Seymour 2005, Morgan 2003a, 2003b). Morgan (2006) has recently suggested that the issue of the validity of the Linear-No Threshold hypothesis hinges on the significance of the adaptive response protection versus the deleterious bystander damage with little significance placed on apoptosis and genomic instability. Even more recent work (Huang et al 2007) finds that genomic instability experiences an adaptive response suppression from low-dose radiation exposure.
Our model presented here examines prompt protective and deleterious behavior since in vitro dose response from either immediate or delayed plating (the delayed plating is still on the order of hours and is thus still prompt compared to latent genomic instability effects). Apoptosis even for low LET radiations occurs in a matter of hours (Mothersill and Seymour 2005) but does continue to gradually increase with time (Belyaev et al 2001) with the maximum apoptosis occurring between 48 and 60 hours. The fraction of cells eliminated by apoptosis is indeed linear with dose at low doses for low LET radiations as shown in Feinendegen et al (2000—see their Figure 5) and as shown by Figure 2 of Belyaev et al (2001) and Figure 5 of Lee et al (2005) with a very low slope of 0.8% per cGy. Thus, in the dose range where adaptive response occurs i.e 0.1 to 10 cGy the apoptosis contribution would be only about 8% at the high end of the AR range and thus would be reflected in the high dose region where the deleterious damage begins to dominate. Little is known about stimulation of immune systems by radiation. Feinendegen (2005) notes that in vivo immunization occurs from increased number of cytotoxic lymphocytes which could be activated in a matter of hours and found to last for several weeks. Thus, our model most likely encompasses most mechanisms but not latent genomic instability effects.
5.3 Protective “Extra-nucleus” Adaptive and Protective “Bystander Type” Response
The Brenner et al (2001) BaD bystander model has been incorporated into our Microdose Model. We pose the fundamental question, “Can the bystander and adaptive response Microdose Model presented here accommodate currently unknown protective behavior at very low doses below one specific energy hit?” We need to identify two possible, but now unknown, very low dose potentially protective behaviors. The first one we will call “Extra-nucleus Adaptive Response.” As we noted above, it may be probable that in some cell species the Critical Sensitive Volume for AR is larger than the cell nucleus (for example including the cytoplasm or even the inter-cellular medium). Then this would mean that the “target” diameter will be larger and <z1> will be smaller. The experimentally observed threshold and transition of the protective, reduced dose response, will occur below doses for one specific energy hit to the nucleus. We illustrate this with Figure 11, where we show two Poisson accumulation functions—one predicted for the nucleus being the “target” and one for the total cell being the “target,” which we let be twice the diameter of the nucleus. The failure of the fit to the data using the nucleus as the “target” will reveal the presence of the “Extra-nucleus” AR. By adjusting the value of <z1> to fit the observed dose response curve in the threshold region, the proper <z1> can be obtained and hence the true size of the Extra-nucleus “target” from Equations (39) or (40) above.

Illustration of the possible case where very low dose protective adaptive response or bystander behavior may be observed. Shown are hypothetical data where adaptive response protection is activated by “target” volumes larger than the cell nucleus. We show the Absorbed Dose scale for the abscissa and two scales for Specific Energy Hits—one for the nucleus as the “target” and one for the entire cell which we let be twice the nucleus with a <z1> of 1/4th the nucleus case.
The second situation where the use of the cell nucleus as the sensitive volume would not provide a good fit would be if there is a protective bystander effect, where cells that are not directly hit cause a reduction in the observed cellular damage “end-point.” We see this in the Ko et al (2004) mammography data in Figure 8 where we show a “U” shaped reduction before the Poisson accumulation of Specific Energy Hits. The BaD model formulation can be useful here. However, we must evaluate this protective bystander effect with respect to the magnitude of the existing damage without the priming dose inducing this BE protection, either just from the naturally occurring spontaneous only damage or that produced from large challenge doses. We should be able to use the BaD model equations, by letting the parameter, σ, be defined in this case as the fraction of the damage that receives the protection just as Pprot—s∞ and Pprot—pr∞ are the fractions for the normal Poisson activated AR protection—see illustration in Figure 5B.
5.4. Persistence of Adaptive Response Protection at Higher Dose and Dose Rates, Retention or Dissipation?
We have noted in Leonard (2007a) that Feinendegen et al (2000) have suggested that the increasing deleterious primer radiation may dissipate the ability of the cell to maintain the enzymatic capabilities to continue the AR protection. We discuss this in Section 2.1.a and provide in our models a dissipation function, f(D) in Section 2.8.e. If dissipation does occur, f(D) would be expected to be a mono-tonic, decreasing function of dose, such as a negative exponential function. Dissipation would mean an endogenic direct interaction between the protective mechanisms and the damage mechanisms, which are currently unknown. Some of the prior work model fits suggest a persistence of the protection and others do not. A knowledge of this would be important to the bio-chemist in trying to understand AR. The data examined in prior work (Leonard 2007a) and here leave this issue inconclusive. We show with the Microdose Model if the AR protection is indeed dissipated by the disruptive increased radiation induced, linearly responding direct damage, then extrapolation of the high dose response data points back to the origin would intercept at unity (for normalized Relative Dose Response). If the AR persists at higher doses, the extrapolation will intercept the origin below unity because the dose response at the higher dose values are lower due to the still present AR protection. We have reproduced the Finendegen et al (2007) Figure 7 as our Figure 2, which illustrates the two AR retention or dissipation scenarios. As Figure 8D, we provide a linear scaled abscissa for the Ko et al (2004) data. At these low doses the typical linear-quadratic behavior is linear (only at higher doses would the behavior become linear-quadratic). For the Ko et al (2004) data in Figure 8D, the intercept is at a Relative Dose Response of 0.71, suggesting that at least 29% AR is retained. So our examination of the mammography X-ray and the 137Cs data and find conclusive evidence that the AR protection is retained for the X-rays but not for the 137Cs gamma rays. More future data is needed to study this behavior.
5.5 Dose and Dose-Rate Coupling for Adaptive Response and Bystander Effects
The first modeling to accommodate dose-rate effects in cellular radiobiology was the work of Thames (1985) for fractionation of radio-therapy treatments (Incomplete Repair Model—IRR) and Curtis' (1986) Lethal–Potentially Lethal Model (LPL). These models have been very successful in modeling the ability of DNA breaks to repair themselves at protracted dose rates primarily because the basic DNA repair mechanism is well understood. In modeling for the activation of radio-protective mechanisms, the task is much more difficult because the actual mechanisms themselves are not understood. For example, we have recently shown a strong correlation between the “triggering” and thresholds and transitions for the dose induced radio-protection for low dose hyper-radiosensitive cells (HRS/IRR) and the low LET “inverse” dose rate effect (IDRE). We developed transitions functions, for both [see Equation (13) for HRS/IRR and Equation (7) for IDRE in Leonard (2007c)], but were unable to show how they would be inter-coupled. The same is true in our analysis here for the obvious coupling between dose and dose-rate for adaptive response. The two published AR dose and dose-rate studies, Shadley and Wiencke (1989) for AR challenge doses and Elmore et al (2006) for AR for spontaneous damage clearly show both a dose and a dose-rate threshold and transition. We do know that both data show a minimum number of Specific Energy Hits and also minimum Specific Energy Hit Rates for AR to be initiated because there are lower data points where AR has not yet been activated. But again, not understanding the mechanisms, it is difficult to model the process with the Poisson functions. We can premise two types of, empirically derived, couplings. These would be first 1.) a Poisson additive type coupling i.e. {[F(M,n) + F(dM/dt, dn/dt)]/2}—here then as the dose and M increases such that F(M, n) → 0 to 1.0, {[F(M,n) + F(dM/dt, dn/dt)]/2} → 0 to 0.5 if dM/dt « dn/dt. Then as dM/dt increases and exceeds dn/dt, then F(dM/dt, dn/dt) → 0 to 1.0 such that {[F(M, n) + F(dM/dt, dn/dt)]/2} → 0.5 to 1.0. The second 2.) a multiplicative coupling i.e. [F(dM/dt, dn/dt)F(M, n)]—here as M increases such that it is > n and F(M,n) → 0 to 1.0 the multiplicative function [F(dM/dt, dn/dt)F(M, n)] will dependent upon dM/dt. It will be zero for dM/dt « dn/dt and will then → 0 to 1.0 as dM/dt increases from « dn/dt to > dn/dt. With only two dose-rate dependent data sets and little data in the regions below M = n and dM/dt below dn/dt and further with little knowledge of the bio-chemical mechanisms, we have currently chosen the second empirical formulism for the dose and dose-rate coupling as given in Sections 2.4, 2.5 and 2.6.
5.6 Other Properties and Limitations of the Adaptive Response Microdosimetry Model
A significant feature of our AR model is the separate quantification of the activation of AR protection from spontaneous and radiation induced cell damage with the protection parameters Pprot—s∞ and Pprot—pr∞, respectively. We have noted that Ward (1985, 1988, 1995) was one of the first to examine the different modes of DNA damage that cause cell killing and potentially carcinogenic mutations. We have provided the separate spontaneous and radiation AR activation parameters. We have shown however that the separate resolution of both from experimental data is difficult. For example, if the mean values, in terms of Specific Energy Hits, S and O, are very nearly the same in the Poisson accumulation functions or if there are not enough data points in the threshold and transition AR regions, the separate thresholds and transitions are not resolvable—as were the case in Figures 2, 3 and 4 of Leonard (2007a), Leonard (2007b) and here. However if separate “matched” high challenge dose AR measurements and spontaneous AR measurements are conducted, the spontaneous and radiation induced model values may be determined. To date, no such matched sets have been obtained for the same cell species and same priming and challenge dose radiations.
A second feature of our model is the accommodation for a threshold for the induction of the deleterious radiation damage for the priming dose. This is accountable with the Poisson accumulation function, P d (M, U), where U is the mean number of Poisson distributed Hits to initiate the deleterious radiation damage. Of course, with the Linear No-Threshold hypothesis such a threshold is excluded however some experimental data reflect such a behavior. In our iterative least squares best fits of the microdose model to AR data, we have found it necessary to include a radiation damage threshold (Leonard 2007a) and resolve a fit value for U as was the case for the Redpath et al (1998, 2001) 137Cs data.
Our dose and dose rate model used here encompasses a number of parameters that need to be resolved. We have shown above that, in applying the model to data, the number of parameters can be reduced. In the Appendix, we cite the specific model applications.
There is recent evidence that irradiated nontransformed cells can transmit signals which stimulate the intercellular induction of apoptosis in precancerous cells (Portess et al 2007). The very low dose studies of induction of chromosomal inversions at doses as low as 0.001 mGy suggests a protective bystander signaling effect (Day et al 2006). Later data now show a possible reverse adaptive response protection (the priming dose occurring after the challenge dose) at bystander dose levels in pKZ1 mouse prostate tissue suggests an on-off adaptive response signaling with a possible dose rate effect (Day et al 2007). These behaviors need be examined in other chromosome biological “end-points” and obviously our model does not now encompass them. Scott (2005) has modeled the chromosomal inversion data but not using microdose concepts and requiring changes in parameters in the different response stages, i.e. bystander, adaptive response etc. In our model, a second deleterious [Figure 6 for the Hooker et al (2004) data] and protective [Figure 8 for the Ko et al (2004) data] bystander behavior, added to the new Leonard (2007c) model, involving hit cell transmissions to un-hit bystander cells may accurately describe these new observations.
There is always the question of whether in vitro cell dose response data, usually for transformed immortal cell species, can provide meaningful data relative to human radiation risks or benefit. In our earlier work, we showed in vivo examples of adaptive response protective behaviors (see Figures 3 and 4 of Leonard 2007a). A number of investigators have reported in vivo adaptive response type protection such as for hospital radiology technicians, nuclear power plant workers, nuclear shipyard workers and even Japanese A-bomb survivors (see Figures 3C and 3D, Leonard 2007a). Rossi (1999) reports three instances one of which we cite (see Figure 3B, Leonard 2007a). It would seem an evolutionary, natural behavior for cells of all species to react in a protective way to small doses of a potentially harmful toxicity—in our instance here ionizing radiation. In other work, we show that the radio-protective “inverse” dose rate effect is operative in plant, mammalian and human cells (see Figure 2, Leonard 2007c). So protective mechanisms must have existed early in our evolutionary history.
5.7 Implications Relative to the Linear No-Threshold Hypothesis
A considerable controversy is brewing with respect to the validity of the Linear No-Threshold hypothesis for low doses and low dose rates of ionizing radiation. It basically stems from the recent re-affirmation of this hypothesis by both the International Commission on Radiological Protection (ICRP 2006) and the National Research Council, BEIR VII Report (BEIR VII 2006) and the official opposition to a linear low dose response by the French Academy of Science (Tubiana et al 2005, 2006). Morgan (2006) recently discussed the ramifications of the issues as applied to the low level bystanders effect and adaptive response. Most recently an exchange of Letters to the Editor (Tubiana et al 2007, Brenner et al 2007) has “stirred the LNT controversy pot.” We here take issue to the statement in Brenners' Letter to the Editor—“Cancer risks at very low doses may indeed be lower than predicted by LNT, but there is at least as much indirect evidence suggesting that low-dose risks could be higher than those predicted by linear extrapolation of epidemiological data.”
From a common sense viewpoint, Americans receive an annual average of about 2.4 mSv of background radiation, of which 39% is low LET and 52% is from high LET Radon progeny (BEIR VII 2006). We also receive an annual average of about 0.5 mSv of man-made radiation, of which at least 98% is low LET. Thus, the major components of our total annual dose of 2.9 mSv is about 1.44 mSv low LET and about 1.25 mSv high LET Radon progeny alphas. We examine the low LET human exposures first. Many in vitro and in vivo data have shown the existence of adaptive response radio-protection. Here we have shown the extremely significant fact that AR protection occurs for potentially carcinogenic, spontaneous neoplastic transformations by the transversal of only a single radiation induced charged particle track through the cell nucleus, at very low dose rates. This means that without a bystander presence, the very first radiation incident within each cell, not only is not deleterious, but instead is protective. This protection in some instances causes a reduction in cancer risks of as much as 75% and extends to doses as high as 10 cGy—much higher than the quarterly limit for occupationally exposed workers. Conversely, with the low LET microbeam studies, to date (private communication, Dr. William Morgan), there is no evidence of a low LET induced direct deleterious bystander effect (BE). So we have many confirmed examples of low LET AR and no confirmed examples of low LET BE. It is the view of the author that Brenner's statement “at least as much indirect evidence suggesting that low-dose risks could be higher than those predicted by linear extrapolation of epidemiological data.” is not accurate for low LET radiation.
In the case of the high LET Radon progeny alpha exposures, there is strong evidence of a bystanders effect as shown from the alpha particle microbeam data. Zhou et al (2003) have shown however that the bystander effect chromosome damage is subject to adaptive response modulation. Our recent analysis (see Figure 4C and 4D, Leonard 2007a) of the in vitro and in vivo Radon progeny alpha dose responses of Brooks et al (1990, 1994) and Pohl-Ruling (1988) have shown that adaptive response induction by the low LET Radon daughter beta rays are necessary to explain the “U” shaped dose response data. At lower (domestic) alpha particle dose rates, the “U” shaped response would be deeper and perhaps even resemble the epidemiological data of Cohen (1997). Even if there is a bystander dose at very low Radon levels, what action can the Environmental Protection Agency take—lower the mediation guideline limit below 4 pCi per liter.
So in weighing the low LET and high LET low dose response probabilities, it seems prudent and responsible to premise “a Linear hypothesis at high dose but in many cases, at the low doses commonly experienced by humans, a response less than linear or even protective.” This could condition the general public to the fact that not all radiation is harmful. A prime example in adhering to LNT are the relatively strong warnings issued by Heyes et al (2004, 2006) and Brenner et al (2002) with respect to high Relative Biological Effectiveness factors for mammography X-rays and the linear dose response at mammography dose levels. Heyes et al (2004, 2006) estimated a factor of 4.4 and Brenner et al (2002) a factor of 2 excess cancer risk from the soft mammography X-rays using Linear No-Threshold extrapolations from Japanese A-bomb data. Through the measurements of Dr. Redpath and his group (Ko et al 2004) data presented here it is shown that the LNT hypothesis provides an overestimate of mammography cancer risks (Redpath 2007, Ko et al 2004). Even the recent warning about CT diagnostic X-rays (Brenner and Hall 2007) is unjustified for adult patients. We all support minimal radiation exposures for children but adult exposures which are primarily for adults over 30 years of age is different. The Redpath et al (2003) data for diagnostic X-rays shows a protective Bystander and an Adaptive Response radio-protection up to about 10 cGy. The A-bomb survivors received a significant neutron dose contribution based on the RBE of 10 assigned for the neutrons, which would be expected to be linear with minimal threshold. Even so, the most recent analysis by Preston et al (2007), if a threshold is considered as was done in their earlier work Pierce and Preston (2000) [see Hoel and Li (1998)], allows for a threshold at 16 cSv for all A-bomb solid cancers whereas the median CT scan dose is on the order of 1.5 to 3.0 cSv.
5.8 Regarding Planning and Protocol for Adaptive Response Laboratory Studies
It is common practice, in performing a series of in vitro radiation exposures involving the study of radio-biology dose response over a wide range of dose values, to increase the dose rates for the high dose data points to shorten the exposure times. We can examine some such cases. Just as an example, we look at the dose and dose rate data sets for the well known human lymphocyte adaptive response studies of spontaneous chromosome dicentrics by Pohl-Ruling et al (1983). They performed exposures for doses of 0.4, 1, 2, 3, 5, 10 and 30 cGy (rad) with adjustments in dose rates to enable reasonable exposure times at the higher doses. The exposures rates were 2.3 cGy min−1 for the 0.4, 1, 2 and 3 cGy doses; 4.6 cGy min−1 for the 5 cGy; 10 cGy min−1 for the 10 cGy and 17 cGy min−1 for the 30 cGy exposures. Another example is the adaptive response study of Redpath et al (1998, 2001). The exposure rates were 0.33 cGy min−1 for data below 10 cGy; 4.13 cGy min−1 for 30 and 50 cGy and 1.61 Gy min−1 for the 1 Gy data point. A factor of 10 variation in dose rate, with what we have now seen from Shadley and Wiencke (1989) and Elmore et al (2006), relative to dose rate influence, could impact on the results. Important relative to the Pohl-Ruling et al (1983) and Redpath et al (1998, 2001) data is that the lowest doses were at low dose rate and thus pertinent to possible human levels and benefit from adaptive response. Investigators however should be aware of dose rate effects in AR experiments.
In the Leonard (2007b) work, we noted that the challenge dose adaptive response studies provides for the combined AR effect on the direct challenge dose damage but also the natural occurring spontaneous damage. Only if the magnitude of the challenge dose is chosen sufficiently high, will the spontaneous level be negligible and challenge dose AR protection be accurately measured. It would be very significant if a single investigative group performed the two “matched” series of AR measurements i.e. for only the spontaneous behavior and separately for a challenge dose (which would include the spontaneous). No data are presently available for separate spontaneous and challenge AR exposures with the same cell species and the same radiations. We here compared the dose rate influence of the Shadley and Wiencke (1989) challenge exposures with the spontaneous dose rate data of Elmore et al (2006)—but involving different cell species and different radiation sources.
In the prior work and here, we have shown the need for investigators to plan their exposures to encompass the very low dose (and dose rate) range where specific energy hits begin to accumulate and thus the threshold and transition is obtained. This should be perhaps a factor of 10 in dose below the value of <z1>. This would provide dose response data at the beginning of the Poisson threshold and also show any evidence of “bystander” effects.
6. SUMMARY
Prior work has provided incremental phases to a microdosimetry modeling program to describe the dose response behavior of the radio-protective adaptive response effect. We have here consolidated these prior works (Leonard 2000, 2005, 2007a, 2007b, 2007c) to provide a composite, comprehensive Microdose Model that is also herein modified to include the bystander effect. The nomenclature for the model is also standardized for the benefit of the experimental cellular radio-biologist. It extends the prior work to explicitly encompass separately the analysis of experimental data that is 1.) only dose dependent and reflecting only adaptive response radio-protection, 2.) both dose and dose-rate dependent data and reflecting only adaptive response radio-protection for spontaneous and challenge dose damage, 3.) only dose dependent data and reflecting both bystander deleterious damage and adaptive response radio-protection (AR-BE model). The Appendix cites the various applications of the model and the text section where they are found. Here we have used the Microdose Model to analyze the, much more human risk significant, Elmore et al (2006) 125I brachytherapy photons, the Ko et al (2004) mammography X-ray and the Redpath et al (2003) diagnostic X-ray data for the dose and dose rate influence on the adaptive response radio-protective behavior of HeLa x skin cells for naturally occurring, spontaneous chromosome damage from these radiation sources.
We have also applied the AR-BE Microdose Model to the micro-beam facility data of Miller et al (1999), Nagasawa and Little (1999) and Zhou et al (2003). We find good fit of primarily the bystander portion of the model to the high LET microbeam data of Miller et al (1999) and Nagasawa and Little (1999), with neither showing a “U” shaped behavior premised by the BaD model illustration in Figure 1. For the Zhou et al (2003) data, we use the AR-BE model to estimate the threshold for adaptive response reduction of the bystander effect. We show that bystander damage is reduced in the similar manner as spontaneous and challenge dose damage as shown by the Azzam et al (1996) data in Figure 7C. Of considerable significance is the demonstration that the Ko et al (2004) mammogram and Redpath et al (2003) diagnostic X-rays show a protective Bystander behavior. We also show that the range of dose over which Adaptive Response radio-protection is effective depends on the value of the Specific Energy per Hit constant, <z1>. For radiations with large LET and large <z1> the dose range will be small as in the case of mammography and diagnostic X-rays, but, as in both cases, if there is a protective Bystander Effect the overall protective range is very large. When both protections are present, a double “U” shaped dose response would be expected. For the mammography X-rays, the AR protection is retained at higher dose where the Direct Damage from the primer dose begins to dominate.
Primary unresolved questions regarding adaptive response behavior are
Are the AR radio-protection mechanisms for the spontaneous and challenge dose damage the same?
Generally, is the AR radio-protection dissipated as the dose is increased and the deleterious radiation damage begins to dominate? That is then, is the dose dissipation function, f(D) = 1 (no dissipation or is it a mono-tonically decreasing function of dose)? We find for the Ko et al (2004) mammogram X-rays data shows about a 75% retention of the AR protection at high primer dose.
Does the adaptive response protective reduction from the low LET Radon progeny beta and gamma rays, in the Radon dose response, impact on the lung cancer risk at domestic and workplace Radon levels?
How does the potential magnitude of the latent effects of high radiation induced genomic instability and the potential bystander effects relate to the over 50% AR protections afforded based on our analysis from Leonard (2005, 2007a, 2007b) and herein?
How consistently does experimental dose response data show a need to introduce a dose and dose-rate threshold for the initiation of the deleterious radiation induced direct damage?
If the 232 MeV proton measurements (Elmore et al 2005) were done through space cabin material i.e. up to 20 g/cm2 Aluminum, would the slowed protons and the Bremsstrahlung produce high LET Bystander Effects (from the slowed protons) and/or low LET Adaptive Response (from the Bremsstrahlung)?
Future radiobiology research will most likely facilitate major modifications to or even render this model obsolete, but the model given here seems to satisfy what we currently experimentally observe and biophysically know and what is anticipated by the experimental cellular radio-biologists.
Footnotes
ACKNOWLEDGMENTS
The author wishes to express his appreciation to Dr. Ludwig Feinendegen and his cohorts for the extensive work in formulating the microdosimetry concepts. He is greatful for the helpful discussions with Dr. William Morgan and Dr. Leslie Redpath regarding adaptive response and bystander effects.
APPENDIX—INDEX OF MICRODOSE MODEL DEVELOPMENT AND APPLICATIONS
Adaptive Response Microdose Model, Spontaneous and Challenge Dose Damage, Dose Dependent data only—Section 2.1.e.
Adaptive Response Microdose Model, Large Challenge Dose Damage, Dose Dependent data only—Section 2.2.
Adaptive Response Microdose Model, Spontaneous Damage, Dose Dependent data only—Section 2.3.
Adaptive Response Microdose Model, Spontaneous Damage Dose & Dose-rate Dependent data—Section 2.5
Adaptive Response Microdose Model, Challenge Dose Damage Dose & Dose-rate Dependent data—Section 2.6
Bystander and Adaptive Response Microdose Model, Bystander and Spontaneous Damage Dose Dependent data only—Section 2.8.d.
Application of Adaptive Response Microdose Model, Spontaneous Damage Dose & Dose-rate Dependent to Elmore et al (2006) HeLa x Skin Data for Mammography X-rays—Section 3.1.c
Application of Bystander and Adaptive Response Microdose Model, Bystander and Spontaneous Damage Dose Dependent only to Hooker et al (2004) Low LET Chromosome Inversion Data—Section 3.2.a
Application of Bystander and Adaptive Response Microdose Model, Bystander and Spontaneous Damage Dose Dependent Only to High LET Microbeam Data—Section 3.3.a, b and c
Application of Bystander and Adaptive Response Microdose Model, Bystander and Spontaneous Damage Dose Dependent Only to the Ko et al (2004) Mammogram and Redpath et al (2003) diagnostic X-ray data showing Protective Bystander, Adaptive Response Radio-protection and AR Retention at High Primer Dose—Sections 3.4 and 4.1.c
Properties and Limitations of Microdose Model—Section 5.6
Planning and Protocol for Laboratory Bystander and Adaptive Response Experiments—Section 5.8