
Abstract
A recurring pattern of spectral changes indicative of periodic changes in the proportion of β-structure and a-helix of a recombinant ECTO-NOX fusion protein of tNOX, with a cellulose binding domain peptide, was demonstrated by Fourier transform infrared (FTIR) and circular dichroism (CD) spectroscopic analyses. The pattern of structural changes correlated with oscillatory patterns of enzymatic activities exhibited by the protein previously interpreted as indicative of a clock function. The pattern consisted of a repeating pattern of oscillations with a period length of 21 min with five maxima (two separated by 5 min and 3 separated by 4 to 4.5 min) within each 21 min repeat. Oscillatory patterns were not obvious in comparable FTIR or CD spectra of albumin, ribonuclease or concanavalin A. The period length was constant at 5, 15, 25, 35 and 45° C (temperature compensated) and oscillations occurred independently of substrate presence. Spectra obtained in deuterium oxide yielded a longer period length of 26 min both for oscillations in enzymatic activity and absorbance ratios determined by FTIR. Taken together the findings suggest that the regular patterns of oscillations exhibited by the ECTO-NOX proteins are accompanied by recurrent global changes in the conformation of the protein backbone that directly modulate enzymatic activity.
INTRODUCTION
A growth factor- and hormone- or drug-responsive oxidation of NADH catalyzed by a family of proteins is found at the external surface of plant and animal plasma membranes (Morré and Brightman, 1991; Brightman et al., 1992). These proteins are now referred to as ECTO-NOX proteins to distinguish them from the phox-NOX proteins of host defense located at the internal membrane surface (Lambeth et al., 2000). In rat hepatomas (Bruno et al., 1992) and in cancer cells in culture (Morré et al., 1995b), a constitutively-activated component of NADH oxidation is observed which is no longer dependent upon hormone activation. This constitutively-activated component (tNOX) is responsive to certain drugs such as the antitumor sulfonylurea, LY181984 (Morré, 1995, Morré et al., 1995c), and the vanilloid quinone site inhibitor, capsaicin (Morré et al., 1995a; Chueh et al., 1997b; Morré et al., 1996). The cell surface plasma membrane NADH oxidase reduces protein disulfides (Chueh et al., 1997a) and both the constitutive and the constitutively activated NADH oxidases respond differently to thiol reagents (Morré and Morré, 1995; Morré et al., 1995a) and catalyze protein disulfide-thiol interchange (Morré et al., 1998).
An unusual property of both the oxidation of NADH and of the protein disulfide-thiol interchange activity catalyzed by the constitutive ECTO-NOX (CNOX) proteins first shown for plants is that the two activities oscillate with a period length of 24 min (Morré and Morré, 1998). Similar oscillations were observed with the NADH oxidase activity of the constitutive CNOX protein from CHO (Pogue et al., 2000) and from HeLa cells (Wang et al., 2001). The period lengths of the oscillations observed with whole cells or tissues, with plasma membranes and with the protein purified from these sources or even the bacterially expressed form of the cloned HeLa NOX protein (Morré, 1998) were temperature compensated (period length independent of temperature) such that a function as the ultradian (less than 24 h) core oscillator of circadian timekeeping was postulated (Morré and Morré, 1998; Pogue et al., 2000; Morré et al., 2002a; Morré et al., 2002b). Since the periodic oscillations could be demonstrated with populations of the enzyme, the phase of the oscillations must be entrainable. ECTO-NOX synchrony through entrainment was subsequently shown to be achieved through autosynchrony in solution (Morré et al., 2002b), by coupling to red light photoreceptors in plants (Morré et al., 1999b) and blue light photoreceptors in both plants (Morré et al., 2002c) and animals (Morré and Morré, 2003a) and in direct response to melatonin (Morré and Morré, 2003a). These two characteristics, temperature compensation and entrainment (coupling to environmental signals) are two defining hallmarks of the biological clock (Edmunds, 1988; Dunlap, 1996).
To demonstrate that ECTO-NOX proteins did function as core oscillators of the biological clock, COS (SV40-transformed African monkey kidney) cells were transfected with cDNAs encoding tNOX proteins having a period length of 22 min or encoding tNOX proteins containing cysteine to alanine replacements having period lengths of 36 or 42 min (Chueh et al., 2002a, b). Such transfectants exhibited 22, 36 or 42 h circadian patterns, respectively, in the activity of glyceraldehyde-3-phosphate dehydrogenase, a common clock-regulated protein, in addition to the endogenous 24 h circadian period length (Morré et al., 2002a). The fact that the expression of a single oscillatory ECTO-NOX protein determined the period length of a circadian biochemical marker (60 X the ECTO-NOX period length) provides compelling evidence that ECTO-NOX proteins do function as core oscillators that determine the period length of the cellular biological clock.
The actual ECTO-NOX cycle is not a simple sine function but a complex series of major and minor oscillations that repeat every 24 min for the constitutive CNOX (Morré and Morré, 2003b,c). The reproducibility and statistical significance of these patterns have been established by time series analyses (Foster et al., 2003) and are further illustrated in this report.
The objective of the present study was to elucidate the underlying structural basis for the pattern of periodic oscillations revealed initially by fluctuations in enzymatic activity (Morré and Morré, 1998, 2003c). Using Fourier transform infrared (FTIR) and circular dichroism (CD) measurements with a truncated recombinant source of NOX protein [ttNOX(CBD) with a 21 min period length], recurrent patterns of spectral change indicative of changes in β-structure and α-helix were observed also with a period length of 21 min. The latter are suggested to be indicative of changes in the secondary structure of tNOX that dictate the fluctuations in its enzymatic activity.
METHODS
Expression of Recombinant ttNOX(CBD)
A truncated form of tNOX has been cloned and inserted into vector pET-34b(t) (Novagen) which provides a 54 kD fusion protein of tNOX and a cellulose binding domain peptide (CBD) expressed in BL21(DE3) E. coli (Chueh et al., 2002b). The CBD can be used for aid in purification. Expression has been optimized and at least 300 milligrams per liter of media were obtained. tNOX-CBD was solubilized from inclusion bodies and refolded to obtain protein that was 85–90% pure (Chueh et al., 2002b).
Fourier Transform Infrared Spectroscopy
FTIR samples were prepared by placing about 200 μg of hydrated ttNOX(CBD) in a volume of 35 μl on a CaF2 window covered with another CaF2 window without a spacer. The absence of the spacer created a very thin layer of sample thus minimizing the influence of water on the spectrum, which can absorb in the amide I/amide II region. The ttNOX(CBD) also was dried and rehydrated with 99% deuterium oxide (2H2O, D2O) for comparison. Control samples of bovine serum albumin (BSA), concanavalin A and ribonuclease were prepared in the same manner as ttNOX(CBD).
Spectra were recorded for ttNOX(CBD) solvated in water or 99% D2O on a Nexus 470 E.S.P. FTIR spectrometer equipped with a MCT/B detector and KBr beam splitter over the IR region of 4000 cm−1 to 1200 cm−1. Absorbances in the range of 2.5 to 3.1 were in the linear range of the instrument (proportional to protein) and minimized the influence of water vapor on the spectra. Temperature variations above 25° C were created with the use of a Specac Variable Temperature Controller.
Temperature Cell Controller
For temperatures below 25° C, temperature-controlled water was pumped through a thermocouple jacket around the sample cell. Data were collected at 4 cm−1 resolution with 16 scans averaged into one spectra. Spectra were collected over 1 min intervals with a collection time of approximately 30 sec. A built in delay accounted for the remainder of the min. The data were analyzed using OMNIC software and a workstation (Gendrean, 1986).
Circular Dichroism
Circular dichroism (CD) data were collected at 1-min intervals with sufficient precision to observe spectral changes indicative of reversible α-helix to β-sheet transitions. CD measurements employed a JASCO Model 810 CD spectrophotometer. Spectra were recorded from ca. 0.06 mg/ml solutions in 1.0 cm cuvettes (260–190 nm, continuous scanning at 100 nm/min, 0.5 nm data pitch, 100 mdeg sensitivity 2 sec response time, 2 nm bandwidth). Approximate values for mole fractions of the amino-acid residues in α-helices, in β-structures and in irregular segments were calculated according to a neural network analysis program (Böhm et al., 1992) or according to Sreerama and Woody (1993; 1994).
Enzyme Assays
NADH oxidation was measured spectrophotometrically from the disappearance of NADH measured at 340 nm (Morré et al., 1995b, Morré and Morré, 2003c). Protein disulfide-thiol interchange was determined spectrophotometrically from the cleavage of dithiodipyridine (DTDP) (Morré et al., 1999a). Proportionality of enzymatic activity to protein concentration with the purified ttNOX(CBD) or with the bacterial extracts was verified for both assays.
Protein concentrations were determined by the bicinchoninic acid (BCA) procedure (Smith et al., 1985) with bovine serum albumin as standard.
Statistical Analyses
Results were analyzed using fast Fourier transform and decomposition fits (Foster et al., 2003) to verify the reproducibility of the signals. To determine the period length of the NADH oxidase activity the fast Fourier transforms were performed by means of a user-defined transform in SigmaPlot 8.0. Decomposition fits on both the enzyme activity and the growth determinations were used to predict patterns based on the period length Fourier analysis. The decomposition fits used MINITAB, a statistical package. Three measured values, mean average percentage error (MAPE), a measure of the periodic oscillation, mean average deviation (MAD), a measure of the absolute average deviations from the fitted values, and mean standard deviation (MSD), the measure of standard deviation from the fitted values plus R-squared and the Henriksson-Merton p value were used to evaluate accuracy (Foster et al., 2003).
RESULTS
NADH oxidase activity of recombinant tNOX revealed the typical pattern of oscillations with a period length of 21 min (Fig. 1). Maxima for NADH oxidation (Fig. 1A) alternated with those for protein disulfide thiol interchange activity (Fig. 1B) creating a composite 5 peak pattern. Two of the 5 maxima ( and
and  ) associated with NADH oxidation were separated by about 5 min. The remaining 3 maxima (
 ,
,  and
and  ) associated with protein disulfide-thiol interchange, formed a triad with maxima separated from each other and from the diad associated with NADH oxidation by about 4 min. The net result is an asymmetric pattern of oscillations with a repeating period of 21 min due to the unequal separation of maxima labeled
  and
and  associated with NADH oxidation.

Activity measurements of cellulose binding domain (CBD)-tagged recombinant tNOX [ttNOX(CBD)] at 37° C as a function of time over 100 min at 35° C. Capsaicin (1 μM) was then added and the assays were continued for an additional 60 min. A. Rate of oxidation of NADH. A repeating pattern of 5 maxima at intervals of 21 min (arrows). Two maxima separated by 5 min, and  ), dominate. B. Decomposition fit of 0 to 100 min of A to show the reproducibility of the oscillatory pattern conforming to a period length of 21 min, MAPE 21.43, MAD 10.7 and MSD 3.1. C. Protein disulfide-thiol interchange. The 3 maxima,
  ,
,  and
and  , separated by 4 to 4.5 min alternate as a triad with the two maxima in rate of NADH oxidation. D. Decomposition fit of 0 to 100 min of C to show the reproducibility of the oscillatory pattern over two full cycles of 21 min each. MAPE 50.0, MAD 19.0 and MSD 2.1. The estimation of NADH oxidation is based on the decrease in A340 as described (Morré et al., 1995b). Protein disulfide-thiol interchange is determined from the cleavage of an artificial dithiodipyridine (DTDP) substrate (Morré et al., 1999a). Both activities were inhibited completely by 1 μM capsaicin added after 100 min. Decomposition fits for two full periods show the reproducibility of the oscillations and a period length of 21 min.
A defining characteristic of the tNOX proteins is that both the NADH oxidation and the protein disulfide-thiol interchange activities are inhibited by a variety of quinone site inhibitors all of which have anticancer activity (Morré, 1998) such as capsaicin. Both NADH oxidation (Fig. 1A) and protein disulfide thiol-interchange (Fig. 1C) of the recombinant ttNOX(CBD) were blocked by 1 μM capsaicin. Decomposition fits of the data from 0 to 100 min show the statistical reproducibility of the pattern of alternating maxima and minima over two full cycles (42 min) (Figs. 1B and 1D).
The large feature of the infrared absorption spectra of recombinant ttNOX(CBD) was that the absorption at 1660–1700 cm−1 in the amide I region (predominately C=O stretch) appeared to oscillate with time compared to the 1500–1600 cm−1 region dominated by the amide II band (coupled C—N and N—H modes) (Fig. 2). Both regions are reflective of global influences on the protein backbone with absorbance directly proportional to protein amount over the entire range of absorbances investigated (Fig. 3, Insert).

Infrared absorption spectra of recombinant ttNOX(CBD) at 25° C. The three spectra shown were separated in time by 3 min and correspond to the 45 (A), 48 (B) and 51 (C) min time points of Figure 3. The most obvious change is in the position of the maximum absorbance in the Amide I region.
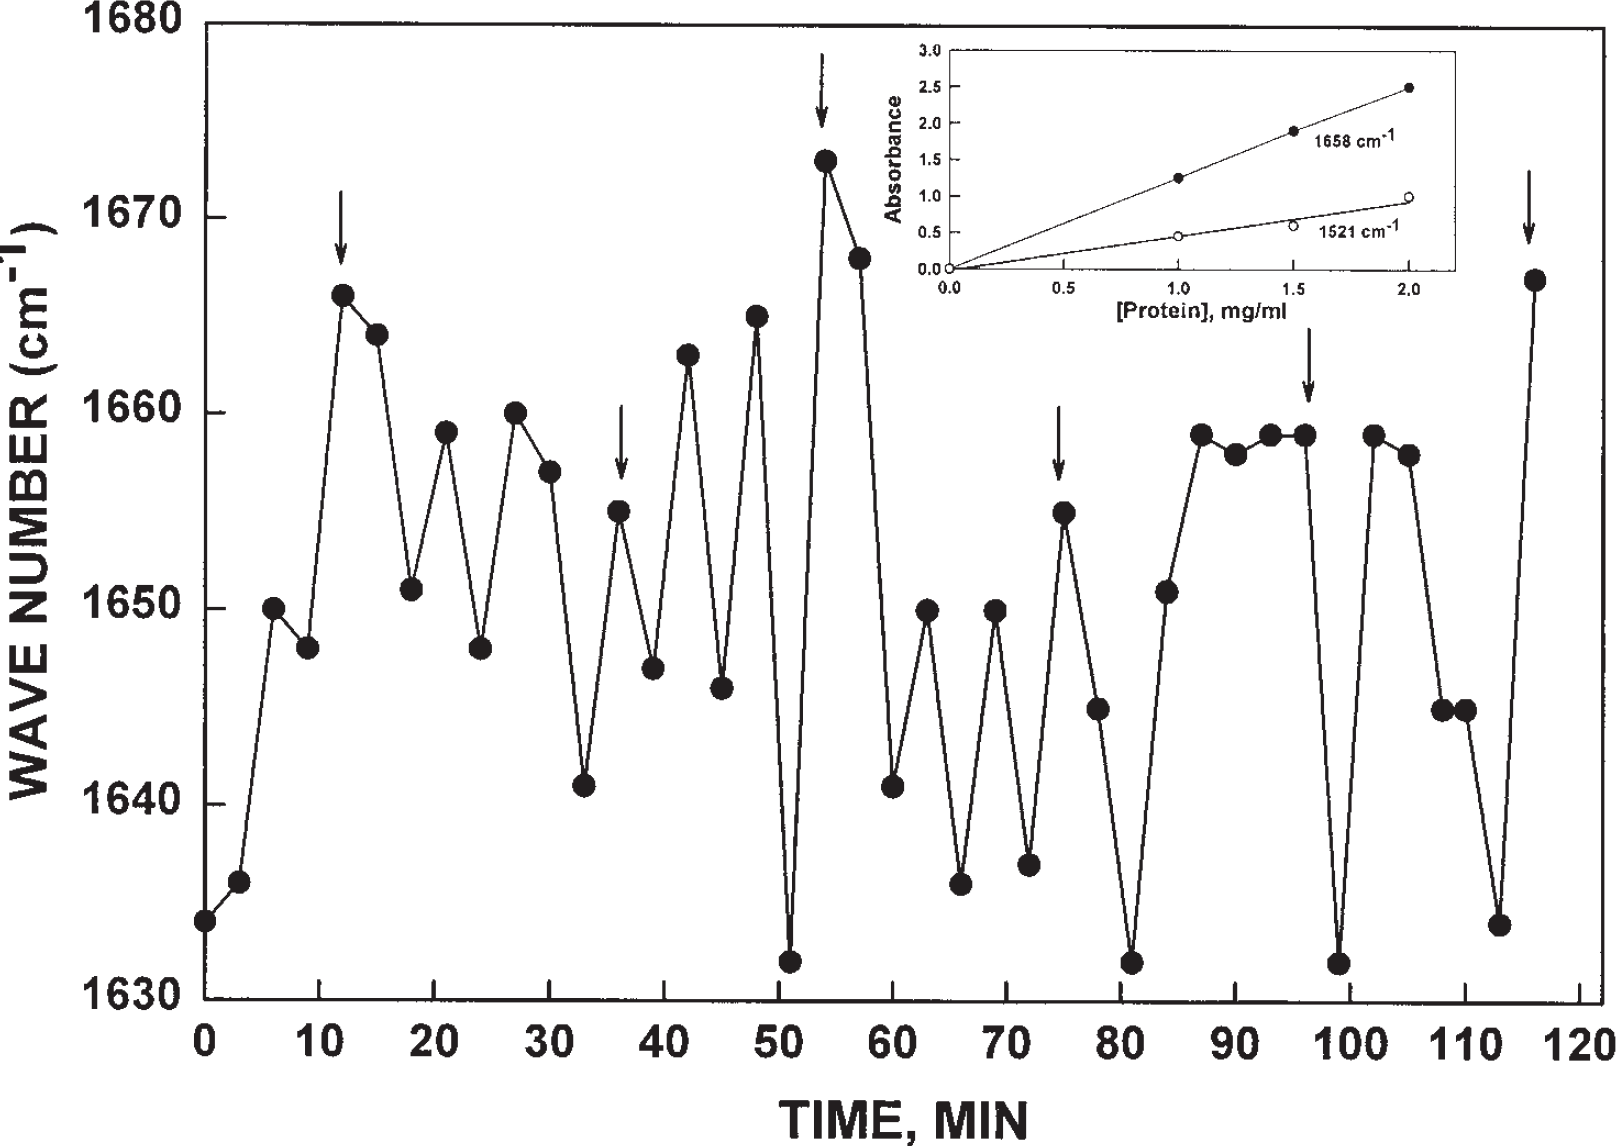
Wave numbers of maximum absorption determined from FTIR spectra of ttNOX(CBD) collected over 1 min at intervals of 3 min between 0 and 120 min. The position of the absorption maxima oscillated between about 1632 and about 1668 with an average period length of about 7 min. The arrows indicate a 21 min repeat corresponding to the period length for the enzymatic activity oscillations of tNOX. The inset shows proportionality of absorbance and protein amount of the range of 1 to 2 absorbance units determined either at 1658 cm−1 or 1521 cm−1.
The initial evidence for oscillatory behavior was a marked shift in the position of the absorbance maximum in the Amide I region of the spectra (Fig. 2). When the absorption maxima were displayed as a function of time (absorptivity averaged over 1 min at 3 min intervals), a repeating series of oscillations was observed with maxima and minima alternating at intervals of approximately 7 min (arrows denote a 21 min interval corresponding to the period length of the recombinant tNOX activity cycle) (Fig. 3). Within the Amide I region, the position of the absorption maximum varied between 1634 ± 2 cm−1 at one extreme and 1664 ± 6 cm−1 at the other.
As a practical means of data collection appropriate to the observed spectral changes, absorbance was determined at 1658 cm−1 as a measure of Amide I absorption (the maximum minus one standard deviation) (Fig. 4A) and compared to Amide II absorption at 1521 cm−1 (Fig. 4B). Although the absolute changes in absorbance were much smaller at 1521 cm−1, generally the changes observed in Amide I (1658 cm−1) and in Amide II (1521 cm−1) appeared to be related inversely (Fig. 4A, B).
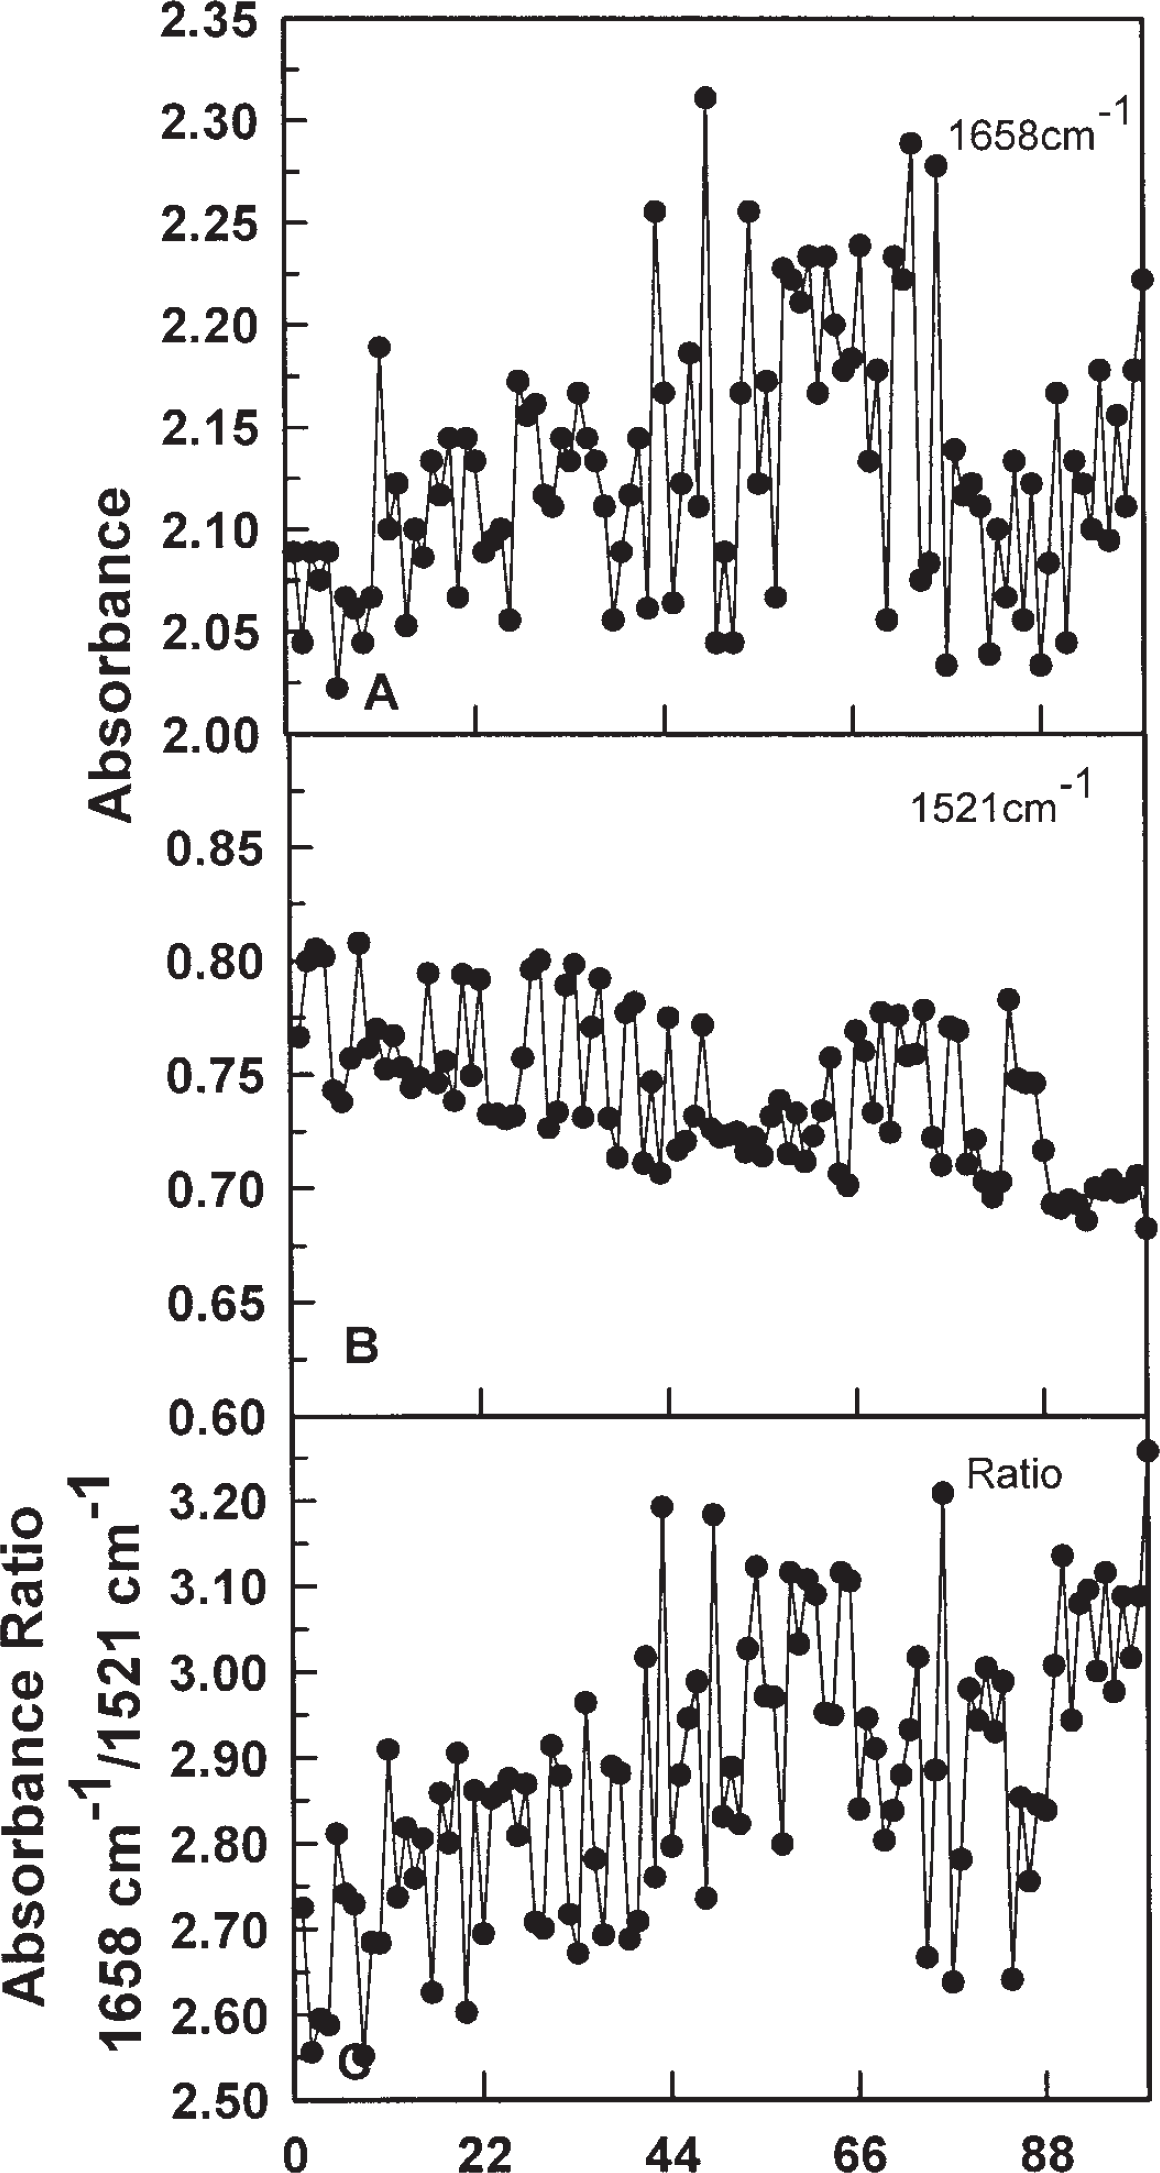
Fourier transform infrared analyses of recombinant tNOX at 1658 cm−1 (A) or 1521 cm−1 (B) at intervals of 1 min over 100 min at 37° C with a zero baseline and absorbance oscillations between 2.0 and 2.2 for 1658 cm−1 (A) and between 0.7 and 0.8 for 1521 cm−1 (B). The ratio of the Amide I (1658 cm−1) to Amide II (1521 cm−1) absorbance yielded a repeating pattern of five maxima two of which were separated by 5 to 6 min and the remainder were separated by 4 to 4.5 min creating an overall period of 21 to 22 min in length when analyzed by Fourier (not shown) or decomposition (Fig. 5) analyses. Within the amide I region, peak absorbance varied between 1658 and 1630 indicative of alternating α-helix-β-sheet transitions (not shown).
Because of the apparent inverse relationship and also for the Amide II absorbance to serve as a reference, the ratios of absorbance at 1658 cm−1 (Fig. 4A) and 1521 cm−1 (Fig. 4B) were calculated (Fig. 4C). The ratio was only slightly influenced by variation in protein concentration (Fig. 2, Insert) and provided a reproducible oscillatory pattern with 5 maxima within a 21 min period which is the same number of oscillations seen within a 21 min period for enzymatic activity of ttNOX(CBD) (Fig. 1). To provide a statistical validation of the oscillatory patterns, decomposition fits from time series analyses were used (Fig. 5). In this method, multiple cycles were analyzed as in Figure 1 for ttNOX(CBD) activity and compared statistically to generate a predicted pattern along with measures of the accuracy of the statistically fitted values. Decomposition fits using a 21 min period length revealed complementary patterns of oscillations (Fig. 5) with the pattern consisting of 5 maxima being particularly evident with the ratio of the two absorbances (Fig. 5).

Decomposition fits of data of Figure 3 determined using a period length of 21 min. A. Data recorded at 1658 cm−1. MAPE 1.66, MAD 0.05, MSD 0.004. B. Data recorded at 1521 cm−1. MAPE 1.0, MAD 0.025, MSD 0.001. C. The ratio of the two wavelengths. MAPE 2.04, MAD 0.023, MSD 0.0009. For the data at 1658 cm−1 and 1521 cm−1, 6 (B) or 7 (A) maxima are resolved, two of which are separated by an interval of 5 to 6 min and 1 (B) or 2 (A) are represented by doublets within 1 (B) or 2 (A) of the 4 to 4.5 min intervals. There is an inverse relationship between the data at 1658 cm−1 and 1521 cm−1 that generates a pattern of the ratios between the two wave lengths with 5 maxima. Within the recurring period of length of 21 min two of the maxima are separated by 5.5 min and the remainder are separated by 4 to 4.5 min. This pattern parallels closely the pattern exhibited by ttNOX(CBD) activities shown in Figure 1.
The maxima at 1658 cm−1 and at 1521 cm−1 occurred at intervals of about 4.2 min but were not evenly spaced. Three of the maxima were represented as doublets within a 4.2 min interval (Fig. 4A, B) and in these regions, absorbance maxima at 1658 cm−1 correlated with minima at 1521 cm−1 and vice versa. As a result, the ratio of the two absorbances generated an asymmetric 5-peak pattern resembling that of the enzymatic activity of Figure 1 where two maxima associated with NADH oxidation were separated by 5 min and 3 maxima corresponding to protein disulfide-thiol interchange were separated by 4 to 4.5 min (Fig. 5C).
Decomposition fits assuming period lengths other than 21 min resulted in less well resolved oscillatory patterns (Fig. 6). The characteristic asymmetric spacing with two of the maxima being separated by an interval of 5 min with the remaining maxima separated by 4 to 4.5 min is well reproduced only in Figure 6C (decomposition fit to a period length of 21 min).

Decomposition fits of ratio data [35 μl of 5.5 mg/ml ttNOX(CBD)] generated at 25° C analyzed using period lengths of 18 min (A), 20 min (B), 21 min (C), 22 min (D), 24 min (E) and 26 min (F). Only the decomposition fit with a period length of 21 min (C) shows the characteristic 2 + 3 pattern of 5 unequally spaced maxima.
FTIR measurements and calculations of absorbance ratios at 1658 cm−1/1521 cm−1 followed by decomposition fits using a period length of 21 min for bovine serum albumin (Fig. 7A), concanavalin A (Fig. 7B) or ribonuclease (Fig. 7C) failed to reveal any discernable patterns of oscillations when assayed in parallel with tNOX and presented on the same scale. Mean variations in the absorbance ratios were ±0.1% compared to ± 2% for ttNOX (e.g., Fig. 5). Bovine serum albumin is 50 to 68% α-helix and 16–18% β-structure, concanavalin A is about 3% α-helix and 80 to 90% β-structure and ribonuclease is 16 to 28% α-helix and 56 to 70% β-structure (Singh, 2000).

Amide I/Amide II ratios for bovine serum albumin (A), concanavalin A (B) and ribonuclease (C) showed no discernable repeating patterns when presented on the same scale as Figure 5. Assays were at 25° C with 35 μl of 5 mg/ml protein for each.
The 21 min period length of tNOX activity has previously been shown to be independent of temperature (temperature compensated). Decomposition fits of the FTIR spectral changes at 5 temperatures at intervals of 10° C over the ranges of 5 to 45° C revealed patterns with 5 maxima (Fig. 8A—E) with relative spacings similar to those shown in Figure 5C showing that the period length of the oscillations observed by FTIR spectroscopy also were independent of temperature.

Decomposition fits of the absorbance ratio at 1658/1521 cm−1 of recombinant ttNOX (CBD) determined at 5, 15, 25, 35 and 45° C (A to E) showing period length to be independent of temperature. The assays contained 35 μl of 3.5 mg/ml of ttNOX(CBD). The two maxima separated by 5 min are labeled and  while those separated by 4 to 4. 5 min are labeled
  ,
,  and
and  ).
).
Thus far, the only treatment or condition known to influence the period length of the ECTO-NOX oscillations is D2O. When NOX activity was measured in 100% D2O, the period length was increased by about 25% from 21 min to 26 min (Fig. 9A, B). The FTIR pattern was similarly extended (Fig. 9C). The 26 min decomposition fit of the FTIR pattern showed the corresponding 5 maxima pattern with an extra maximum between the two labeled  and
and  also seen for NADH oxidation (Fig. 9A).

As in Figures 1 and 4 at 35° C except that measurements were of ammonium sulfateprecipitated ttNOX(CBD) (35 μl of 3.5 mg/ml protein) resuspended in 100% D2O rather than water. A. Rate of oxidation of NADH. Maxima occurred at intervals generating a period 26 min in length with two of the maxima separated by a longer interval of about 6 min compared to the others to independently determine the period length. The activity was inhibited by 1 μM capsaicin prepared in D2O added after 90 min. B. Decomposition fits showed the reproducibility of the 26 min oscillations in A. C. FTIR analysis of absorbance ratios of 1658 cm−1 and 1521 cm−1 yielded a longer period length (increased by 20%) of about 26 min with the maxima labeled and  separated by an interval of 6 min. These data are based on averages of four different experiments phased for the two maxima showing the 6 min separation,
  and
and  , and then fitted by decomposition analyses using the period length of 26 min determined by Fourier analysis of data of Fig. 9A prior to capsaicin addition.
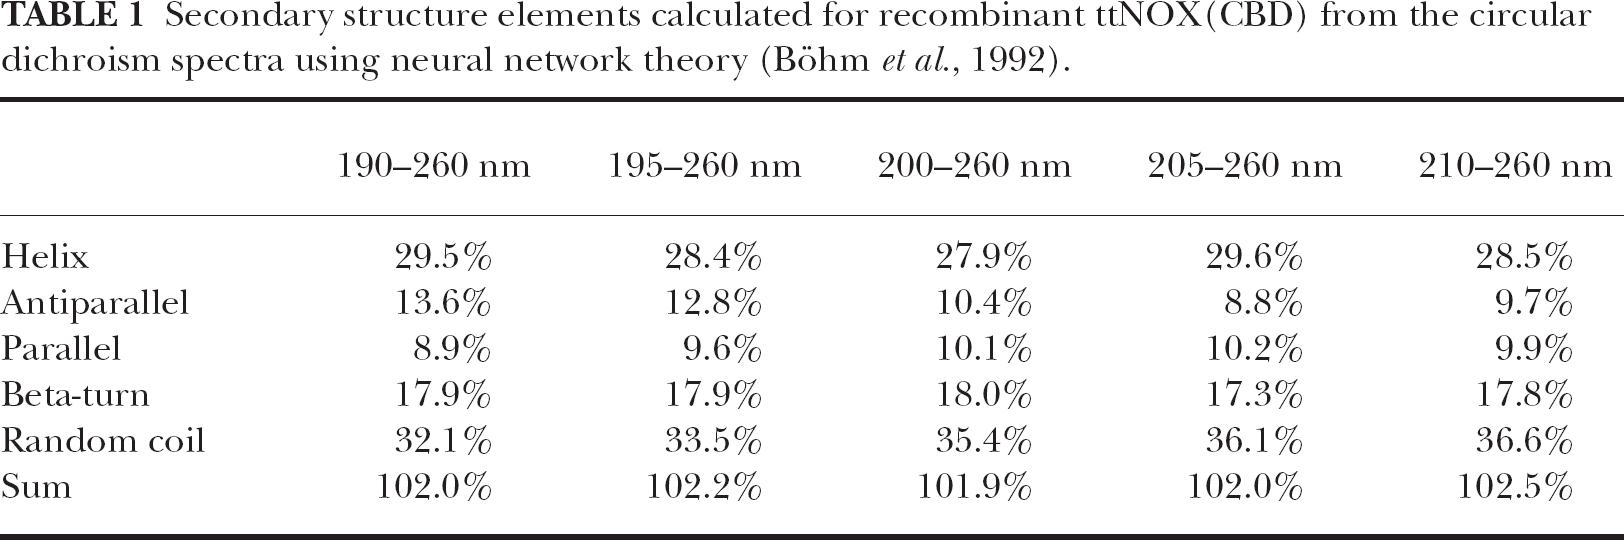
As determined by circular dichroism (CD) (Tables 1–3), the ttNOX (CBD) protein exhibited two levels of α-helix-β-structure transitions in keeping with its prion-like nature (Singh, 2000). The newly synthesized recombinant protein contained ca. 28% α-helix and about 38% β-structure (Table 1). It was amorphous in appearance in electron microscope preparations and was protease susceptible. When folded into the proteinase-resistance cylindrical structures, the β-structure content increased to above 44% but the α-helix content remained at about 30%. However, this latter change in conformation was distinct from that involved in the oscillations. The structure transitions that correlated with periodicity, although of a similar order of magnitude, appeared to be unrelated to those associated with protease resistance. Both the protease-resistant and the protease-susceptible forms of the protein seemed to exhibit oscillatory changes to approximately the same extent although the protease-susceptible form had a greater solubility and generated more clearly-resolved CD spectra than did the protease-resistant forms.
Secondary structure elements calculated for recombinant ttNOX(CBD) from the circular dichroism spectra using neural network theory (Böhm et al., 1992).

Secondary structure elements for proteinase K-resistant ttNOX(CBD) calculated for the circular dichroism spectra using neural network theory (Böhm et al., 1992).
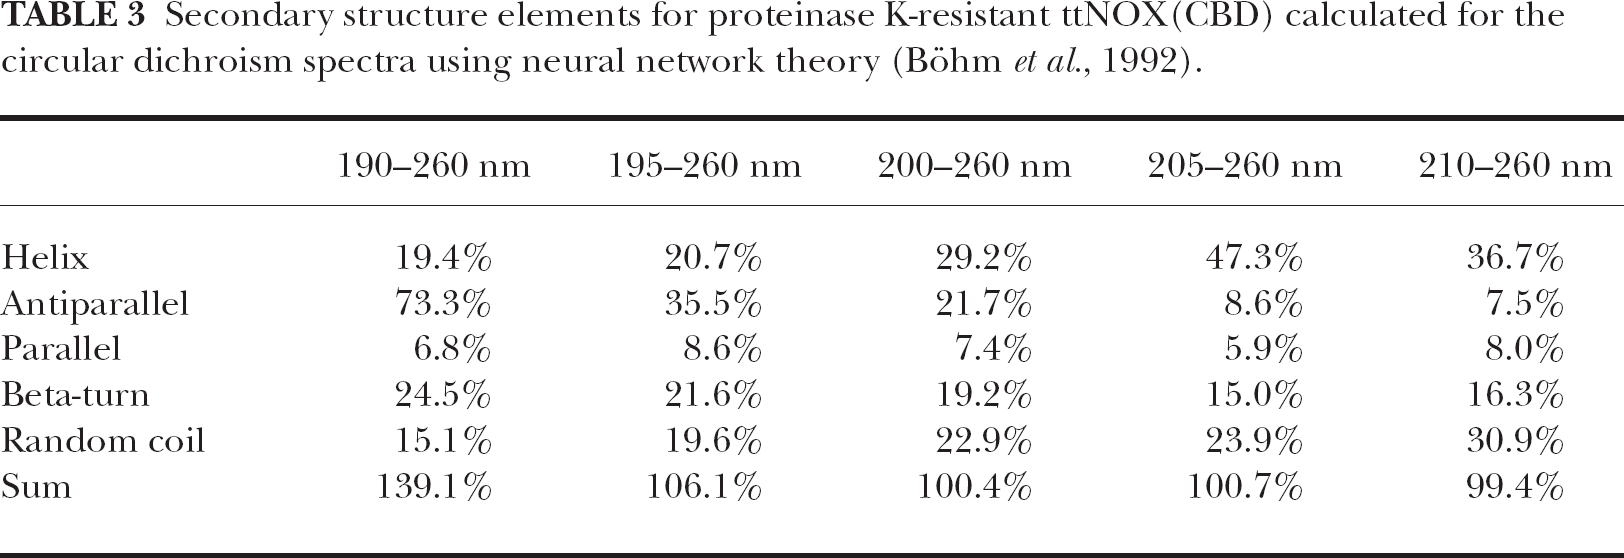
The pattern of oscillations observed from CD spectra were similar to that seen with FTIR (Fig. 10). A change from 1.36 to 1.46 in the α-helix to β-structure ratio with a 21 min period length as determined by CD measurements were similar to the change of 1.36 to 1.46 in the α-helix to β-structure ratio associated with protease resistance when analyzed either according to a neural network analysis program (Böhm et al., 1992) (Tables 1 and 3) or according to Sreerama and Woody (1993, 1994) (Table 2).

Ratio of total β-strand to ct-helix determined by circular dichroism measurements at 25° C. A. Soluble recombinant ttNOX(CBD) (0.06 mg/ml) prior to acquisition of proteinase K resistance (Table 1). Maxima labeled and  are separated by 5 to 6 min whereas maxima labeled
  ,
,  and
and  are separated by 4 to 5 min to define the period length of ca 21 min. The single arrow denotes a maximum present in the second full series of oscillations not present in the first. B. Bovine serum albumin (0.05 mg/ml). C. Ribonuclease (0.033 mg/ml). D. Decomposition fit (21 min period length) of the data of Figure 10A to verify the oscillatory pattern in the ratio of total β-structure to ct-helix of ttNOX(CBD) determined by circular dichroism measurements. E. Decomposition fit (21 min period length) of data of Figure 10B for bovine serum albumin. F. Decomposition fit (21 min period length) of data of Figure 10C for ribonuclease.
The oscillatory pattern determined from circular dichroism measurements shown in Figure 10A again revealed the pattern of five unequally spaced maxima as observed by FTIR analyses and from analyses of enzyme activity. Two of the recurrent maxima labeled  and
and  were separated by intervals of 5 min. The remaining maxima were separated by intervals of 4 to 4.5 min. An exception was a double maximum
  at 45 min (arrow). A similar phenomenon was observed in earlier CD data of recombinant tNOX (Morré and Morré, 2003b). CD measurements with bovine serum albumin (Fig. 10B) and with ribonuclease (Fig. 10C) did not show patterns of oscillations comparable to those observed with ttNOX(CBD). Verification of the oscillatory pattern with a period length of 21 min for ttNOX(CBD) was provided as well from the decomposition fits (Fig. 10D). Decomposition fits for bovine serum albumin (Fig. 10E) and for ribonuclease (Fig. 10F) provided no evidence for oscillatory patterns of change.
DISCUSSION
Structural Changes in the Peptide Backbone Measured by FTIR and CD Appear to Underlie Periodic NOX Function
The pattern of spectral alterations independent of oscillations in enzymatic activity reported here were first observed from FTIR analyses as changes in the absolute wave number of the maxima between 1600 and 1700 cm−1. The periodic variation was between 1634 ± 2 cm−1 as an average minimum and 1664 ± 5 cm−1 as the average maximum from 2 measurements over 1 min taken 3 min apart. Absorbance in the Amide II region at a maximum of about 1521 cm−1 was used as a reference.
Absorbances in both the Amide I and in the Amide II regions were proportional to protein amount and the absorbance ratios at 1658 and 1521 were constant with protein amount. Both values appeared to be related directly to the absorbance of the peptide backbone and were not substantially influenced by the water vapor present with the solvated protein samples in the range of 1 to 2 absorbance units. The oscillations in the 1658/1521 ratio were reproduced with dry samples but the dry protein proved to be difficult to handle and to distribute uniformly over the sample cell. With very dilute solutions, overlap of water with the Amide I band interfered.
That the changes in secondary structure observed occurred independently of substrate presence or of enzymatic activity per se, i.e., in the absence of any perturbatic stimulus, argues that tNOX has no stably folded conformation in solution either in the presence or absence of NADH but, rather, recapitulates a constantly recurring pattern of oscillations that would appear to regulate rather than result from the oscillatory pattern associated with the enzymatic activity of the protein.
The spectral changes between 1634 and 1664 cm−1 determined by FTIR overlapped both the region reflective of changes in beta structure between 1670 and 1680 cm−1 as well as the region of overlap between β-structure and α-helical and unordered structures in the 1650 to 1660 cm−1 region. The FTIR findings, while providing spectroscopic evidence for two “subpopulations” of tNOX that correlate with the patterns of oscillations in enzymatic activity, did not necessarily indicate a strict change in α-helix-β-structure ratios such that a need for further analyses were indicated.
When analyzed using independently obtained CD measurements, the β-strand composition of recombinant tNOX after re-folding and acquisition of proteinase K-resistance was determined to be about 45% within the context of a 3-state model of α-helix, β-strand and coil using neural network analysis (Böhm et al., 1992) or by the self-consistent method of Sreerama and Woody (Sreerama and Woody, 1993; 1994). The difference in β-strand structure between the protease-susceptible and the protease-resistant ttNOX (CBD) was related to a smaller coil component when analyzed by the neural network method.
The acquisition of increased β-structure associated with protease resistance seemed unrelated to the pattern of oscillations although the magnitude of changes in the ratios between α-helix and β-structure determined from the CD spectra were similar both for the oscillations and for protease resistance (change in the ratio from 1.36 to 1.46). Therefore, the changes in the conformation of the protein backbone responsible for the periodic modulation of the enzymatic activity of the protein appeared to be substantial.
During the NOX Activity Cycle, Two Distinct Activities Catalyzed by the Same Polypeptide Chain, Alternate
The functional manifestations of the pattern of oscillations were reflected both in the plasma membrane electron transport activities of the NOX proteins and in the breakage and formation of disulfide bonds that leads to protein disulfide-thiol interchange (Morré et al., 1998). The redox and interchange activities alternate every 12 min to generate, for example, the 24 min period length for the constitutive CNOX activity (Morré and Morré, 1998; Pogue et al., 2000; Wang et al., 2001). The period length for the alternation of activity oscillations observed with the recombinant tumor associated tNOX protein is 21 to 22 min depending on the recombinant form analyzed.
Oxidation of reduced coenzyme Q10 (Kishi et al., 1999) and/or oxidation of NADH (Morré et al., 1995b) have been monitored as a measure of the oxidative activities of NOX proteins. Cleavage of an artificial substrate, dithiodipyridine (DTDP), monitored spectrophotometrically, serves as a measure of the protein disulfide-thiol interchange activity (Morré et al., 1999a). Each of these activities when measured simultaneously on recombinant human tNOX, with proteins purified from HeLa cells, plasma membranes from HeLa cells, cell membranes from E. coli, intact HeLa and CHO cells as well as purified fraction and plasma membranes from different plant parts alternate to give rise to the recurring periodicity. Additionally, protein disulfide-thiol interchange activities of the NOX protein appear to drive the enlargement phase of cell growth (Pogue et al., 2000; Morré and Morré, 2003b; Morré et al., 2001). During the electron transport phase of the cycle involving hydroquinone or NADH oxidation, cell enlargement rests. As a result, constitutive rates of cell enlargement also fluctuate with a 24 min period length (Pogue et al., 2000; Morré et al., 2001; Morré et al., 2002d) whereas enlargement of tumor cells show both 24 and 21 to 22 min period lengths (Wang et al., 2001).
However, the alternation of activities is not that of a simple sine function. In well-synchronized preparations, the oxidative activity exhibits single or, more often, a double maxima within each 24 or 21 min period with the two maxima separated by 5 min for tNOX and 6 min for the constitutive CNOX. When protein disulfide-thiol interchange activity (Morré and Morré, 2003b) or growth (Pogue et al., 2000; Morré et al., 2001; Morré et al., 2002c; Morré and Morré, 2003b) are measured, three maxima are observed in which the three maxima are separated by intervals of ca. 4 to 4.5 min. These basic 2 + 3 patterns of activity oscillations combine to recapitulate the pattern of 5 nearly equal but unevenly spaced maxima observed by Fourier transform infrared (FTIR) analysis and by circular dichroism (CD). As with the activity oscillations, two of the five maxima were separated by 5 min while the separations among the remaining maxima were between 4 and 4.5 min.
Are NOX Proteins Core Oscillators of the Circadian Biological Clock?
Some relationship of NOX proteins to the operation of the biological clock was first suggested from the observation that the length of the activity period of the NOX proteins was both independent of temperature (temperature compensated) (Morré and Morré, 1998; Pogue et al., 2000; Morré et al., 2002a), and entrainable (individual molecules become synchronized) (Morré et al., 1998, 1999b, 2002a,c) both hallmarks of circadian time-keeping (Edmunds, 1988; Dunlap, 1996; Morré et al., 2002b).
To demonstrate a relationship between NOX protein oscillations and circadian rhythms, COS cells were transfected with a truncated processed form of tNOX (ttNOX) with a period length of 22 min, a C575A replacement of cysteine with alanine of ttNOX with a period length of 36 min, or a C558A replacement with a period length of 42 min (Morré et al., 2002a). As an endogenous marker to monitor the length of the circadian period, the activity of glyceraldehyde-3-phosphate dehydrogenase (GAPDH), an intracellular housekeeping protein normally with a pronounced 24 h circadian activity rhythm, was measured. COS cells, in keeping with most cultured cells and organisms grown in culture (Shinohara et al., 1998), exhibited circadian oscillations in this activity.
The transfected COS cells exhibited circadian period lengths of 22, 36 or 42 h (60 X the NOX period) for GAPDH activity in addition to their endogenous 24 h circadian period (Morré, et al., 2002a). Similar results were observed with HMG-CoA reductase as the circadian indicator. Since expression of single oscillating NOX proteins altered the period length of a well-established circadian biochemical marker, we have concluded previously that ECTO-NOX proteins provide a biochemical basis for the operation of the biological clock (Morré, et al., 2002a).
Deuterium Oxide Proportionately Lengthens both the ECTO-NOX Period and the Circadian Day
Deuterium oxide (2H2O) or heavy water has been shown to reversibly lengthen both the period and the phase of the period of the circadian day in a variety of organisms (Enright, 1997; Bruce and Pittendrigh, 1960). In Euglena gracilis adapted for long periods several months to D2O, the period of the running circadian rhythm of phototaxis was lengthened from its normal value (close to 23 h) to 28 or 29 h (Bruce and Pittendrigh, 1960). Many subsequent studies including those of Suter and Rawson (1968) and Enright (1997) indicated that this effect of D2O is of widespread occurrence. D2O lengthens the period in green plants (Bunning and Baltes, 1963), in isopods (Enright, 1997), birds (Palmer and Dowse, 1969), mice and hamsters (Suter and Rawson, 1968; Palmer and Dowse, 1969; Richter, 1970; Dowse and Palmer, 1972), insects (Pittendrigh et al., 1973) and unicellular organisms (Bruce and Pittendrigh, 1960; McDaniel et al., 1974). The effect may be general since no exceptions were found in 12 different species examined (Pittendrigh et al., 1973).
That the repeating pattern of five unequally spaced maxima as determined by FTIR behave similarly when measured in a D2O environment supports our contention of cause and effect between the oscillation observed with FTIR and CD measurements and those based on measurements of enzymatic activity. The period length is increased from 21 min to 26 min with the separation of maxima labeled  and
and  being increased from 5 min to about 6 min and the remaining maxima being separated in D2O by about 5 min compared to 4 to 4.5 min in an aqueous environment.
A shift in the amide I to amide II ratio with a period length of 24 min for tNOX was described by us several years ago for a plant ECTO-NOX in response to its activation by a low molecular weight auxin growth hormone (Morré et al., 1987). While the alternation of FTIR spectral changes with maxima at ca 1660 and 1630 cm−1 is indicative of changes in conformation in the peptide backbone of tNOX, strict assignment to oscillating α-helix-β-structure transitions will require further study. Never-the-less, the spectral changes observed are reproducible and offer a means of functional assessment, i.e., repeated measurements of a single protein sample over long periods of time, not afforded by other methods of assay.
Footnotes
ACKNOWLEDGMENT
We thank Laurel Karr and Christine Malone of the George C. Marshall Space Flight Center, AL for the large-scale expression and purification of the ttNOX(CBD) and Rebecca Meyers of Purdue University for conduct of preliminary studies.