
Abstract
Objective
We studied 8 triathletes competing in the 3-day World Ultraman Championships (day 1: 10-km swim, 165-km bike; day 2: 261-km bike; day 3: 85-km run) to determine the effect of extreme physical exertion on heart rate (HR), mean arterial blood pressure (MAP) and pulmonary function, and their relation to overall athletic performance.
Methods
Baseline HR, MAP and pulmonary function measurements were made 2 days before the start of competition. During the competition, HR and MAP measurements were made less than 30 minutes before the start and 10 minutes after the finish each race day. Pulmonary function was measured within 5 minutes of the finish each race day.
Results
Forced vital capacity and forced expiratory volume in 1 second (FEV1.0) were reduced from baseline at the end of each race day. Peak expiratory flow (PEF) was reduced from baseline on days 1 and 3. Lower baseline resting HR was correlated (r = 0.77, P = .021) with faster total race times. The decreases in FEV1.0 and PEF over the whole race also correlated with performance (r = 0.77 and 0.93). Multiple regression analysis of baseline data indicated that HR and MAP had the strongest association with total race time prediction (54% and 19% of total). However, when declines in pulmonary function over the total race were also included, PEF was found to be associated with 87% of the total race time prediction.
Conclusions
The strong association in the decline in PEF to race time, though just correlative, suggests a link between pulmonary function and ultratriathlon performance.
Introduction
The triathlon is a demanding competition involving endurance performances in swimming, biking, and running. Standard race distances range from sprint-length races (800-m swim, 20-km bike, and 5-km run) to short-course triathlons (1.5-km swim, 40-km bike, and 10-km run; also known as the “Olympic distance”) and Ironman events consisting of a 3.8-km swim, 180-km bike, and 42.2-km run. In addition to these standard distances, there are substantially longer distance events such as the World Ultraman Championships held in Hawaii. This is a 3-day staged-race triathlon that requires competitors to swim 10 km and bike 165 km on the first day, bike 261 km on the second day, and finish with an 85-km run on the third day.
Biochemical and physiological changes induced by triathlon performance have been reviewed.1,2 These reviews cover studies of triathlon performance from short-course through Ironman distances. Although no cardiopulmonary studies investigating triathletes racing beyond the Ironman distances have been reported, previous research of ultramarathon 3 and wilderness multisport endurance competitions 4 has shown substantial declines in respiratory function.
The purpose of the present study was to document basic heart rate (HR), mean arterial blood pressure (MAP) and pulmonary function characteristics during an event requiring extreme physical endurance through monitoring of ultradistance triathletes during the 3-day World Ultraman Championships and to relate these characteristics to overall race performance. We hypothesized that the extreme nature of this multiday competition might produce more marked changes in pulmonary function, and that these would be strongly related to overall race performance.
Methods
Subjects
Subjects were recruited from athletes entered in the World Ultraman Championships (Kona, Hawaii). The Institutional Ethics Review Board of Simon Fraser University approved the study, and written informed consent was obtained from all subjects. None of the athletes had a history of cardiovascular or pulmonary disease, and preliminary respiratory measures conformed to spirometric tables of normal respiratory function. 5
Race Conditions
The start times for days 1 and 3 were at 6:00
Data Collection
All measurements were made with the subject seated on the back of a crew vehicle. Pulmonary measures were collected with an automated SpiroPro pulmonary function unit (Jaeger Toenneis GmbH, Hoechberg, Germany). This device is manufactured according to American Thoracic Society guidelines. The spirometer was calibrated immediately before the testing with a precision 3-L flow-volume syringe (MultiFlow, Pulmonary Data Service Instrumentation, Louisville, CO). Tests with the syringe after the competition indicated no change in calibration. The measurements included forced vital capacity (FVC), forced expiratory volume in 1 second (FEV1.0), and peak expiratory flow (PEF). Before the data collection, athletes practiced the pulmonary function test until maximal reproducible ventilatory efforts were within 5% of each other. Pulmonary function measures were performed 2 days before the competition between 10:00
Baseline cardiovascular measures of HR and MAP were made with a digital automated oscillometric blood pressure monitor (A&D Medical, Milpitas, CA). Two measurements were obtained and averaged for analysis. These measurements were collected 2 days before competition between 10:00
Statistics
The JMP-IN statistical package (SAS Institute Inc., Cary, NC) was used for all statistical analysis. Repeated-measures analysis of variance was used to compare variables during all the race days. All data are quoted as mean ± SEM. Linear regression analysis was made among all collected variables for each group member and their recorded total race times. Significance was accepted at P < .05. To determine significant prerace day correlates of race performance, baseline cardiovascular and pulmonary data were compared with total swim, bike, and run times by using multiple regression analysis previously described in Blaber et al. 5
Results
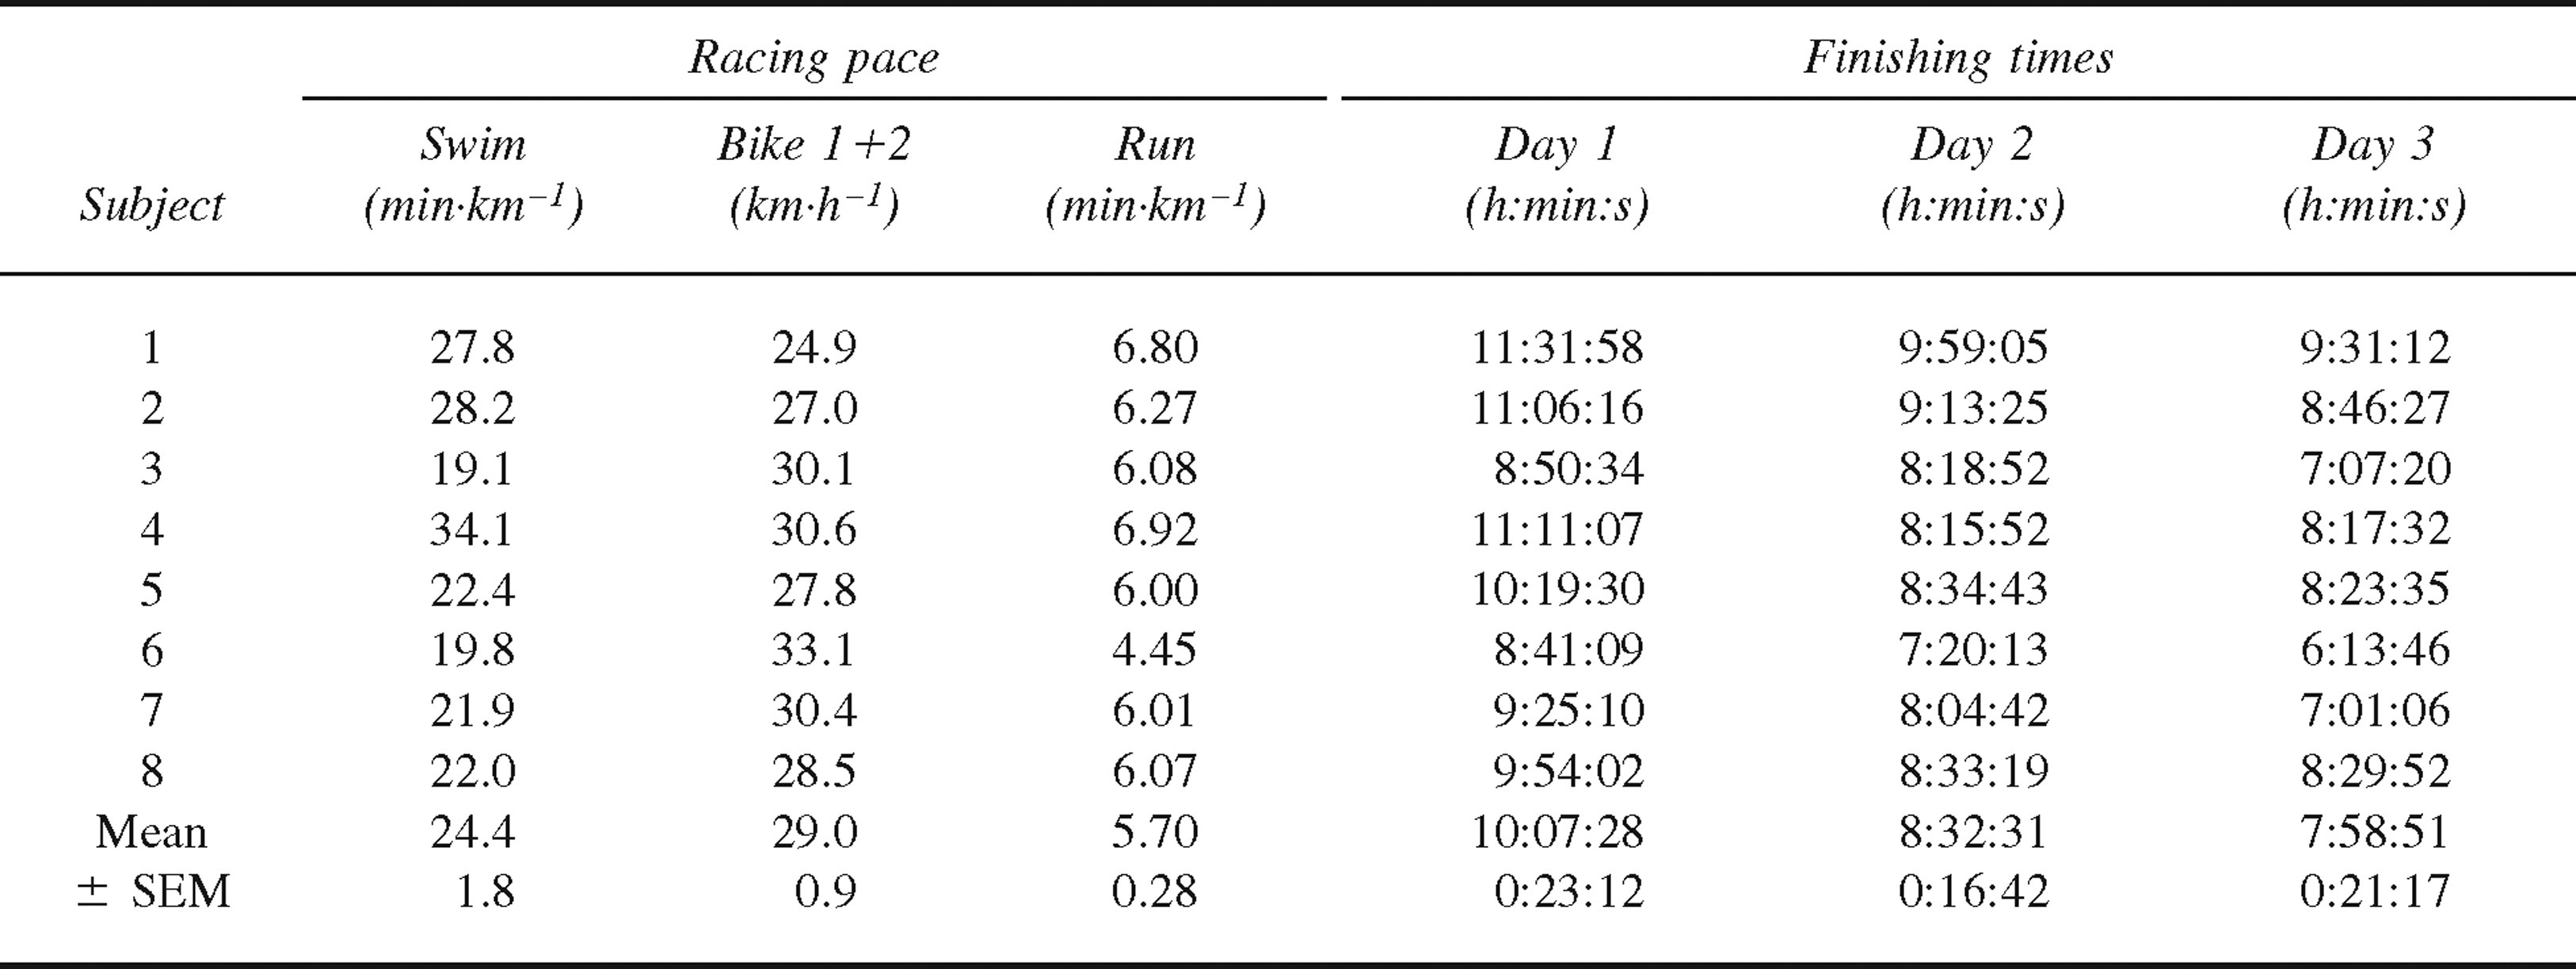
Twelve subjects of a total field of 32 agreed to participate in the study. A sudden change in the water currents and in the weather during the swim on day 1 adversely affected some of the competitors, and because of the cut-off time imposed upon the swim section, 4 of our volunteer athletes were classed as nonfinishers. Data from the remaining 8 subjects were used for analysis. Their mean age was 35.8 years (range 24–42 years), mean weight was 75 kg (range 69–84 kg), and mean height was 180 cm (range 174–182 cm). None of the racers was a smoker or had asthma. Their finishing positions ranged from 1st to 16th. Individual race performance data for these subjects are presented in Table 1.
Subject performance for the World Ultraman Championship
Physiological Measurements
Pulmonary
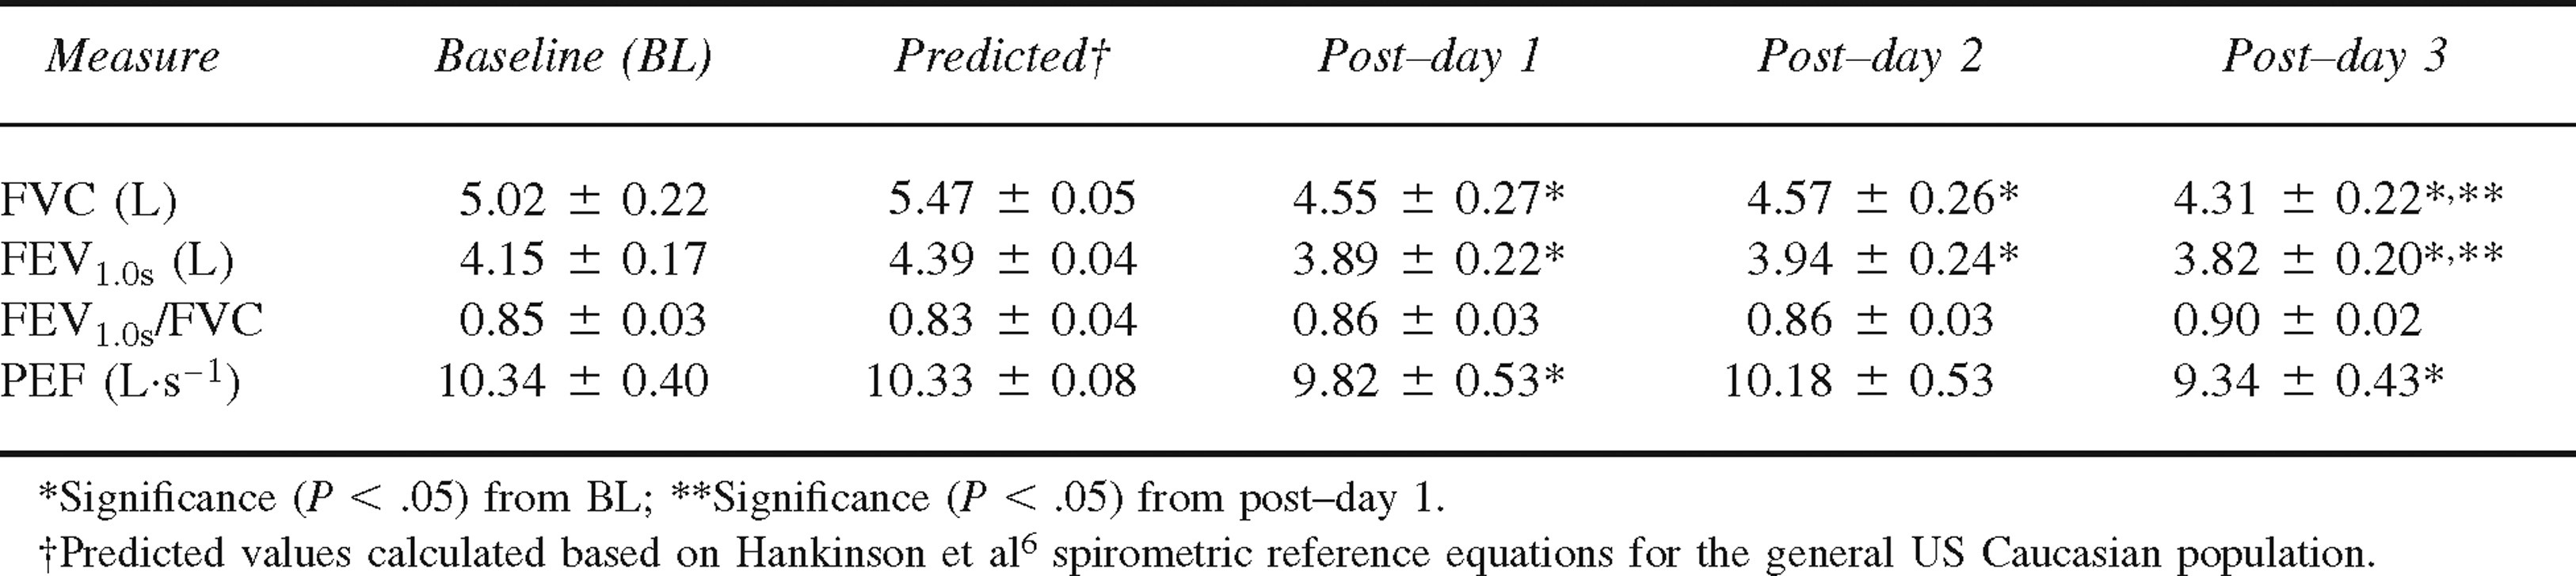
Baseline measures were not significantly different from predicted 6 values (Table 2). Immediately after completion of the swim and bike stages on day 1 there was a significant reduction in FVC, FEV1.0, and PEF (Table 2) compared with baseline, and FVC and FEV1.0 were also reduced after day 2 (P < .05 for all). A significant further reduction in FVC and FEV1.0 was observed post–day 3 compared with post–day 1 (Table 2).
Pulmonary measurements (forced vital capacity [FVC], forced expiratory volume in 1 second [FEV1.0], and peak expiratory flow [PEF]) expressed as mean ± SEM for the 8 volunteer athletes who completed the World Ultraman Champi onships
Cardiovascular
Baseline HR collected 2 days before the race (56.5 ± 1.5 beats/min) was at least 9 beats/min lower than the HRs recorded within 30 minutes of the start of each race day (P < .005 for all) (Figure 1). All postrace HRs were significantly higher than prerace values (P < .005 for all). The prerace day 2 and postrace day 3 HRs were also significantly higher than the corresponding values on day 1 (P < .05 for both).
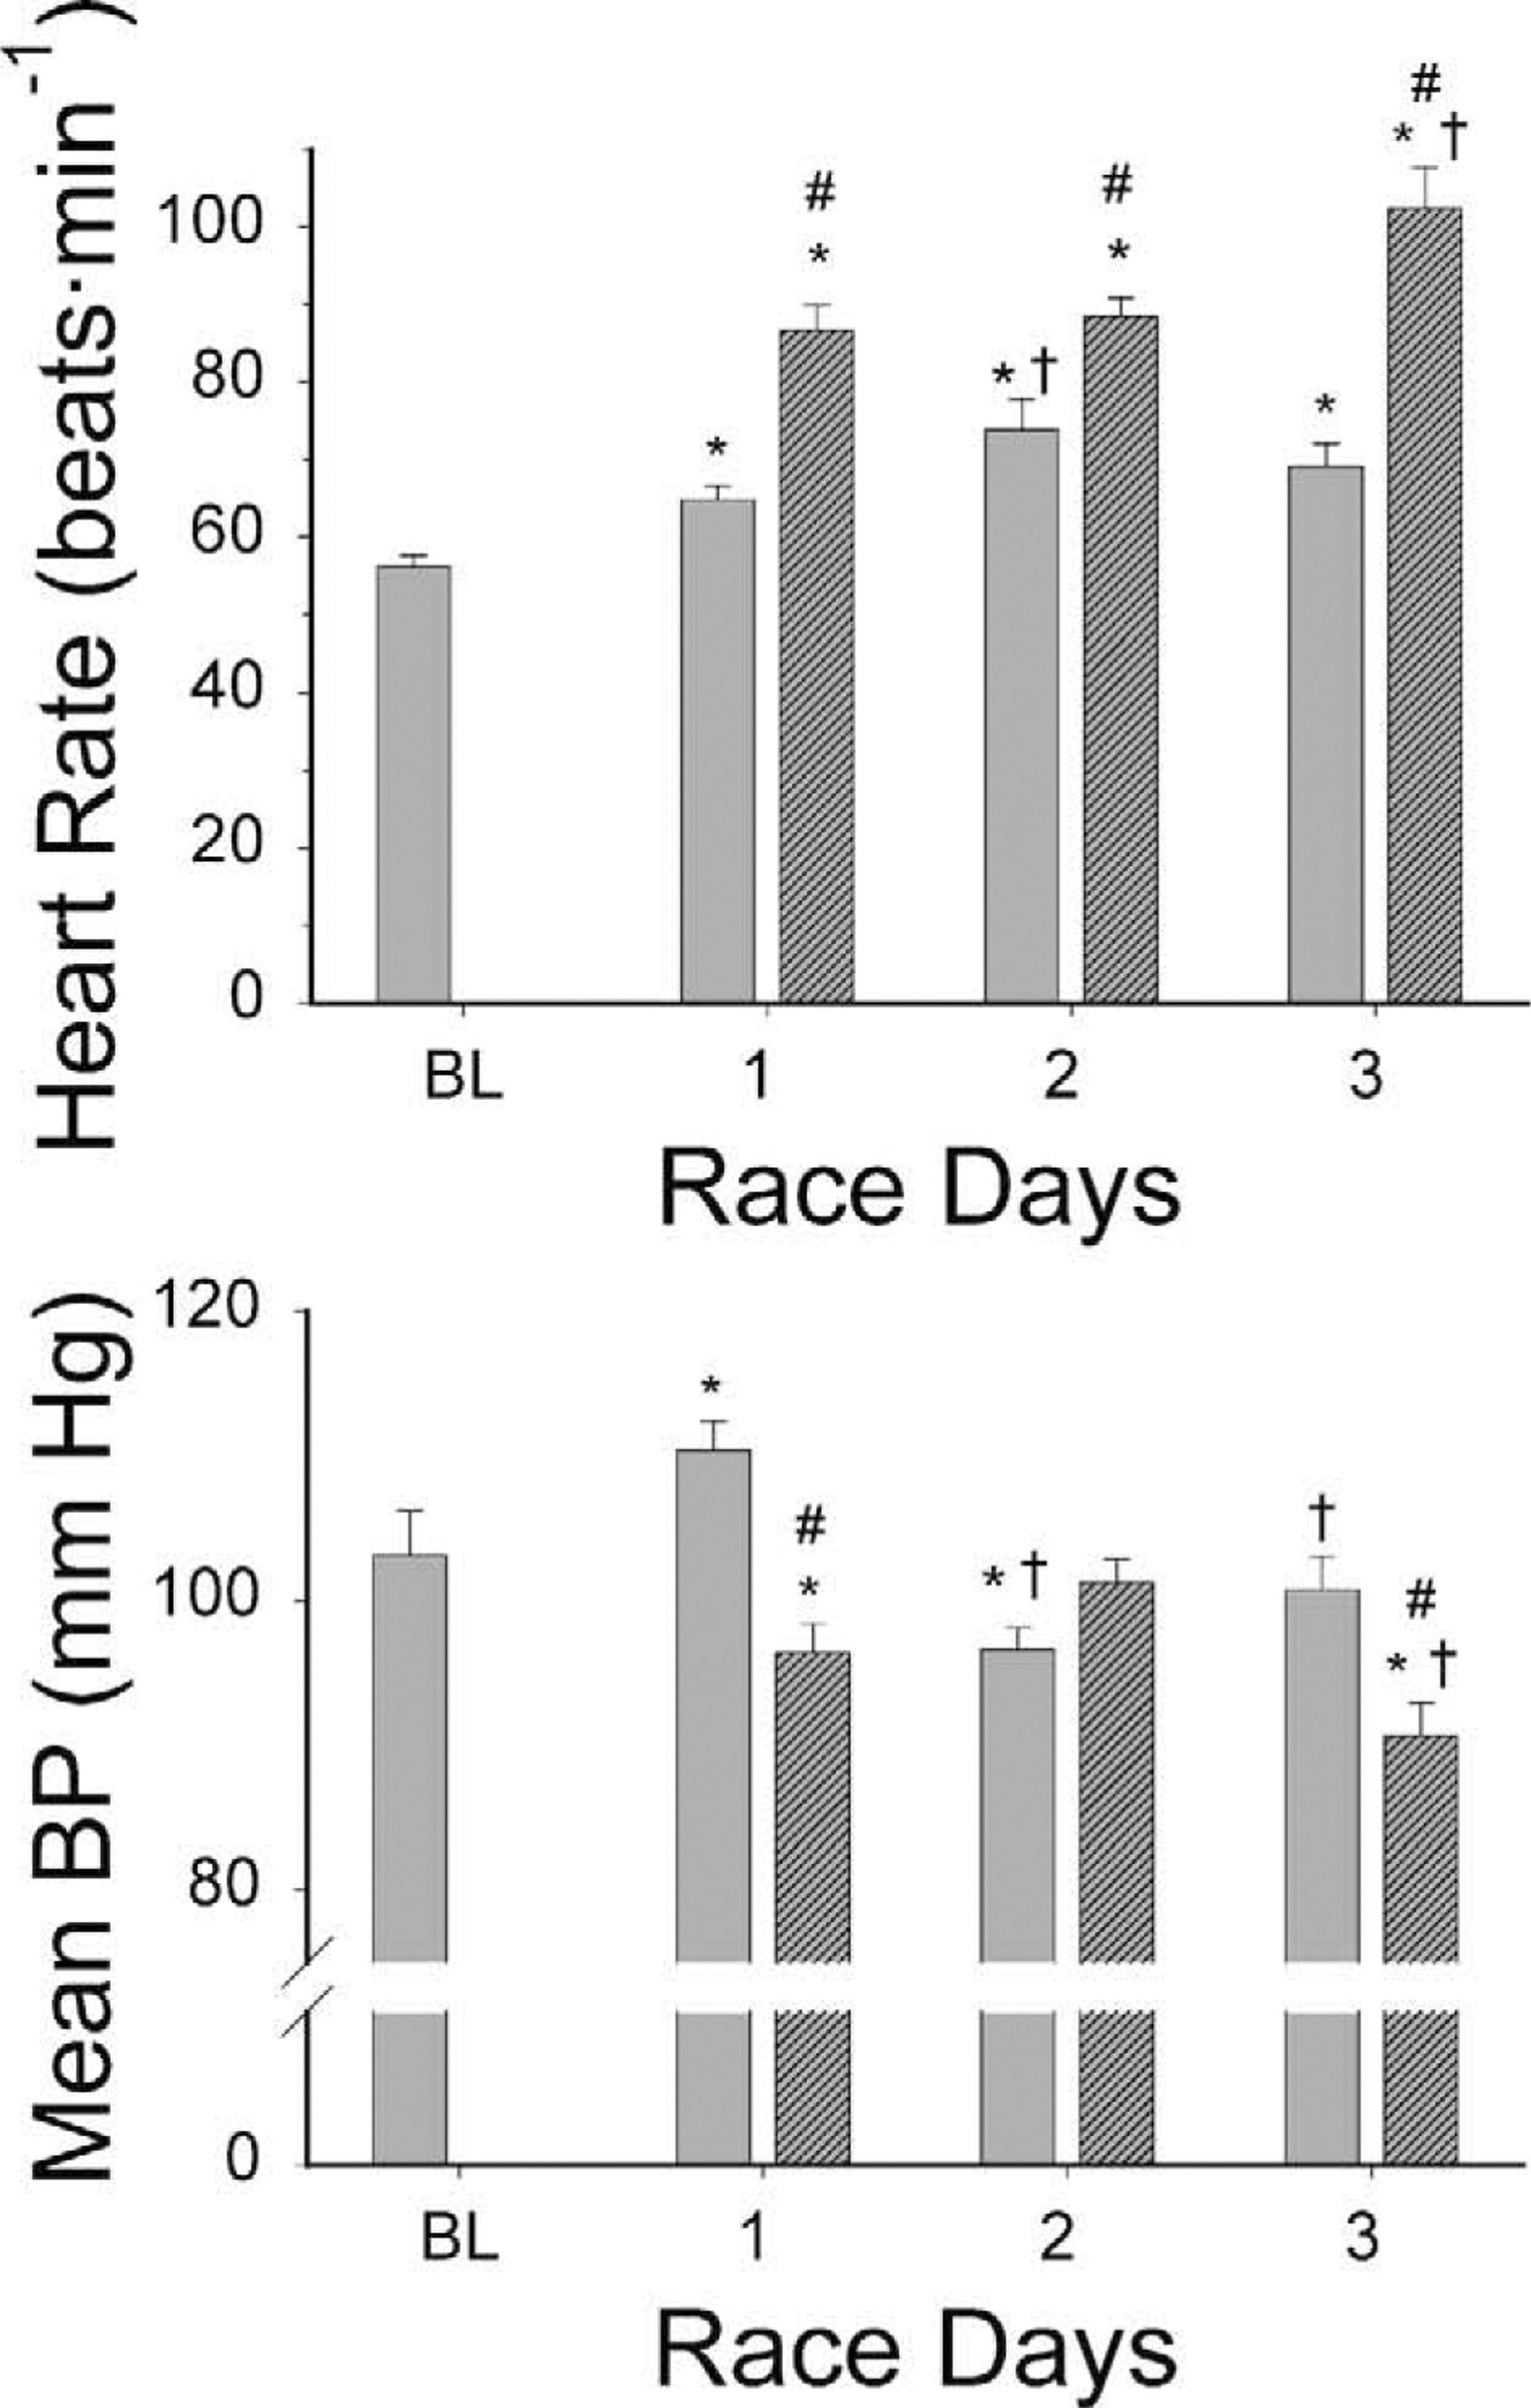
Heart rate (top) and mean arterial blood pressure measurements (bottom) 2 days before competition (baseline, BL) and within 30 minutes before the beginning of each day (prerace, solid bar) and within 10 minutes of finishing each day (postrace, hatched bar). Significance (P < .05) from BL (*), prerace (#), or similar day 1 measurement time (†). BL indicates baseline.
The mean baseline resting MAP was 103 ± 3.1 mm Hg, with the highest mean value being observed immediately before the start of the first stage (110 ± 2.0 mm Hg). The lowest race MAP was recorded on day 3 immediately after completion of the run (91 mm Hg). Prerace MAP was significantly higher than baseline on day 1 and lower on day 2 (P < .05 for both) (Figure 1).
Correlations with Total Race Time
Linear regression analysis of cardiopulmonary function data indicated a lower baseline resting HR (r = 0.77, P = .021) significantly correlated with a faster total race time. A lower MAP immediately before the race on day 1 was also indicative of a better total race time (r = 0.67, P = .036). No baseline pulmonary or other cardiovascular data were significantly associated with performance.
Linear regression analysis of the change in cardiopulmonary function (difference between baseline and final value on day 3) with total race time in each athlete indicated a negative correlation for FEV1.0 and PEF (Figure 2). Changes in HR and MAP were not associated with total race time.
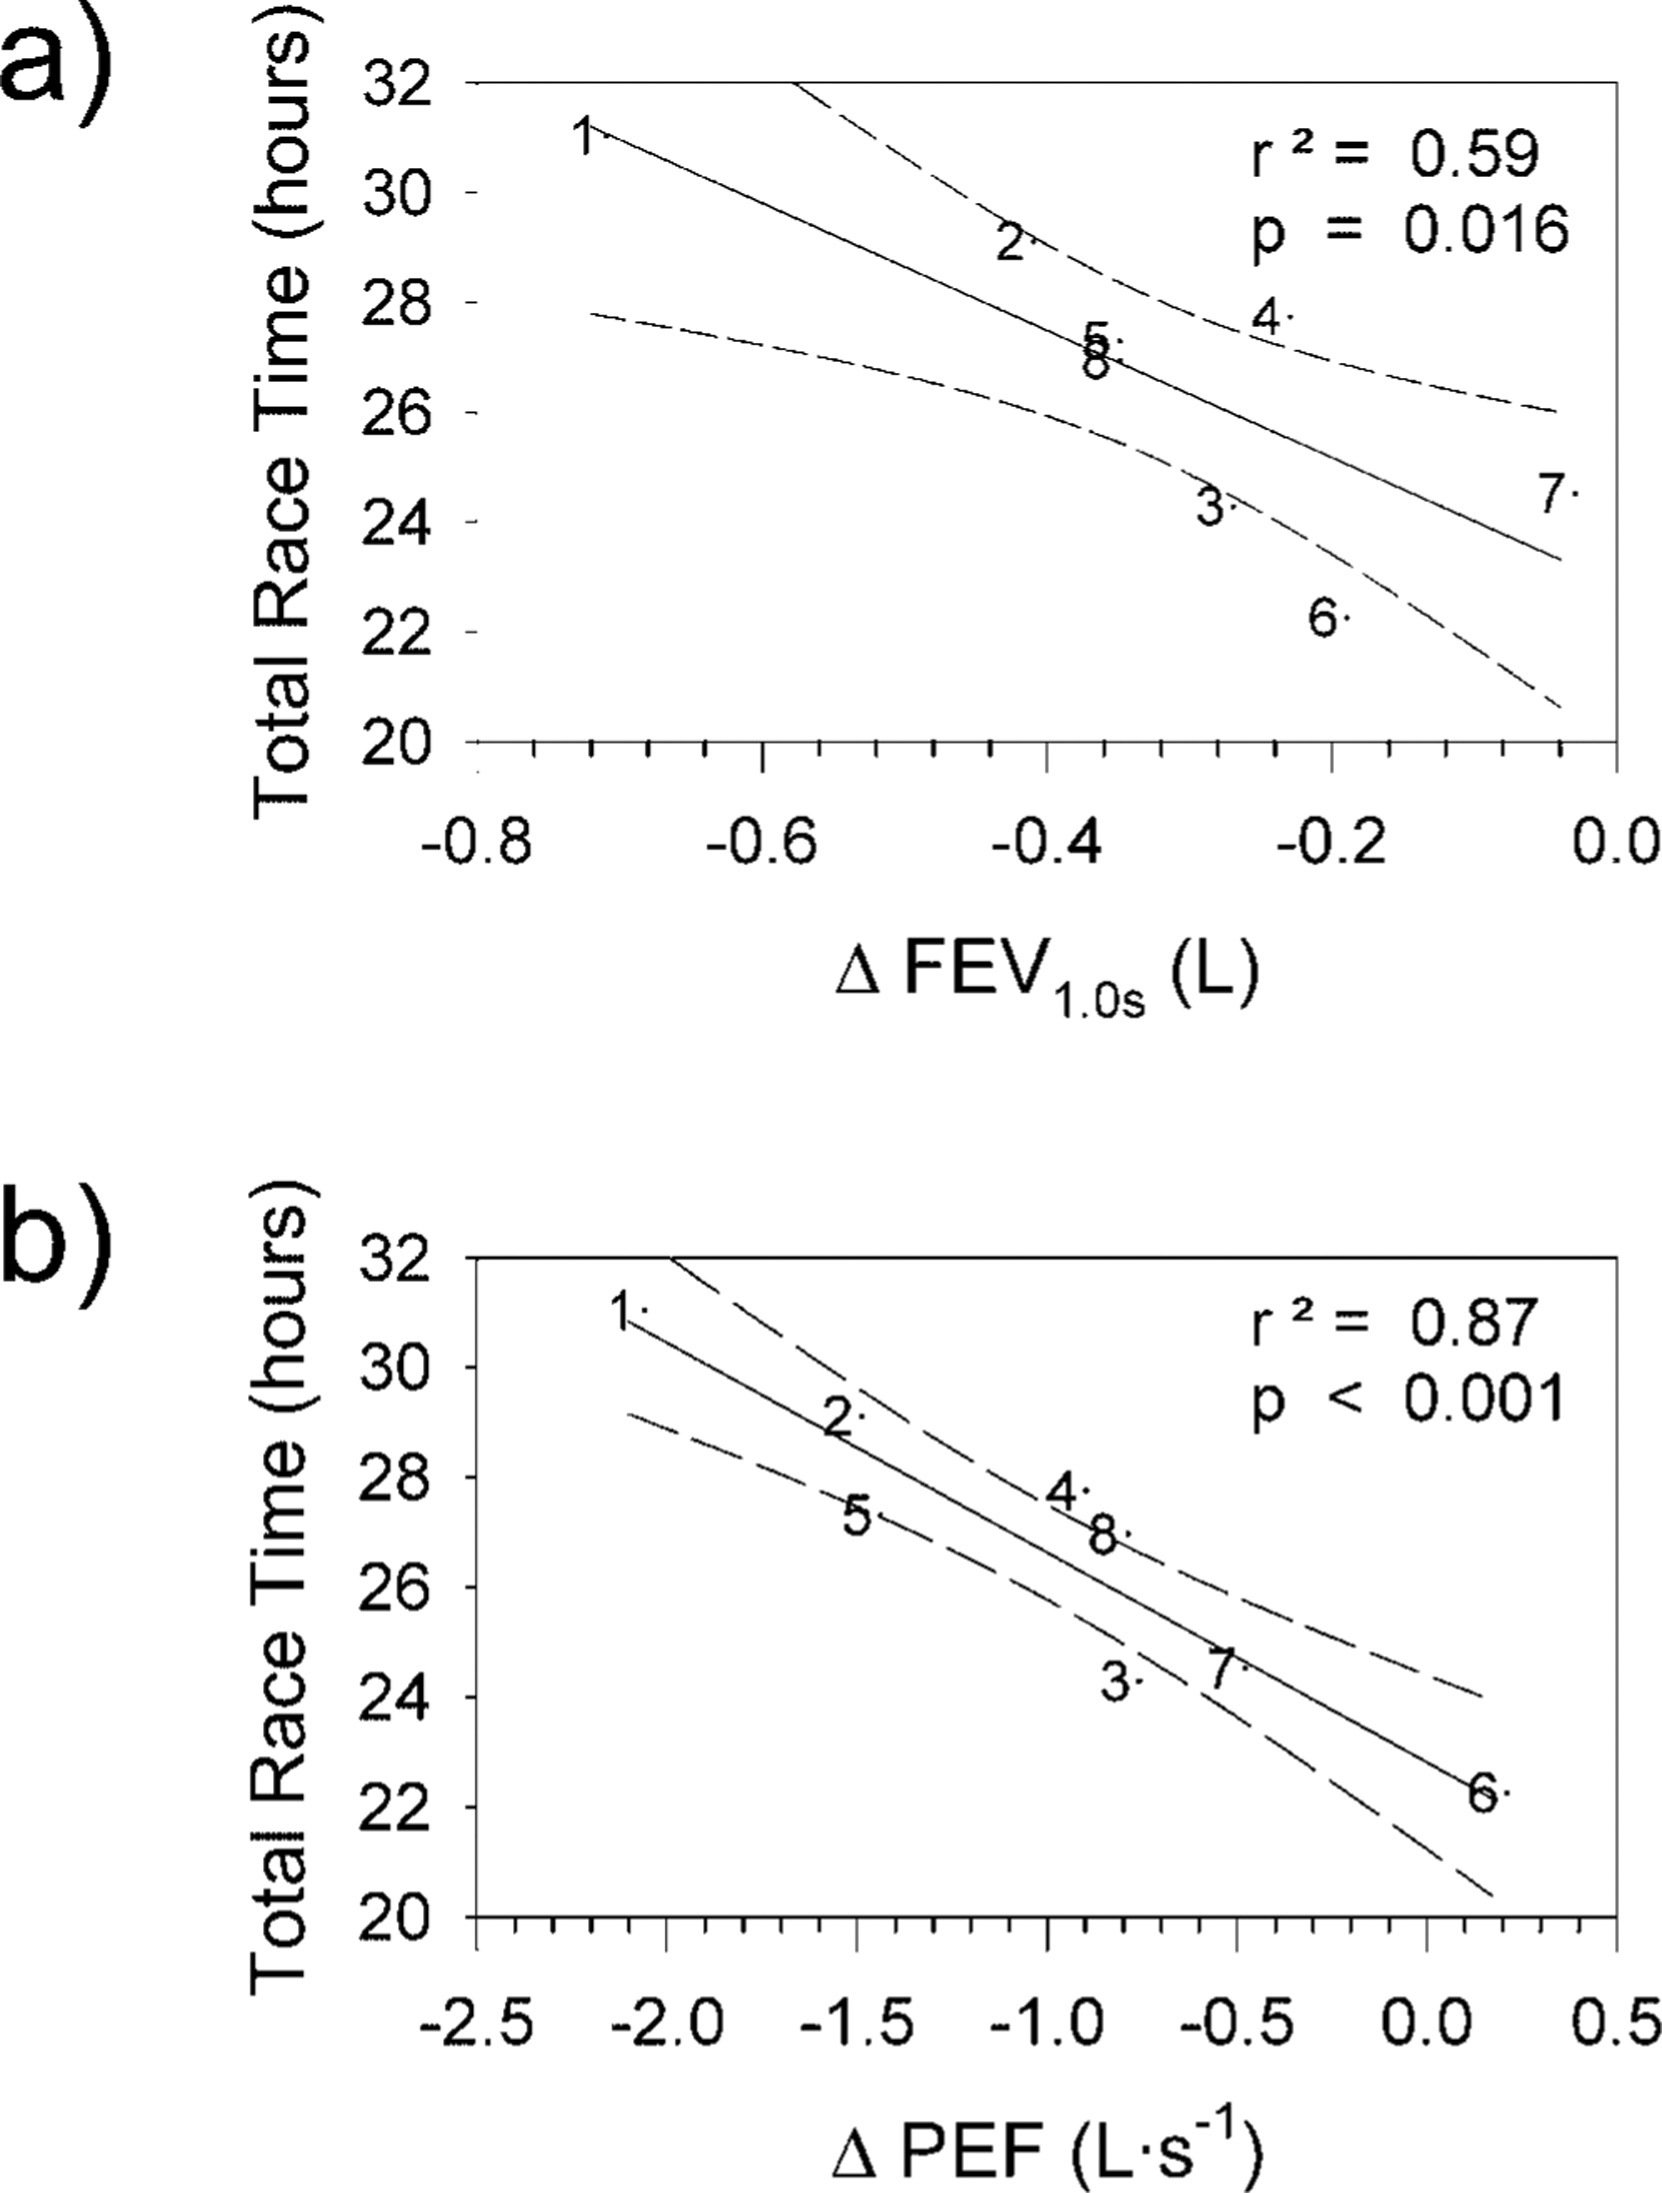
Changes in pulmonary variables from baseline at the finish of the race that were correlated with total race time are presented with their respective linear regressions.
Multiple regression analysis of baseline physiological data with respect to total race time elucidated some predictors of performance (Figure 3). When only baseline physiological data were used, HR and MAP were found to have the greatest contribution to total race time prediction in decreasing order of contribution (54% and 19%, respectively; Figure 3). When changes in pulmonary function from baseline to postrace were added, the decrease in PEF became the only variable entered into the model and accounted for 87% of the variance. This gave a result that was the same as presented in Figure 2b.
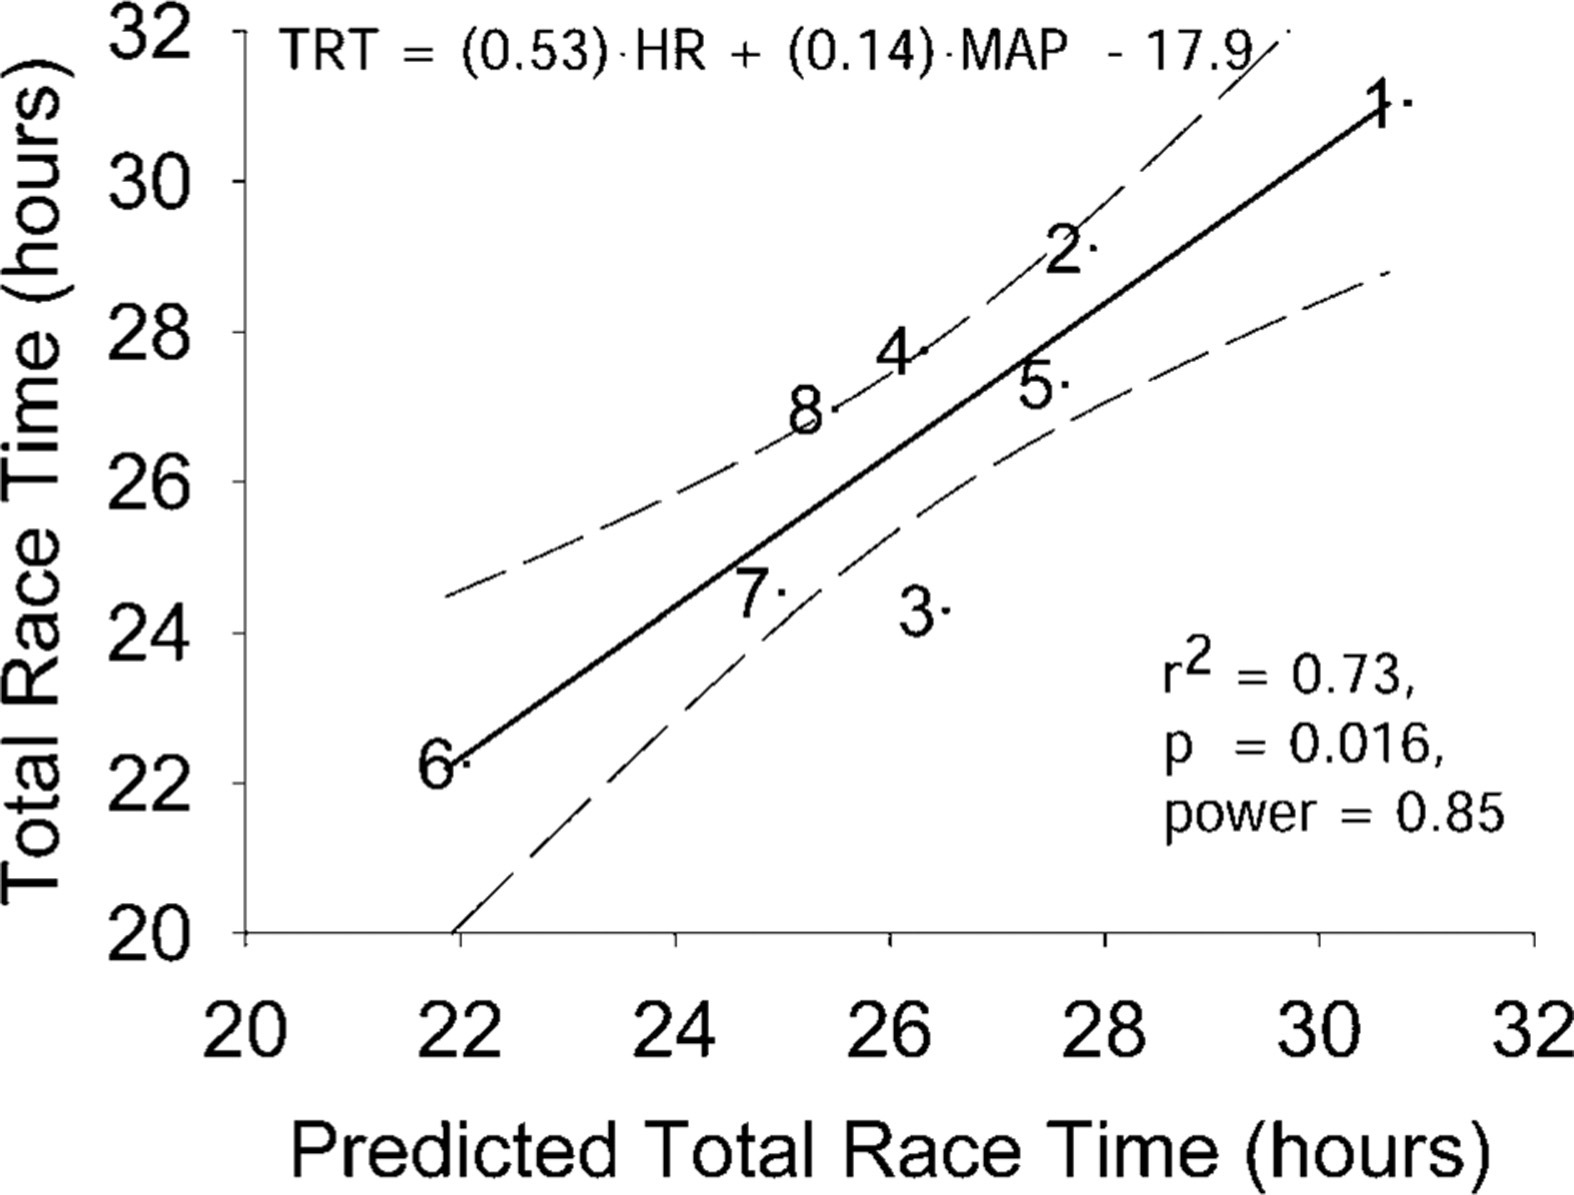
Baseline cardiopulmonary data were used in a multiple regression analysis for predictors of total race time (TRT). When only baseline data were used, heart rate (HR) and mean arterial pressure (MAP) were combined to produce the best prediction.
Discussion
To our knowledge, this is the first study to investigate cardiopulmonary changes during a multiday ultratriathlon event and their possible relationship to performance. The 8 volunteer competitors who finished ranged from the 1st to 16th place. Thus, the athletes who were studied represented the performance elite among this exceptional group.
Pulmonary function measures all showed a decline from baseline to postrace on day 3. Compared with baseline, both FVC and FEV1.0 were reduced on all 3 race days, whereas PEF was reduced only on days 1 and 3. Similar reductions in flow rates have been documented for Ironman competitors 7 and after a wilderness multisport competition.4,8 Respiratory muscle fatigue could explain the diminished flow rates observed and has been documented after exercise if the intensity level is high or the duration is prolonged to exhaustion.3,7,8 The further decline of FVC and FEV1.0 on day 3 could be due to both performing the more cardiorespiratory-demanding 85-km run to near exhaustion on day 3 and the cumulative effects of 3 days of fatiguing competition. Respiratory muscle fatigue induced before high-intensity exercise has been shown to reduce subsequent performance. 9 Notwithstanding the small sample size, we observed a relatively strong correlation of decrements in pulmonary flow rates with total performance as well as a strong predictive association (87%) of the reduction in PEF, from baseline to race finish, to total race time.
The reduction observed in FVC after each day has also been documented after completion of a marathon 10 and Ironman triathlon. 7 Respiratory muscle fatigue could also explain the lung volume reduction. Weaker respiratory muscles would fail to expand or reduce thoracic volume against the large elastic counter forces at each extreme of lung volume. Some studies indicate a higher residual volume after long-duration running, suggesting the presence of an expiratory limitation. 10
The athletes’ average baseline HR was 56.5 ± 1.5 beats/min. Within 30 minutes before the start of each day of racing, the average HR was elevated (Figure 1). The anticipatory excitement of the race would certainly account for the elevation. As would be expected, within 5 minutes of finishing each day, HR was still elevated above prerace levels. The largest pre- to postchanges in HR and MAP occurred on day 3. This was not surprising because the run not only was the most physically demanding of the 3 stages but also was the last stage and therefore the final event to improve race position. Furthermore, even though the athletes were allowed to hydrate at will during the race, there may have been a tendency for a decrease in intravascular volume during the run compared with the previous stages of the race, which could have led to a greater increase in HR.
Mean arterial pressure, compared with baseline, was elevated half an hour before the start of the competition on day 1. A similar observation was made before a 100-km ultramarathon. 3 There was also a significant positive correlation between MAP at the beginning of day 1 and total race time but not on any other days, whereas baseline HR, and not day 1 HR, was positively correlated with total race time. Elevated MAP could also be attributed to race anxiety or anticipation, yet only day 1 MAP, not day 1 HR, correlated with total race time just before the start of the competition.
After 3 days and more than 22 hours of intense exercise in air temperatures up to 37°C, the Ultraman triathletes displayed a substantial reduction in pulmonary function. The degree of PEF and FEV1.0 decrements, along with baseline resting HR and MAP, were predictive of the overall ranking in the triathlon. The most significant finding was the multiple regression result indicating that the decrease in PEF was associated with 87% of total race time correlation. This association, though just correlative, suggests a link between pulmonary function and ultratriathlon performance. This study was limited in its inability to utilize perturbations and continuous measurements to make a more causal relation between pulmonary function and performance, as these highly competitive elite athletes were unwilling to make large time commitments or perform activities that could have impeded their performance. However, these data do provide evidence to further pursue, in laboratory and field conditions, the interrelationship between pulmonary function and physical performance in events or situations that require extreme aerobic and physical endurance.
Footnotes
Acknowledgments
The authors specifically thank Stephen Braham for his technical assistance, Jane Bockus (Ultraman Race Director), Nancy Westrom (site coordination and accommodations), and the subjects for their cooperation and efforts. The spirometer used in this study was supplied by the manufacturer (Jaeger Toennies GmbH). The manufacturer had no involvement in any other aspect of the study.
Funding
The Environmental Physiology Unit, and Aerospace Physiology Laboratory, Simon Fraser University, provided financial and technical support.