
Abstract
In the present work, we used the computer numerically controlled (CNC) ring-spinning frame to produce the color-blended slub yarns made from three different colored rovings with a 10% blending gradient. The blending ratio of rovings was determined by Kubelka-Munk (K-M) double constant theory. The as-manufactured yarns were made into knit fabrics with a circular knitting machine. The relative value method was used to solve the absorption and scattering coefficients of each colored fiber, and the least-square method was used to solve for the blending ratio of color-blended slub yarn. The results show that the average color difference between predicted and measured L*a*b* values was 1.74, and the error of the blending ratio was 7.38%, which are within the acceptable ranges for color matching of yarns.
Introduction
The computer numerically controlled (CNC) ring-spinning frame system implements the digital control technique into the ring-spinning frame, which controls the feeding speeds and yarn line density in real time.1-3 The CNC ring-spinning frame can manufacture color-blended yarn based on three primary colors. The color blending effect of the yarn is given by the spiral arrangements of different colored fiber strands along the yarn axis. 3 The blended color is formed so that there are simultaneously different colored fiber strands in a certain area. 4 The complexity of fiber arrangements in color-blended yarn leads to the color blending effect, which becomes the keystone of developing color-blended yarn products. Therefore, the CNC ring-spinning technique with the color-matching algorithm improves the accuracy and reliability of color-blended yarn production.
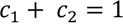
Computer color matching is based on the standard colorimetric system,5,6 where the main focus is on the optical models and related algorithms. The optical model is used to establish the relationship between the reflectance of the yarn or fabric and the reflectance of the single-colored fibers that make up the yarn or fabric. Duntley 7 proposed that the total reflectance of fiber blends at a certain wavelength should be equal to the product of the reflectance of each single-colored fiber that makes up the fiber blends. However, the color blending effect of single-colored fibers is different from the additive color mixing rules of colored light and the subtractive color mixing law of dyes. The additive and subtractive color mixings change the original colors of colorants after mixing; however, when various colored fibers are blended, there are no changes in the original colors of the fibers. The color blending effect of the blends of fibers with various colors depends on the physiological human visual system, 8 which is difficult to describe with simple models. Kubelka and Munk 9 derived the relationship among the concentration of components, optical reflectance, scattering coefficient, and absorption coefficient 10 based on additive features of the optical absorption and the scattering of colorants. In particular, Kubelka-Munk double constant theory (K-M theory), which is mainly used for the color prediction of multiple colorant combinations, consists of two different solving methods: the least square 11 and relative value methods. 12 In the former case, the scattering and absorption coefficients of various colorants are used to solve for the optical constants of a colorant mixture; in the latter case, the scattering coefficients of one colorant is set to be 1 under different wavelengths. Then, the optical constants of the other colorants are determined.
Slub yarn is a type of fancy yarn made by periodically changing the linear density of the yarn during the spinning process. 13 In the conventional approach, the base yarn and slubs share the same drafting channel, which greatly limits the aesthetic characteristics of slub yarn. The multichannel drafting approach uses three independent feeding rollers, which can regulate the color blending effect in different sections of the slub yarn3,14 to enhance the attractiveness and appearance of the fabric.
In the present work, K-M theory was used for the color prediction of color-blended slub yarns prepared at various blending ratios, which were subsequently woven into fabrics.
The spectral reflectance of fabrics at different wavelengths was measured, and the relative value method was used to solve for the absorption and scattering coefficients of each colored fiber. Then, the least square method was used to predict the blending ratios of color-blended slub yarns. Finally, we manufactured a series of color-blended slub yarns and analyzed their structural parameters.
KM Theory Model
The theoretical expression of K-M theory is shown in Eq. 1. 15
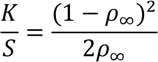
K and S are the absorption and scattering coefficients of the sample, respectively, and ρ∞ is the reflectivity factor when the thickness is infinite.
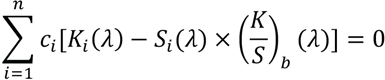
K-M theory is based on the assumed conditions and only involves reflectance, and absorption and scattering coefficients, which limits its application. K-M theory was established according to the K/S additivity, which assumes that dye molecules dissolve in fibers, and the dye concentration is negligible. Therefore, it can be expressed as Eq. 2.
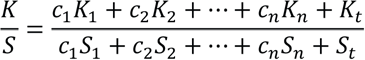
c1, c2…cn are the dyeing ratios (blending ratio of each fiber component in fiber blends), Kn and Sn are the absorption and scattering coefficients of different colored fibers, respectively, and Kt and St are the absorption and scattering coefficients of the substrate, respectively.
Therefore, to apply K-M theory, the absorption and scattering coefficients of each colored fiber are required, which can be obtained by solving the coupled Eqs. 3 and 4.
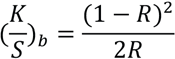
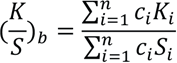
R is the reflectance of the color-blended fabric at a specific wavelength λ, and (K/S)b is the K/S value of the color-blended fabric.
(K/S)b can be obtained using Eq. 3 by measuring the reflectance of the color-blended fabric. The absorption coefficient K and scattering coefficient S of each colored fiber are then determined using Eq. 4. Therefore, if the color-blended fabric contains two colored fibers, we have Eqs. 5 and 6.
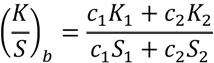
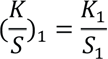
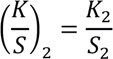
(K/S)1 and (K/S)2 are the K/S values of two colored fibers, K1 and K2 are the K values of two colored fibers, and S1 and S2 are the S values of two colored fibers. Combining Eqs. 5–8, we obtain Eqs. 9 and 10.
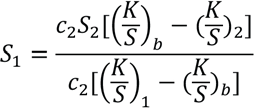
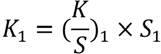
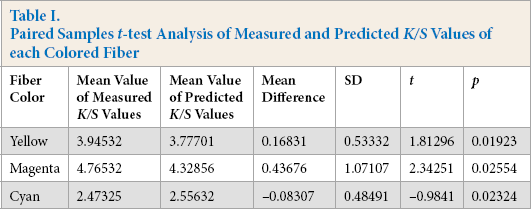
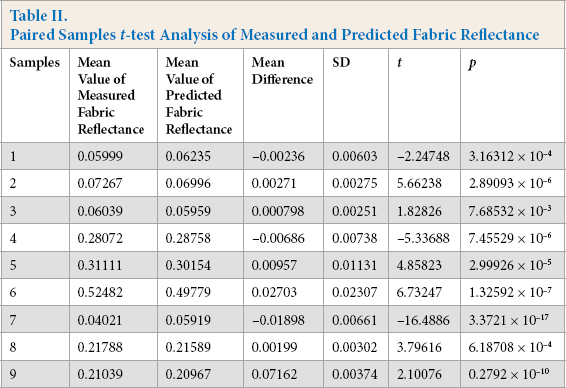
By measuring the reflectance of the blends of colored fibers and color-blended fabrics at a specific wavelength, (K/S)1, (K/S)2, and (K/S)b can be obtained using Eq. 3. If the scattering coefficient for one fiber component is set to be 1 (i.e., S2= 1), K2 is calculated by substituting (K/S)2 into the left side of Eq. 7. Subsequently, K1 and S1 are determined using Eqs. 5 and 6. Hence, we obtained the K and S values for each colored fiber. The predicted K and S values are not the actual K and S values, since we assumed that the scattering coefficient of one fiber component is 1. However, their relative K/S value remains the same, which is known as the relative value method. 16 Based on the predicted K and S values of each colored fiber, the K/S value of the color-blended fabric at each wavelength can be obtained using Eq. 5, which was used to predict the reflectance of the color-blended fabric by Eq. 3. shows that differences between the predicted and measured K/S values for each colored fiber at various wavelengths were small. By performing the paired-samples t-test analysis of predicted and measured K/S values for each of the colored fibers, we found insignificant differences between predicted and measured K/S values (Table I). Fig. 2 shows that the predicted fabric reflectance (shown as filled symbols) was consistent with the measured fabric reflectance (shown as unfilled symbols), which verified the accuracy of the predicted K and S values. This result was further supported by the paired-sample t-test analysis of measured and predicted fabric reflectance in Table II, which indicated a statistically insignificant difference between measured and predicted fabric reflectance.
Paired Samples t-test Analysis of Measured and Predicted K/S Values of each Colored Fiber
Paired Samples t-test Analysis of Measured and Predicted Fabric Reflectance
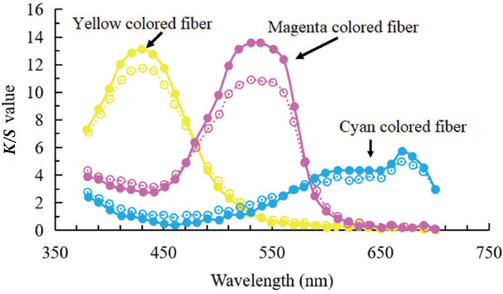
K/S values of each colored fibers (yellow, magenta and cyan) under different wavelengths, where the filled cycle represented the measured K/S values while the unfilled cycle represented the predicted K/S values.
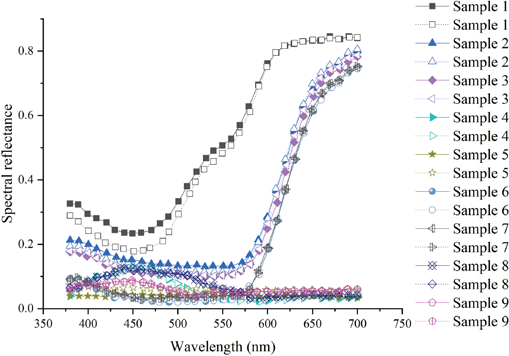
Comparison of measured and predicted (dotted line) reflectance of color-blended fabrics. The representative samples corresponded to samples 1-9 in Table II.
To obtain the optimized blending percentages of each colored fiber, Eq. 2 can be rewritten as Eq. 11.
Eq. 11 can be further expressed by Eqs. 12–15.

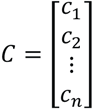
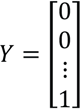
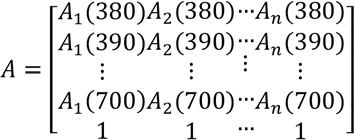
Y corresponds to the right side of Eq. 11, C corresponds to ci in Eq. 11, and A corresponds to the Ki(λ) - Si(λ) × (K/S)b(λ) of Eq. 11. A1, A2, …, An are given by Eq. 16.
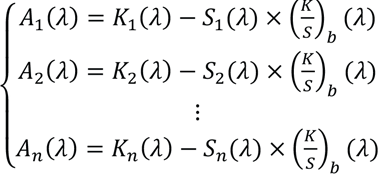
K1, K2, …, Kn and S1, S2, …, Sn are the absorption and scattering coefficients of each colored fiber, respectively.
The least-squares method was used to determine the dyeing ratios of each colored fiber using Eq. 17.
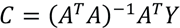
Thus, we obtained the optimized blending percentages for each colored fiber, which are used to manufacture color-blended slub yarn based on the self-developed ring-spinning frame as described in the next section.
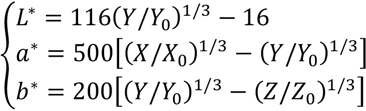
To verify the accuracy of the model, we calculated the L*a*b* values in CIELab 1976 color space by solving the coupled Eqs. 18 and 19.17,18
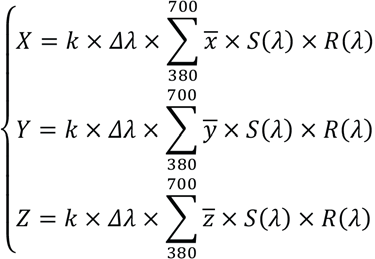
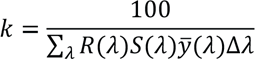
X, Y, and Z are the measured tristimulus values of the actual sample, X0, Y0, and Z0 are the tristimulus values of the reference white points, S(λ) is the spectral power distribution of the light source,,, and are the CIE tristimulus color values; Δλ is the wavelength interval and was set as 10 nm; and k is the normalized constant. X/X0, Y/Y0, and Z/Z0 must be greater than 0.000885619 to satisfy the cube root relationship between the Munsell value functions and the measured tristimulus values. Substitution of the cube root relationship into the Adams-Nickerson formula gives the color-difference formula (Eq. 20). 19
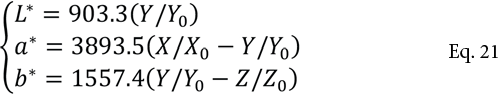
When X/X0, Y/Y0, and Z/Z0 are less than 0.008856, the linear extrapolation was applied to map Y/Y0 = 0 to L* = 0. As a result, the color-difference formula in Eq. 21 was obtained. 20
The color difference (ΔE) of CIELab 1976 was given by Eq. 22.

ΔL, Δa, and Δb are the differences between predicted and measured L*a*b* values in CIELab 1976 color space.
Several color-blended slub yarns were prepared from the combinations of three primary subtractive colors (cyan (C), magenta (M), and yellow (Y)) at various blending ratios. The sample preparation and measuring procedures are given in the next section. By setting the scattering coefficient of the cyan fiber at each wavelength to 1, the K and S values of yellow and magenta fibers at each wavelength were calculated using the above relative value method. The actual and predicted blending ratios, measured and predicted L*a*b* values in CIELab 1976 color space, and color differences are shown in Table III. The prediction accuracy was analyzed by calculating the average color difference, the distribution of color difference, and the error of the blending ratio of the samples. The error of the blending ratio was calculated using Eq. 23. 21
Prediction Results based on K-M Double Constant Theory
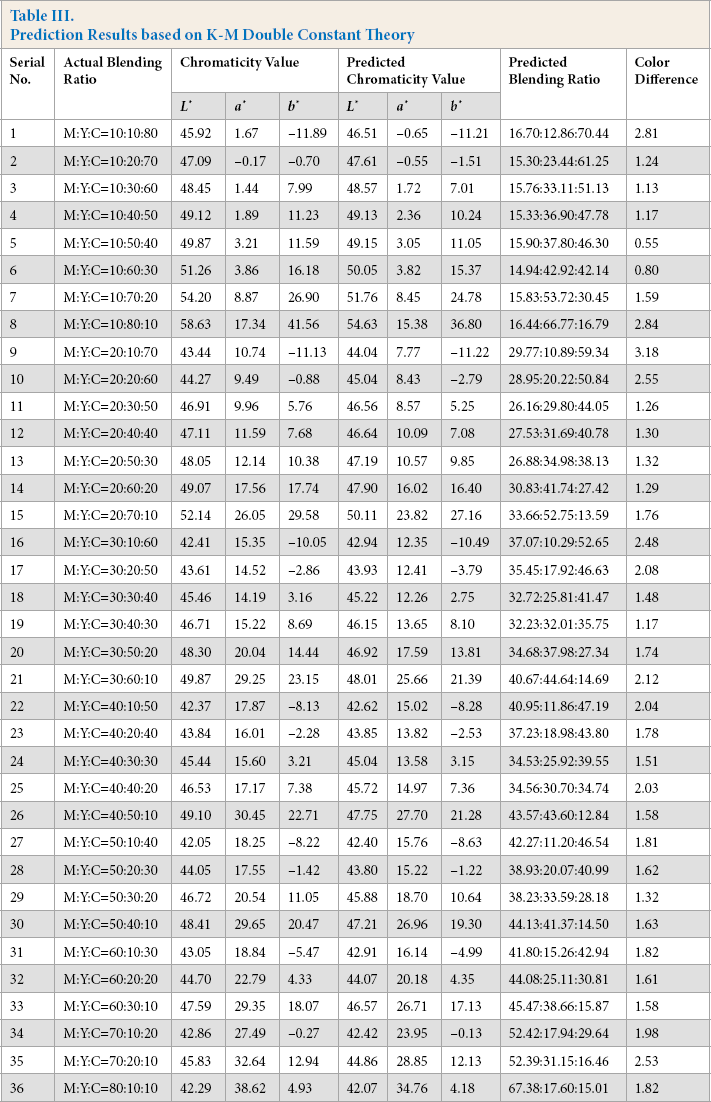
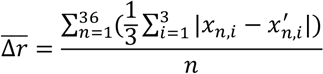
xn,i is the actual blending percentage of the ith single-colored fiber in the nth color-blended fabric, x′ n,i is the predicted blending percentage of the ith single-colored fiber in the nth color-blended fabric, and n is the total number of samples.
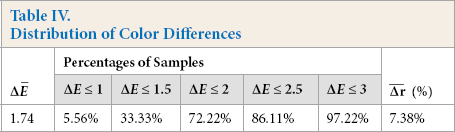
Table IV shows that the average color difference (ΔE) value predicted by the K-M theory is in the acceptable range. For most samples, the color differences were less than 2. The error of the blending ratio was small, which verified the accuracy of the model for color prediction.
Distribution of Color Differences
Materials and Methods
The self-developed CNC ring-spinning frame has three independent back rollers, which form three drafting channels. Photographs of the CNC ring spinning system are provided in Fig. 3. By changing the drafting ratios of feedstocks, one can manipulate the linear density and blending ratio of yarns. The programmable logic controller (PLC) regulates the speeds of the front, middle, and back rollers.
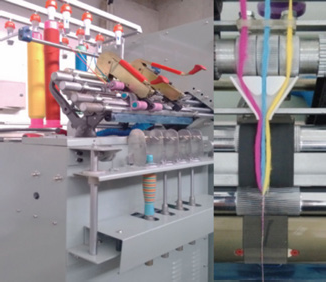
Photographs of the self-developed ring-spinning frame.
The photoelectric encoder detects the real-time running parameters and sends them to the PLC. The PLC compares the measured rotor speed with the preset speed. If the deviation exceeds a threshold value, the PLC adjusts the rotor speeds to enforce the articulated motions of the servomotors.
To manufacture the slub yarns, the speeds of the back rollers are periodically increased (i.e.,). The linear density of a slub yarn can be written as Eq. 24. 22
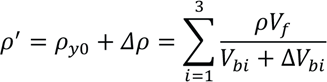
ρ
The slub multiplier 23 is defined as Eq. 25.
where ρstub and ρbase yarn are the linear densities of the slub and base yarns, respectively.
The climate conditions were 23-30 ? and 53-58% relative humidity (RH) throughout slub yarn production. The base yarn count was 19.4 tex. The spindle speed was set to 6000 rpm, the slub distance was set to 125 mm, the slub multiplier was set to 2, and the twist coefficient was set to 340. The slub yarn samples were produced by using a ring spinning frame, which was modified based on the JWF1551 ring spinning frame.
Color-blended slub yarns were spun with the 10% gradient combination of three primary colored rovings, as shown in Table I. The uniformity ratio, length, and strength of cotton fiber were 45.2%, 27.1 mm, and 22.3 cN/tex, respectively. The unevenness CVm of the roving was 3.19%. The dyes used were C.I. Reactive Red 195 (Reactive Red M-2BF), C.I. Reactive Blue 72 (Reactive Blue PX-GR), and C.I. Reactive Yellow 176 (Reactive Yellow 3RS), which were purchased from Taopri Ltd. (Zhejiang, China). Each sample was 30 × 30 cm, and the fabric had a density of 120 g/cm2 as fabricated by a 16G Hongcheng HC21K-type circular knitting machine (single jersey). Specifications of the knitted fabrics are as follows: the loop length was 0.6 mm, and the fabric densities in the course wise and wale wise directions were 53 wales/5 cm and 90 courses/5 cm, respectively.
The fabric colors were measured using a Datacolor 650 color measurement spectrophotometer (large aperture/ specular component included/UV inclusive). Twelve knitted fabric samples at each blending ratio were taken as the test objects. For each sample, 36 different locations of fabric were selected for the measurements, and the average values were taken for analysis. The spectral reflectance and L*a*b* values in CIELab 1976 color space of the fabrics were measured at specified wavelengths from 380 nm to 700 nm with a wavelength interval of 10 nm, 30-mm aperture, 100% ultraviolet (flter of), and D65/10° illuminant. During color testing, the samples were folded into four layers to ensure that light did not directly transmit through the fabric.
The yarn strength was measured using a YG068C fully automatic single-yarn strength tester (Suzhou Changfeng Textile Mechanical and Electrical Technology Co. Ltd., China) according to GB/T14344 (testing method for tensile of manmade filament yarns). The evenness of the yarn was measured using an Uster YG135G (Shaanxi Changling Textile Mechanical And Electrical Technology Co. Ltd., China) instrument at a speed of 200 m/min. The yarn hairiness was measured using a YG172A (Shaanxi Changling Textile Mechanical And Electrical Technology Co. Ltd., China) hairiness tester. The slub length and distance were measured with a 20-cm ruler to an accuracy of 0.1 cm. We used eight bobbins to collect samples. For each bobbin, the slub length and distance were measured twenty times, and the average slub length and distance for all samples were obtained. The yarn twist was determined by the untwist/retwist method using a conventional twist tester, and the average yarn twist for all samples was obtained.
We used the manual method to determine the slub multiplier. 15 In total, 160 different samples from eight bobbins were collected, and the slub and base yarn sections, excluding ramp sections, were cut into many parts. The total length of parts for any sample was greater than 1 m. A precision balance with a 0.01-mg sensitivity was used to measure the weights of the slubs and base yarns, and the average counts for slubs and base yarns of all samples were obtained. Finally, the slub multiplier was calculated according to Eq. 25.
Results and Discussion
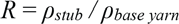
Fig. 4a shows photographs of color-blended knitted fabrics used as the reference samples, and Fig. 4b shows the as-manufactured color-blended slub yarns based on the color matching algorithm and use of the CNC ring spinning frame. The colors of the as-manufactured color-blended slub yarns are very consistent with those of the color-blended fabrics, which indicates the reliability and validity of the proposed method to manufacture color-blended slub yarns using the CNC ring-spinning frame with the K-M theory.
(a) The color-blended knitted fabrics and (b) the as-manufactured color-blended slub yarns using the color matching algorithm.
In actual production, the structural parameters of slub yarn, such as the slub multiplier, slub distance, and slub length, determine the fabric appearance and affect its mechanical properties. Therefore, we analyzed the variation of structural parameters.
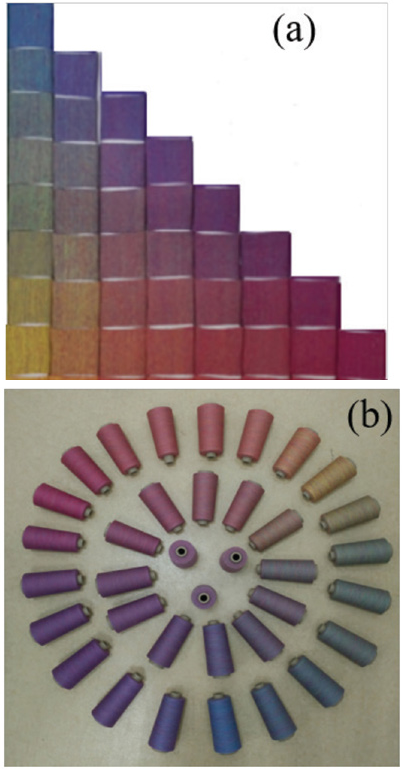
Fibers with different physical properties have different motion patterns in the drafting zone, which result in different slub lengths. To investigate the effect of fiber materials on the slub length, the slub yarns were made with three different fiber materials: cotton, polyester, and viscose. The specifications of three fiber materials are shown in Table V.
Physical Properties of Fibers in Slub Yarns
Fig. 5a shows that the actual slub length was always greater than the theoretical slub length, but the slub distance (i.e., base yarn length) was smaller than the theoretical one. Fig. 5b shows that the slub yarn made from cotton fibers had the largest deviations in slub length and base yarn length, followed by the viscose fibers, and then polyester fibers. Because the polyester fiber had the longest fiber length and better length uniformity, there were fewer loose fibers during drafting, and there was better controllability to configure fibers in the drafting zone. Cotton fiber had the shortest fiber length and poorer uniformity in length distribution, which resulted in more loose fibers in the drafting zone and drafting unevenness when variable roller speeds were used.
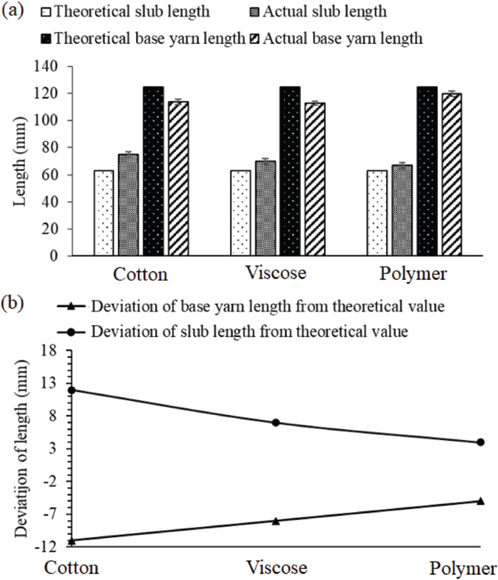
(a) Variation of the slub and base yarn lengths with respect to the fiber materials and (b) variation of the deviations of slub and base yarn lengths with respect to the fiber materials.
Fabric appearance can be altered by adjusting the slub multiplier, which varies the concavity and convexity of textile surfaces, since the change in slub multiplier changes the slub length and distance. Fig. 6 shows that the deviations of slub length and distance increased with the increase in slub multiplier. When the slub multiplier was 1.5, the slub length and distance had the smallest deviations from the theoretical values. When the slub multiplier was 2.5, the deviations in slub length and distance were maximal. There are always extra fiber strands fed into the front roller due to the moments of inertia of fiber strands in the drafting zone, which result in a long slub length and a short base yarn length. The moments of inertia of fiber strands increase with the increase in back-roller speed; therefore, a greater slub multiplier corresponds to larger slub length and distance deviations from their theoretical values.
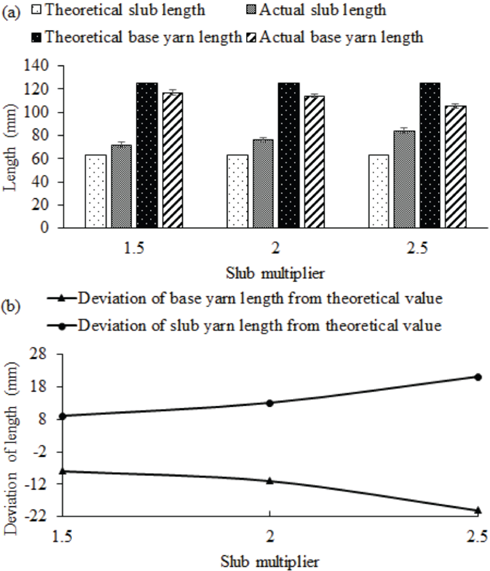
(a) Variation of the slub and base yarn lengths with respect to the slub multiplier and (b) variation of the deviations of slub and base yarn lengths with respect to the slub multiplier.
Fig. 7 shows that the actual slub multipliers were smaller than the theoretical values due to the periods of accelerating and decelerating the back rollers to produce slubs, 23 and their differences increased with the increase in linear density of a base yarn. According to Eq. 24, for the same slub multiplier, the increase in linear density of base yarn increases the linear density of the slub, so extra fiber strands are fed into the front roller. Consequently, it increases the deviation of the slub multiplier.
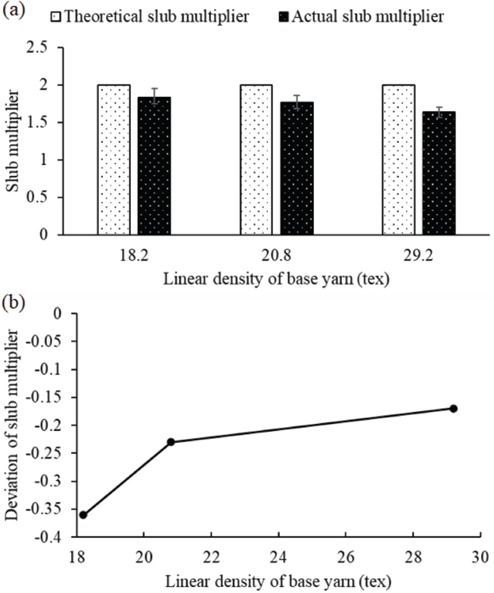
Variations of (a) the slub multiplier and (b) deviation of slub multiplier with respect to the linear density of a base yarn.
The slub multiplier can be varied by adjusting the feeding speed of the back rollers, which accordingly affects the deviation of the slub multiplier. Fig. 8 shows that under the same linear density of base yarn, the deviation of the slub multiplier increased with the slub multiplier. A greater linear density of the slub corresponded to a greater slub multiplier, which increased the time delay for producing slubs, causing more deviations.
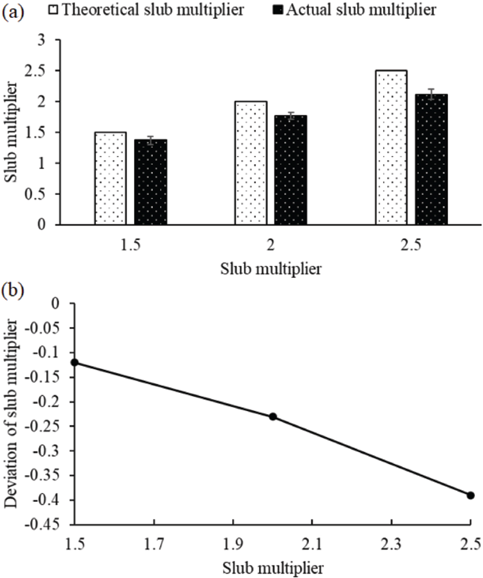
Variation of (a) the slub multiplier and (b) deviation of slub multiplier with respect to the slub multiplier.
Conclusion
Color-blended slub yarn has a strong potential for development because of its unique color appearance. In the present work, based on the CNC ring-spinning frame, we studied the color matching algorithm for color-blended slub yarn using the Kubelka-Munk double constant theory, which allows the intelligent production of color-blended slub yarns. Absorption and scattering coefficients were determined by the relative value method, which was combined with the least square method to predict the colors of color-blended slub yarns. We found that the average color difference and the error of blending ratios of color-blended yarns were in acceptable ranges, indicating the feasibility of the theoretical model.
Subsequently, a series of color-blended slub yarns was spun using the CNC ring-spinning frame with the established color-matching algorithm, and the manufacturing performance was evaluated by analyzing the structural parameters. The actual slub length was greater than the theoretical value due to the overfeeding of fiber strands into the front roller, and the deviation of slub length increased with the increase in slub multiplier. In contrast, the actual base yarn length was shorter than the theoretical base yarn length, and the deviation of base yarn length decreased with the increase in the slub multiplier. Due to the time periods of accelerating and decelerating the back rollers, the actual slub multiplier was less than the theoretical one, and the deviation increased with the increase in the linear density of base yarn, but decreased with the increase in slub multiplier.