
Abstract
Cotton woven fabrics were treated with three different silicone softeners. These softeners were applied on the fabric using the pad-dry-cure method. The hand value of treated fabrics was analyzed by determining bending length, crease recovery angle, and surface roughness and smoothness properties. With increased silicone softener concentration, an improvement in surface smoothness of the fabric was observed at a certain level, beyond which there were no significant changes in smoothness. Statistical analysis (ANOVA) was carried out to establish a relationship between the application of softeners at different concentrations on the bending length, smoothness, and crease recovery angle properties. A correlation was established between subjective and Kawabata analyses.
Introduction
Fabric smoothness-roughness has been considered as one of the principal factors of clothing comfort. It is also a significant factor in today's consumer buying decisions. 1 Fabric smoothness behavior is directly proportional to the fabric surface friction behavior. Fabric friction is defined as the resistance to motion. 2 Subjective fabric hand assessment is definitely influenced by the static and dynamic friction among the cloth surface and the thumb or finger, although other properties are also involved in the assessment. 3 The human finger is a delicate instrument equipped for distinguishing small contrasts in the frictional conduct of fabric. The results of hand tests are communicated in abstract terms (e.g., clingy, oily, soft, sleek, harsh, scratchy, sheer, sticky, and waxy) contingent on the feeling of touch. So, it is imperative to evaluate texture erosion quantitatively and, in addition, elements that may influence it. 4
The processing of textiles to accomplish a specific hand is one of the most basic parts of finishing. Softeners improve the hand, smoothness, elasticity, and antistatic and soil release properties of textiles. 5 The mechanism of cotton softening is well established. 6 Among many textile quality factors, smoothness is a very important property. 7
At the present time, standard or specified values for hand are not available. Stiffness and drape testers are used to test fabrics in terms of bending length and drape coefficient values, respectively. Choudhury 8 studied the effect of softeners on softness and established that the bending length decreased with increased softener concentration, indicating a reduction in fabric stiffness. Chattopadhyay and Vyas 9 found that silicone softener treatment on fabrics decreased the bending length, which was indicative of enhanced material quality.
Crease recovery refers to the ability of the fabric to return to its original shape after removing folding deformations. 10 The Kawabata tester is an instrument that measures frictional properties in terms of the frictional coefficient. The estimation of total hand value made by Kawabata is known as the KES-FB framework. 11 It is comprised of four specific instruments: FBI, FB2, FB3, and FB4.Tese instruments measure an aggregate of 16 parameters identified with tensile, compression, shear, bending, surface roughness, and friction properties. The fabric assurance by simple testing (FAST) device is nearly as straight forward as the KES-FB system. 11
Hasani and Behtaz 12 have evaluated the surface roughness of weft knitted fabrics by analyzing the signals obtained from image processing using the 600 dpi resolution scanner and Matlab software. AATCC TM202-201213 describes a relative hand value instrument system (RHV-IS) for the determination of relative hand value. The present study is therefore undertaken to understand the effect of various softeners on surface smoothness characteristics of cotton woven fabric using various analytical techniques.
Materials and Methods
Cotton Fabric
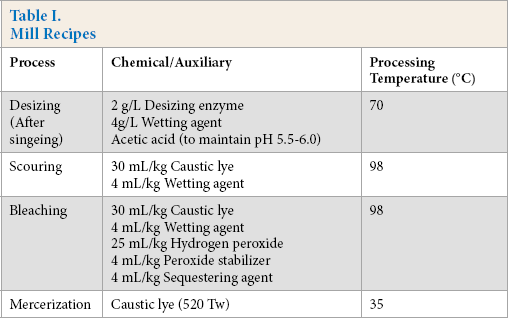
Greige cotton fabric (100%, plain woven) was sourced from M/s Surya Processors Pvt. Ltd., Ghaziabad, U.P., India. For processing, an enzymatic desizing agent (DXTRA conc., M/s Harris & Menuk Chemicals, Chennai, India) was used. Other chemicals used, including sodium hydroxide and hydrogen peroxide, were supplied by M/s Jai Laxmi Chemicals. The fabric was pretreated by desizing, singing, scouring, bleaching, and mercerizing in the mill using standard recipes (Table I).
Mill Recipes
Softener Treatment
Mercerized fabric samples were given softening treatments in the Northern India Textile Research Association (NITRA) pilot plant. Tree types of softeners were used in this study: a modified polysiloxane micro emulsion (Soft 1), an organo modified polysiloxane micro emulsion (Soft 2), and a hydrophilic nano silicone (Soft 3) at various concentrations (40, 60, and 80 g/L). These were pad-dry-cure applied on the mercerized fabric using a standard recipe (5–5.5 pH, 75% wet pickup at 30–35 °C, a drying temperature of 110 °C and a curing temperature of 150 °C for 40s) as recommended by the softener supplier.
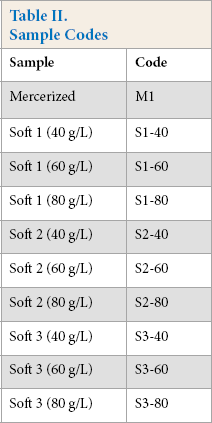
A total of 10 samples were prepared using these softeners. Sample details, along with the concentration of individual softeners used are given in Table II.
Sample Codes
Fabric Sample Analysis
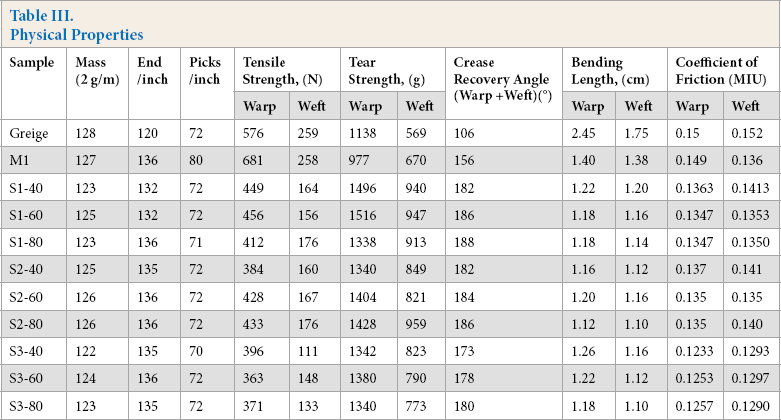
The samples were tested for various physical properties including mass (IS 1964), EPI/PPI (IS 1963), tensile strength (ISO 13934-1), tear strength (ISO 13937-1), bending length (IS 6490), and crease recovery (IS 4681).
The change in fabric surface roughness or smoothness after softening treatments was determined by the Digital Image Processing (DIP)’ method 14 using Matlab software, subjective analysis, and the Kawabata Evaluation System. 15
DIP
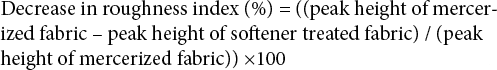
The DIP method is based on surface height variation measurement. Fabric samples were scanned using a 600 dpi digital image processing scanner. 16 After scanning, the obtained images were cropped so as to have a uniform and regular figure. Using Matlab software, simulation and surface roughness were plotted. The obtained images were first inverted so that the lighter areas represented the densely populated part of the fabric and the dark parts represented the sparsely populated region. 17 The images were transformed to gray scale and then loaded into Matlab. To remove the noise, Gaussian filters were applied. The degree of smoothening was determined by the standard deviation of the Gaussian, which was generally taken as 5. 17 A three-dimensional surface plot was generated. The images were then converted to a surface plot in Matlab. The color of the individual pixels was plotted on the y-axis. The difference between the color in different regions of the fabric caused a difference in the height in the plot. This difference was used to determine the surface roughness. The maximum peak height of the digital images was taken for the analysis. An appropriate computer program was written with due consideration of the various parameters of the three-dimensional surface plot of the scanned fabric images and simulation was performed using Matlab programming for obtaining the fabric surface roughness index. 17 Decrease in the percent roughness index was determined using Eq. 1.
Kawabata Evaluation System
The Kawabata system was used to determine the coefficient of friction (MIU) of the surface of fabric samples in the warp and weft directions on the sides that would be in contact with the skin during wear. 18 The framework gains information from two sensors estimating the frictional coefficient and the roughness of the fabric surface at the same time in three distinct regions within a fabric sample of 20 × 20 cm. The MIU is calculated by averaging the output over the distance between 0 to 20 mm using an integrator. 19
The MIU is defined in Eq. 2.

F is the frictional force and P is the sensor load.
Subjective Analysis
As per AATCC EP5-2011, a subjective analysis was carried out on four samples coded as M1, S1-80, S2-80, and S3-80. Greige fabric samples were also used along with these samples for the analysis. A questionnaire was prepared as per a 3-point Likert scale. This questionnaire was distributed to 20 respondents to get their smoothness assessment based on three ranking— smoother (Rating 1), smooth (Rating 2), and rough (Rating 3). All samples were analyzed diagonally by all respondents to average out the effect of warp and weft direction.
Statistical Analysis
Experimental data were analyzed using SPSS (IBM, version 20). Multivariate ANOVA were used to compare means. The null hypothesis (Ho) is that there was no relationship between concentration of softeners applied on the fabric and the MIU, bending length, and crease recovery values. In the alternative hypothesis, there was a relationship between concentrations of softeners applied on the fabric and MIU, bending length, and crease recovery values. The Ho hypothesis was rejected when the p-value was less than a pre-determined significance level of 0.05.
Results and Discussion
Mechanical Properties
The properties of the 10 treated fabrics, along with greige fabric, are given in Table III. Sample masses varied from 123 to 128 g/m2. The mass of the greige fabric (128 g/m2) was greater than the other samples due to the presence of sizing agent. Ends/inch and picks/inch of treated fabric samples (i.e., samples having undergone mercerization and softening treatments, were greater than the greige sample due to wet shrinkage during processing. Increased ends/inch and picks/ inch also increased the tear strength of the treated fabric. On the other hand, the tensile strength of the mercerized fabric was greater than fabrics treated with various softeners. Silicon softener friction between the fibers in yarn and between the yarn within the fabric resulted in more slippage reduction in load bearing capacity with increased elongation on load. 20
Physical Properties
Bending Length
The bending length is a major factor that determines fabric flexibility. 21 Bending length values of treated and untreated cotton fabrics are given in Table III. The softener treated cotton fabrics showed lower bending length values when compared to mercerized fabric, indicating that the mercerized sample was stiffer then the softener-treated samples. With the increase in softener concentration from 40 g/L to 80 g/L, there was a reduction in bending length. The reduction in bending length indicates reduced rigidity/stiffness, and hence improved softness, of the fabric. The softening ability of silicones originates from siloxane backbone flexibility due to Si-O-Si bond rotation. 20
Crease Recovery
Crease recovery is an important fabric property of the fabric, generally caused by a fold due to pressure on the fabrics. The tendency to crease depends on the structural characteristics of cellulose fibers. With a high degree of fiber orientation, a pronounced tendency to crease diminishes. The crease recovery angle was determined using a Shirley crease recovery angle tester. For this purpose, rectangular test specimens (14 × 15 mm) were cut both in warp and weft directions. Before testing, the sample was conditioned as per IS 4681 standard test conditions. Crease recovery angle values of mercerized and softener treated cotton fabrics are given in Table III. It is evident from the Table III that the crease recovery angle increased from mercerized to softener treated samples. This may be due to swelling of fiber in the fabric upon softening, leading to better fabric recovery from deformation. The fabric crease recovery angle also increased as the softener concentration used increased from 40 g/L to 80 g/L.22,23
Roughness
The roughness properties of all fabric samples were evaluated in terms of MIU values using the Kawabata evaluation system. The results of mercerized, as well as softener-treated fabric samples, are shown in Table III. MIU values were higher for mercerized fabric samples in both warp and weft direction than for softener-treated fabric samples.
Statistical Analysis
Results are given for the multivariant ANOVA analysis between softener concentrations and MIU values in Table IV. The null hypothesis (Ho) was rejected as the p-value was less than a predetermined significance level (0.05). The regression coefficient (R 2 ) value was 0.91, which indicated a very strong relationship between the softener concentration and MIU values.
Multivariant ANOVA among Softener Concentrations and Coefficient of Friction (MIU)
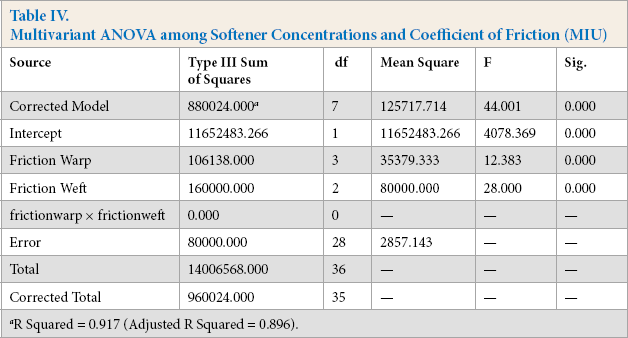
R Squared = 0.917 (Adjusted R Squared = 0.896).
The multivariant ANOVA results for studying the relationship between softener concentration and bending length and crease recovery are shown in Table V. The null hypothesis (Ho) was rejected p-value was less than a pre-determined significance level (0.05). The regression coefficient (R) value was 0.87, which indicated a very strong relationship between the softener concentration, bending length, and crease recovery.
Multivariant ANOVA among various Softener Concentrations and Bending Length and Crease Recovery
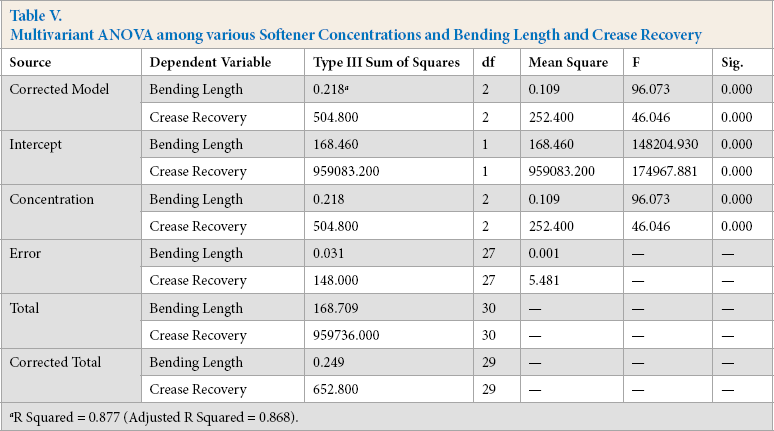
R Squared = 0.877 (Adjusted R Squared = 0.868).
Table VI shows the correlation between subjective and Kawabata analysis. The R 2 value was 0.78, showing good correlation between them.
Correlation between Kawabata and Subjective Analysis by Tests of Between-Subjects Effects
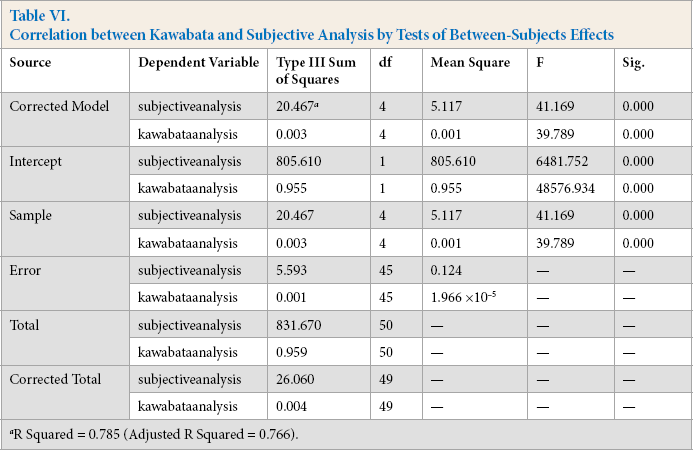
R Squared = 0.785 (Adjusted R Squared = 0.766).
Subjective Analysis
Samples were analyzed by respondents for smoothness as previously described using one of three ratings: 1 (smoother), 2 (smooth), and 3 (rough). The results obtained by subjective analysis were compared with the MIU values obtained from the Kawabata system. The results are shown in Fig. 1. These showed similar trends. Higher MIU values led to less smoothness. The S3-80 sample was smoother (2.7) than the others in subjective analysis. This sample has lowest MIU value (0.27 × 10). The greige (G1) sample was rougher (1.4) and had the highest MIU value (0.5 × 10).
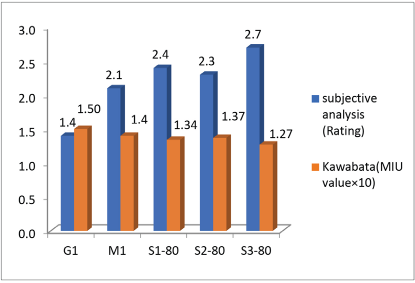
Graph of subjective analyses vs. Kawabata analysis.
Fabric Surface Peak Height and Roughness Index
Digital image processing methods were used to obtain surface plots for mercerized and softener- treated fabric samples. These plots are shown in Fig. 2. The mercerized fabric sample had a greater numbers of peaks with greater peak heights (Fig. 2a and Table VII) than softener-treated fabric samples (Figs. 2b–j). The surface of the mercerized fabric was rougher than that for the softener-treated fabric samples. With the increase of softener concentration from 40 g/L to 80 g/L, fabric samples became smoother (Figs. 2b–j). The values of peak height and roughness index are given in Table VII. Of the three softeners tested, S-3 provided a smoother surface than the others. A maximum decrease in roughness was found when fabric was treated with softener S-3 at 80 g/L.
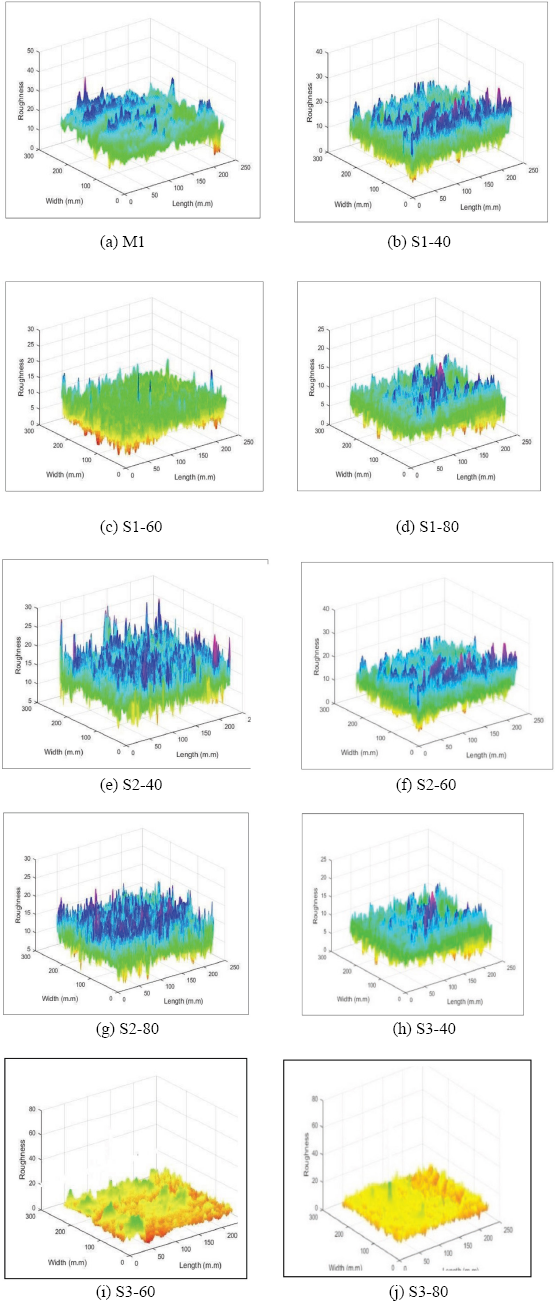
Surface plots obtained by the DIP method for mercerized and 40, 60, and 80 g/L silicone-treated fabric samples.
Conclusions
It was observed that the softener-treated cotton fabrics tested gave a lower bending length value as compared to the mercerized test fabric, indicating that the mercerized sample was stiffer then the softener-treated samples. A reduction in bending length was noted when the softener concentration was increased from 40 g/L to 80 g/L. Reduction in bending length indicated reduced rigidity/stiffness, and hence improved fabric softness due to use of the silicone softener.
The mercerized test fabric had the smallest crease recovery angle, which increased after the treatment with softener. The crease recovery angle (dry state) of various softener-treated samples was greater than for the mercerized fabric sample. Swelling of fiber in the fabric due to the presence of softener may be responsible for the ability of these treated fabrics to recover from deformation, as well as providing excellent soft hand. The crease recovery angle increased as the softener concentration of increased from 40 g/L to 80 g/L.
The Kawabata evaluation study showed that the coefficient of friction (MIU) value was higher for mercerized fabric in both warp and weft direction than for the softener-treated fabric samples, and had good correlation with the subjective analysis.
The digital image processing (DIP) method indicated that the mercerized fabric sample had a greater numbers of peaks with greater peak heights than softener-treated fabrics. This indicates that the surface of the mercerized fabric was rougher than the softener-treated fabric samples. The increase of softener concentration from 40 g/L to 80 g/L resulted in smoother (less rough) fabric samples. Softener S-3 provided the smoothest surface of the softeners tested. The greatest decrease in roughness was found when the fabric was treated with softener S-3 at 80 g/L.
Footnotes
Acknowledgement
We are grateful to the Ministry of Textiles, Govt. of India, for sponsoring the project entitled “Development of Fabric Smoothness Tester.”