
Abstract
The delamination resistance and damage tolerance of traditional honeycomb composites are poor. To overcome these defects, 3D (three-dimensional) integrated woven composites of honeycomb structure were designed, and then manufactured using the vacuum assisted resin transfer molding process (VARTM), based on the 3D self-prepared fabrics used as reinforcements. The load-displacement curves, maximum bending load-velocity curves, and bar chart of energy absorption were determined experimentally and calculated by finite element simulation. The results showed good agreement between experimental and finite element simulation data. The correctness of the model was verified, so the model can be used to predict the mechanical properties of 3D integrated woven composites of honeycomb structure with quadrilateral cross section.
Keywords
Introduction
Traditional honeycomb composites are extensively used in aerospace, automotive, shipbuilding, construction, storage, and pipeline applications. Most ordinary honeycomb composites are pressed with plate material, and the processing method is simple. But the integrity of the ordinary honeycomb composites is poor and it is easily cracked. Under the effect of externally alternating force or high temperature and humidity conditions, the junction of these composites is prone to damage, leading to the overall poor performance of traditional honeycomb composites. Therefore, honeycombed 3D integrated preforms are used as reinforcements that provide the integrated structure, and resin is used as a matrix. When the resin was completely solidified, an integrally honeycombed 3D composite was formed, which enhanced the overall performance and overcame the easy delamination defect of these traditional honeycomb composites. 1 In addition, compared with ordinary fabrics, honeycombed 3D fabrics have many advantages such as small thickness, high stiffness, and light weight.2,3
In the weaving of honeycombed 3D woven preforms, Huang. 4 used a dobby loom, a jacquard loom, or a braided loom to weave honeycombed 3D fabrics. Dong 5 wove honeycombed 3D preforms by improving the let-off and crimping mechanisms of the multi-shuttle dobby loom. Gu 6 proposed a method to weave 3D shaped preforms on a common loom. On a common loom, Lv 7 fabricated honeycombed 3D or T-shaped woven preforms and introduced the fabric design as well as the weaving method.
For mechanical performance, Zhu et al. 8 studied the effects of fiber content on the optimal energy absorption by doing impact experiments on honeycomb composites. Saito et al. 9 described a method to manufacture arbitrary cross section composites with honeycomb cores based on origami techniques. Russell et al. 10 studied the quasi-static deformation and failure modes of composites with square honeycombs. But the composites were traditional honeycomb-shaped composites. Xiong et al. 11 developed an interlocking method for 3D honeycombs and studied the mechanical behaviors of carbon fiber composite under in-plane compression.
The finite element method (FEM) is an effective way to analyze the damage and failure of composites based on the model of composite structures. In the FEM simulation, Lv et al. 12 studied the tensile and bending properties of 3D basalt woven composites with three different kinds of structures, using experiments and FEM simulation. Wang et al. 13 researched the dynamic response and structure failure of 3D interlocking woven composites using a three-point bending test. In addition, FEM simulation analysis was also used. Lv et al. 14 did experiments and FEM simulation to study the bending properties of 3D T-shaped woven composites.
Basalt fiber is a relatively new type of fiber for fiber-rein-forced composites. It has many advantages such as high rigidity, high modulus, and great chemical stability. Furthermore, it is a green fiber. The cost of manufacturing basalt fibers is much less than that of carbon fibers. Hence, this fiber has great potential in the fiber-reinforcement field. It can replace high price fibers, such as Kevlar and carbon fiber, that are used in composites.
The properties of glass fiber are similar to basalt fiber, but glass fiber is cheaper than basalt fiber. Many scholars have investigated the mechanical properties of composites reinforced by fabrics only made from basalt or glass fibers. Therefore, in this study, basalt and glass fibers were used to fabricate honeycombed 3D woven preforms with quadrilateral cross section on a common loom. The mechanical properties of the resulting composites were simulated by FEM.
Experimental
Materials and Equipment
Filament tows of twisted E-glass fiber (Jiujiang Lianfeng Glass Fiber Co. Ltd., 800 tex) were used as warp yarns and filament tows of untwisted basalt fiber (Zhejiang GBF Basalt Fiber Co. Ltd., 2000 tex) were used as weft yarns. Unsaturated polyester resin purchased from Sino Composite Co. Ltd. was used as matrix material.
A common shuttle loom (Nantong Sansi Electromechanical Technology Co. Ltd., Y100S) was used for weaving in the lab. A universal system prototype (Shanghai Kaya Industry Co. Ltd., NHY-W) was used for cutting samples. A universal material testing machine with servo computer (Suzhou Tuobo Machinery Equipment Co. Ltd., TH-8102S) was applied for testing.
Composite Design and Weaving
The warp structure drawings and chain drafts of honeycombed 3D woven preforms of six-layers with a quadrilateral cross section are shown in Fig. 1. The black circle point represents the weft yarn and the line correspondingly represents the warp yarns in the warp structure drawings. The chain draft is used to fabricate the preforms. The Fig. 1a warp structure drawings indicate that the number of weft yarns plays an important role in controlling the size of every hollow structure. In addition, the power of beating also has an effect on the size of the hollow structure, and the strength of the beating needs to be uniform.
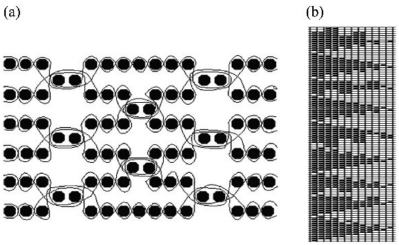
The design of honeycombed 3D woven preforms with quadrilateral cross section (a) warp structure drawings and (b) chain draft.
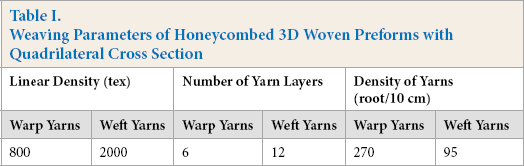
The weaving parameters of the honeycombed 3D woven preforms with quadrilateral cross section are shown in Table I. When drafting, the warp yarn used the straight draw. When weaving, the layers of the fabric used the same textile weave to reduce the number of heddle frames. The textile weave used in this work was a plain weave, since it made the design simple.
Weaving Parameters of Honeycombed 3D Woven Preforms with Quadrilateral Cross Section
Composite Preparation
Honeycombed 3D integrated woven preforms were used as reinforcement material. The volume proportion of resin, hardener, and promoter was set at 100:4:2. Before the resin was impregnated, the hollow positions of perform were filled with polyurethane foam to maintain the honeycomb structure. In addition, the hollow structures in the middle position were larger than those near the upper and bottom surfaces (Fig. 1a). The hollow structures in the middle position used more weft yarns.
After the fabric was supported, the hollow structures in the middle position were quadrilateral and filled with the quadrilateral polyurethane foam of suitable size. The hollow structures near the upper and bottom surfaces were triangular and the triangular polyurethane foam of the proper size (with a side length of 1 cm) was used for filling. The upper and bottom surfaces of the composite were fat.
The order of the materials placed on the test bench is shown in Fig. 2a from bottom to top. VARTM is a one-step molding process that can manufacture complex structures and large-scale composites. Fig. 2b is the curing photograph of a sample in the experiment. No extra force was required. In addition, the production technology is mature and can save a lot of money. This molding process is the most suitable method for manufacturing 3D textile composites. Therefore, honeycombed 3D woven composites with quadrilateral cross section were prepared by the VARTM molding process.
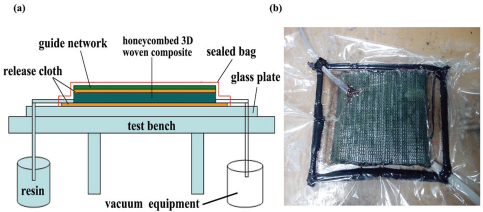
The process of VARTM (a) schematic diagram and (b) curing photograph of sample.
To decrease the porosity in the composite, the vacuum pressure in the mold system was set to ∼0.1 Mpa before resin injection. After resin injection, the fabric should be completely infiltrated. This process lasted for 3 h at room temperature (RT). After the honeycomb composite was cured, it was taken out from the system and put into the oven for 8 h at 80 °C. Finally, the honeycomb composite was formed. Due to the adoption of the VARTM process, the process of resin impregnation was good, only generating a few small bubbles. But resin enrichment was also generated locally, especially at the bottom surface of the composite.
Composite Testing
According to the GB/9341-2008/ISO 178:2001 plastic bending performance test, the samples were cut to a length of 160 mm and a width of 30 mm. In addition, the three-point bending properties of honeycombed 3D woven composites were tested in the weft direction. To investigate the damage tolerance between the experimental velocity and the material failure, bending properties were tested at 2, 10, 20, and 50 mm/min loading speeds. Finally, the load-displacement curves, maximum bending load-speed curves, and bar chart of energy absorption at the four loading speeds were obtained.
Results and Discussion
Establishment of the Model and Simulation
In the bending test, only the macro failure process and the final failure state of the composite can be observed, although the locally detailed failure of the composite cannot be directly seen with the naked eye. Furthermore, this composite failure process cannot be repeated with the same sample. This limits the investigation of composite bending properties. Nevertheless, the finite element method (FEM) is an effective way to simulate the problem. Thus, ABAQUS FEM software (Dassault Systemes) was used in this work.
In the ABAQUS part module, the geometrical model of honeycombed 3D woven composites with quadrilateral cross section was established based on the dimensions of the actual specimen. 3D variability of the tensile entity unit was designed. The length, width, and height of the cuboid was 160, 20, and 30 mm, respectively. Finally, the height of a 7-mm quadrilateral was used and the stretching length was 160 mm. In addition, the model was set as a macro model. The property of the composite was defined as elastoplastic. As Fig. 3 shows, the top surface of the composite subjected to compression was bound to a center-line, so applying a load to the center-line was equivalent to applying a load to the composite. The two bottom ends of the composite model were a completely fixed support. As for the constraint of the center-line in the pressed surface, except for the velocity constraint in the downward direction, the degree of freedom in other directions was constrained to zero. The velocity along the downward direction was set to 2, 10, 20, and 50 mm/min, respectively.
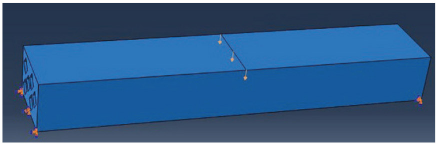
Constraints in the model.
The three dimensional with eight nodes (C3D8) solid elements were used for meshing the geometrical model. In other words, the elements of the model were used as a 3D deformable solid with eight nodes. The seeds (the number of elements depends on the distribution density of seeds in the model) on the side of the composite in this model were set to assign by number. Considering the convenience of calculation and the capability of the computer, the number of seeds of the geometric model in the length, width, and height directions was 32, 6, and 4. Therefore, the total number of elements in the mesh model was 1376. Considering the shape and element type of the model, the element of hexahedron-dominated shape was used to mesh the model. The meshing models of honeycomb 3-D integrated woven composites are shown in Fig. 4. Moreover, in the FEM process, the explicit calculation method was used.
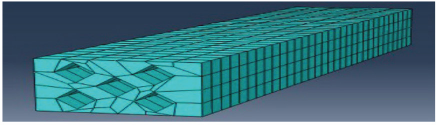
Mesh models of honeycombed 3D integrated woven composites with quadrilateral cross section.
The honeycombed 3D woven composites with quadrilateral cross section are elastoplastic materials. The mechanical property parameters of honeycombed 3D woven composite with quadrilateral cross section obtained from simulation are shown in Table II.
Property Parameters of Honeycombed 3D Woven Composite with Quadrilateral Cross Section

Where E11 is the longitudinal elastic modulus of the composite, and E22, as well as E33, is the transverse elastic modulus of the composite. V12 and V13 are the longitudinal Poisson's ratio of the composite. V23 is the transverse Poisson's ratio of the composite. G12 and G13 are the longitudinal shear modulus of the composite. G23 is the transvers shear modulus of the composite.
Load-Displacement Curves: Experimental and FEM Simulated
The experimental (abbreviated as “exp”) and FEM simulated load-displacement curves of honeycombed 3D woven composites with quadrilateral cross section at four different loading speeds are shown in Fig. 5.
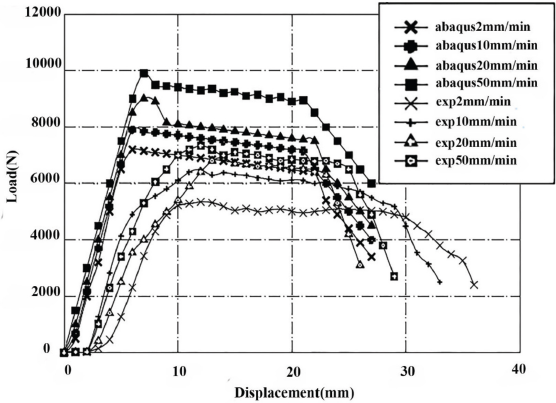
Load-displacement curves of experiments and FEM simulation at four different speeds.
As seen in Fig. 5, the FEM model simulation gave good agreement in simulating the actual composite failure. The overall trends between the ABAQUS simulation curves and the experimental curves were basically the same, although there were some differences between them. At the beginning of the experimental curves, there were small displacements without load, but the simulated curves tended to increase linearly. The suggested reason is that the surface of the composite material was not smooth in the experiment. When the fixture bar descends and touches the top surface of the composite, it touches protruding points of the composite material rather than the complete surface of the composite material. After a period of displacement, the fixture bar completely touches the surface of the composite material. Then, the experimental curves linearly increased, suggesting that the whole experiment specimen began to tolerate the load. In the FEM simulation, the surface of the composite material was smooth and fat, so the simulation curves tended to grow linearly from the beginning. With the increase in speed, the slope of bending load-displacement curves increased, which indicates that the honeycombed 3D woven composite was sensitive to velocity.
Other than the beginning phase of the experimental curves, the experimental curves and the simulation curves were in close agreement. As Fig. 5 shows, the curves were divided into three phases. The first phase was linear. Composite materials overall withstood the outside pressure when the fixture bar descended into full contact with the composite surface. The bending deformation occurred to the whole composite. Therefore, the first phase linearly increased until the load reached the peak load. The second phase of the curves shows a load fluctuation of small amplitude with increasing displacement. The curves were no longer linear and the slopes of the curves were reduced. In other words, the resin began to crack as the load increased. In this stage, the interface between filament tows and resin was gradually destroyed along the testing direction. At the same time, the filament tows, as the reinforcement material, gradually bore the main load. The fluctuation of load shows that the weft had a good constraint function in protecting the structure against the bending load. The third phase was the descending branch; the curves tended to decline. The compression area of the composite material was completely damaged. A large number of curing resin cracks appeared visually and the filament tows gradually fractured. Therefore, the load decreased.
As a result of the elastoplastic property of the honeycomb composites, the first region exhibited linear deformation in the FEM simulation. The phase of load fluctuation indicated the non-linear deformation region. The non-linear deformation started after the first peak load. The stress and strain were calculated according to the corresponding load and displacement. The plastic deformation was based on the displacement after the first peak load.
Maximum Bending Load-Velocity Curves: Experimental and FEM Simulated
At four different loading speeds, the maximum bending load-speed curves of the honeycombed 3D woven composite with quadrilateral cross section in experiments and FEM simulation are shown in Fig. 6.
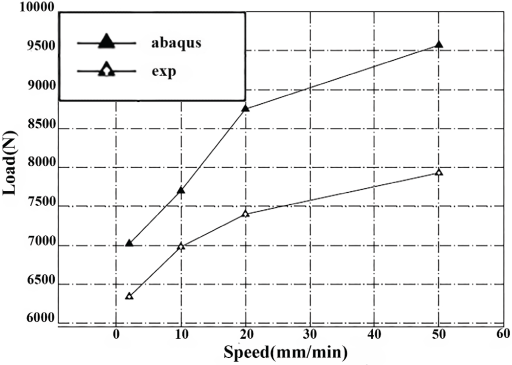
Maximum bending load-speed curves of experiments and FEM simulation at four different speeds.
As seen from Fig. 6, the applying speed to the composite had a significant effect on the maximum load. The bending load increased with increased speed. This indicates that the composite was sensitive to the speed. Also, the material failure decreased with increased applying speed. Due to the increase of speed, the composite material was less responsive. In addition, the modulus of the composite was larger, which shows that the delamination resistance and damage tolerance of the honeycombed 3D woven composite was greater. Furthermore, there were also similar trends between the experimental and simulation curves, proving the validity of the FEM simulation. According to the results of the experiments and FEM simulation, the maximum bending load errors are shown in Table III.
Errors of the Maximum Load in Experiments and FEM at Four Different Speeds
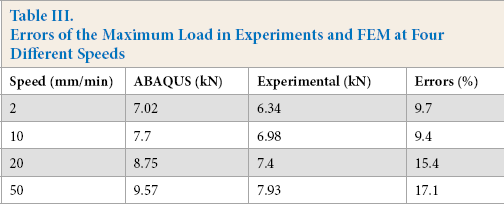
From Table III, the maximum error value was 17.1% and the minimum error value was 9.4%. On one hand, the peak load of material failure was different. The peak load increased with increased speed. The FEM itself was subtly different from the experimental results. On the other hand, since the honeycombed 3D woven composite material in the ABAQUS software simulation was assumed to be smooth and fat, the fiber and resin were uniformly composited, and the model was an integral part without any interface effect. Thus, the maximum bending load values obtained from the FEM were larger than the experimental values.
Energy Absorption
Energy absorption capability is also an important index for the properties of composites. The total energy absorption from experimental and FEM simulation results at four different speeds are shown in Fig. 7. Energy absorption capability on the total work done of the composite is equal to the area under the load-displacement curve and evaluated using Eq. 1.

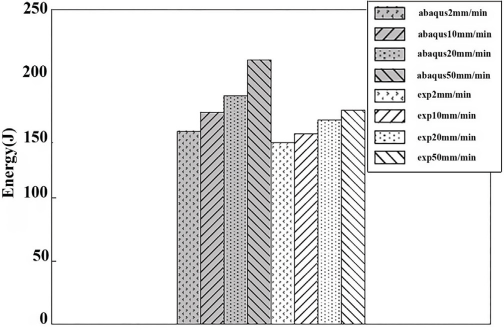
Energy absorption of experiments and FEM simulation at four different speeds.
At four different loading speeds, the energy absorption of the honeycombed 3D woven composite with quadrilateral cross section obtained from experimental and FEM simulation data are shown in Fig. 7. Compared with the bar chart at the same speed, the values of three low speeds were similar. The test value at 50 mm/min was greatly different between experimental and FEM simulation results. These differences were amplified under high-speed measurement, due to the defect of the material itself. In general, there was a good agreement on energy absorption between experimental and FEM simulation results. With the increase of speed, the absorbed energy of the composite gradually increased in both experimental and FEM results. The results were consistent with the data obtained from the load-displacement curve. This proves the validity of FEM simulation. This also indicates that the honeycombed 3D woven composites were sensitive to speed.
Conclusion
The honeycombed 3D woven preforms with a quadrilateral cross section were woven on a common Y100S loom with 800 tex E-glass fiber filament tows used as warp yarns and 2000 tex basalt fiber filament tows used as weft yarns. The honeycombed 3D integrated woven preforms were used as reinforcement material and unsaturated polyester resin was used as matrix material. The honeycombed 3D woven composites with a quadrilateral cross section were prepared using the VARTM molding process. Tree-point bending properties were tested on the servo computer universal material testing machine (TH-8102S), and the load-displacement curves, maximum bending load-velocity curves, and bar chart of energy absorption at four different loading speeds of 2, 10, 20, and 50 mm/min were obtained. In the bending test, the honeycombed composite was found to be sensitive to speed. When the speed increased, the load that the composite tolerated increased. The energy absorbed by the composite increased accordingly. The composites were also simulated by ABAQUS. The ABAQUS results showed good agreement with the experimental results. The correctness of the model was verified, so the model can be used to predict the mechanical properties of 3D integrated honeycomb woven composites with quadrilateral cross section. The results showed an improvement in the delamination resistance and damage tolerance of the honeycombed 3D woven integrated composites.
Footnotes
Acknowledgements
The authors gratefully acknowledge financial support from the National Science Foundation of Liaoning Province (2019-MS-017) and the Technological Innovation Team Project of Liaoning Province (LT2017017).