
Abstract
Odor poses a growing concern in clothing and apparel applications due to laundering limitations at managing odor-causing microorganisms. Herein, a novel silver-polymer complex was applied to textile materials and studied using quantitative antimicrobial assays, gas chromatography techniques, and odor panel sensory tests to ascertain odor control function and effectiveness. A known chemical odor pathway involving leucine conversion to isovaleric acid was studied and found to be disrupted in silver-treated fabrics. Furthermore, its odor absorption function was confirmed with up to 90% retention of select thiol and fatty acid odors at body temperature in a model odor bouquet. Lastly, human sensory studies were used to support laboratory odor measurements using seven-day wear trials and milk odor generation techniques after 50 launderings.
Introduction
The demand for products and solutions delivering hygiene benefits are growing globally in many markets and regions. Consumer products providing hygienic performance typically offer infection control, antimicrobial control, and/or odor control capabilities. Two growing markets demanding built-in odor protection—traditionally handled through consumer spray and detergent products—are the apparel and home textile markets.1,2 A key market driver supporting built-in odor control is the potential ineffectiveness of current home laundering practices at mitigating odor-causing microorganisms.3,4 Today, energy efficient washing practices support unwanted microbe growth, allowing them to thrive, accumulate, and form biofilms.3,5 Two major sources for such organisms are the environment (e.g., in washing machines) and natural skin flora. 6 In both examples, the odor typically arises from microorganism catabolism. More specifically, microorganisms convert higher molecular-weight gland secretions (e.g., proteins, steroids, long-chain fatty acids, lipids, cholesterol esters, and squalene) through enzymatic action to odiferous, lower molecular-weight compounds detectable by the olfactory system. 7 Odors can either be produced in the garments, or on the skin itself, where they are temporarily absorbed into the clothing.8,9 Ultimately, without technologies that non-selectively manage clothing odors, people are prone to additional social acceptability issues.10-12
Complicating clothing odor further, odor combinations differ by the body region where worn (e.g., socks and T-shirts) due to the microorganism population variance with anatomy. 13 As a consequence, microorganism differences increase the number of potential enzymatic pathways that may generate odor. In addition, dietary and body region-dependent secretions afford variable odor precursors—molecules not typically perceived as odoriferous. 14 Combining odor precursors with enzymes can lead to a multitude of odors. For instance, 3-hydroxy-3-methyl hexanoic acid is commonly found in the underarm, but not around the foot, where ammonia and isovaleric acid are typical.15,16 As a result, apparel and home textile market segments have used antimicrobials against a broad range of microorganisms associated with humans and laundry to control odor for over 20 years.1,2
One antimicrobial traditionally incorporated into fabrics across many markets due to its proven performance is silver. 2 Silver is a well-known tri-modal bactericide that controls many microorganism species through its chemical interactions with biochemical nucleophiles. 17 Silver binds to bacterial DNA preventing replication, to cellular membranes altering their function, and binds to and inactivates metabolic enzymes. 18 Silver even binds to select odors, giving it the added functionality of an odor absorber. 19 Of the three antimicrobial modes-of-action, silver enzymatic inhibition plays the most critical role in odor control, unlike that of other common antimicrobials. Without inactivation, enzymes can continue functioning under appropriate pH, humidity, and temperature conditions, completing chemical processes critical to the generation of molecules detectable by the human olfactory system. 7
Besides antimicrobial use to prevent malodors, malodor capture technologies (e.g., cyclodextrin, zeolites, activated carbon, and metals), 20 catalysts (e.g., enzymes), 5 oxidants (e.g., inorganic catalysts and peroxides), and perfumes, find use in textiles, laundry products, and consumer sprays for fabric-based surfaces. 21 Odor-absorbing materials are seeing incorporation into textile materials, but typically suffer from lack of durability (removal with laundering), added discoloration, and/or lack of effectiveness at broad-spectrum malodor capture, due to chemical selectivity and capacity limitations. Furthermore, because of their effectiveness at controlling odor-causing microorganisms, along with some antimicrobials’ inherent odor absorption capacities, 19 antimicrobials remain and are a critical technology for hygienic, odor-related textile needs.
The aim of this work was to evaluate the odor management properties of a unique silver-polymer chemistry to support its odor-control performance. Antimicrobial activity was verified on numerous textile materials using AATCC Test Method (TM) 100, combined with washfastness protocols AATCC TMs 61-2A and 135. Antimicrobial odor control was studied across treatments by sampling fabrics inoculated with synthetic sweat containing leucine and Staphylococcus aureus to monitor conversion to isovaleric acid via bacterial catabolism. In addition, silver-polymer complex odor absorption capacity was demonstrated using a mixture of representative compounds associated with human malodor. Gas chromatography-mass spectrometry (GC-MS) studies and sensory odor tests were completed for both a wear trial and for fabrics soiled with milk to support repression of microorganism-derived odor generation. Lastly, various technologies were compared at 50 home launderings using AATCC TM 135 for their ability to mitigate odor associated with milk spoilage in synthetic fabrics.
Experimental
Materials
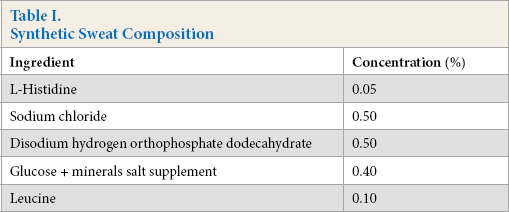
All materials were used as purchased. Synthetic sweat was created using sodium chloride (Sigma S9888), L-leucine (Sigma L8000), sodium phosphate dibasic dodecahydrate (Sigma 71649), L-histidine monohydrochloride monohydrate (Sigma H5659), and a glucose mineral salts supplement. The glucose mineral salts supplement is 3% w/w mineral salts concentrate A (2.1% w/w potassium phosphate dibasic (Fisher P288-500) in deionized (DI) water) and 3% w/w mineral salts concentrate B (3% w/w ammonium nitrate (Fisher A676-500), 0.006% w/w ferrous sulfate (Fisher I146-500), 2.1% w/w magnesium sulfate (Fisher M65-500), 2.1% w/w potassium phosphate monobasic (Fisher P285-500), 0.015% w/w sodium chloride (Fisher S271-500), 0.006% w/w zinc sulfate (Fisher Z76-500) in DI water, and 1% w/w glucose (Fisher D16-500)). Cotton was obtained through Testfabrics (Item 460-40) and polyester was obtained from SDL Atlas (TIC/730). The following odor body standards purchased for analytical methods were isovaleric acid (IVA, Acros Organics 156695000), 3-methyl-2-hexanoic acid (MolPort 016-634-524), ethyl butyrate (Aldrich E15701), E-2-nonenal (Aldrich 255653), 2-methoxyphenol (Aldrich PHR1136), 3-methyl-indole (Acros Organics 127030100), 1-octen-3-ol (Aldrich O5284), butyric acid (Aldrich B103500) and isopropyl mercaptan (AccuStandard PS-710-01). Unless otherwise noted, fabrics were from SDL Atlas LLC. TIC 460 100% bleached cotton (lock knit), TIC 300 span nylon, and TIC 730 polyester (90% polyester/10% Lycra) were sourced from Leer Corp.
Fabric Preparation
A lab-scale padding machine from Werner Mathis AG (Model CH-8155 VFM28888) was used to apply the antimicrobial compositions to fabric samples. The fabric wet pickup rate (WPUR) was determined to more accurately target the concentration of silver ion-polymer complex, zinc pyrithione (ZPT), and quat silane (QS) solutions needed to achieve the desired active loadings. The roller pressure was typically set at 3 bar. Swatches of fabric (12 × 16 in.) were consistently used. After passing through rollers, fabrics were dried at 140 °C. All pad baths were pH adjusted to 5 with acetic acid.
Microbial Generation of IVA and Detection
Bacterial Culture Preparation
S. aureus (ATCC 6538) was streaked for isolation on tryptic soy agar and incubated overnight at 37 °C. Post-incubation, the plate was examined to verify a pure culture. A sterile loop was used to pull one colony and inoculate 10 mL of tryptic soy broth (TSB), which was then incubated overnight with shaking at 30 °C. The overnight culture was centrifuged and the supernatant was discarded. The cell pellet was re-suspended in synthetic sweat containing leucine (Table I) to a final concentration of 106 CFU/mL. Synthetic sweat was filter sterilized (0.2 µm) immediately prior to use.
Synthetic Sweat Composition
Fabric Sample Preparation
Fabric samples (∼0.40 g each) were cut into small strips and placed in sterile glass vials. The samples were inoculated directly and evenly with 200 µL of the bacterial culture in synthetic sweat and then further incubated at 37 °C for 48 h.
IVA Detection
IVA was quantified and monitored using gas chromatography with flame ionization detection (GC/FID, Agilent 6890 Series GC or equivalent equipped with flame ionization detector and split/splitless injector). Milli-Q DI HPLC grade water (Millipore Corp.) was used as the extraction solvent. Calibration curves were generated using ACS reagent grade isovaleric acid at concentrations between 0.001 and 0.8 mg/mL in Milli-Q water. Inoculated fabrics (0.4 g) were extracted in 1-oz screw cap vials using 10 mL of Milli-Q water by sonicating for 1 h. Aliquots were removed for injection and measurement. Dilution was sometimes needed depending on the expected IVA concentrations. The limit of detection (LOD) was ∼0.0005 mg/mL (0.5 ppm) and the limit of quantitation of IVA in fabric was about 10 ppm or 0.001 mg/g of fabric.
Odor Absorption Testing
Standard Preparation
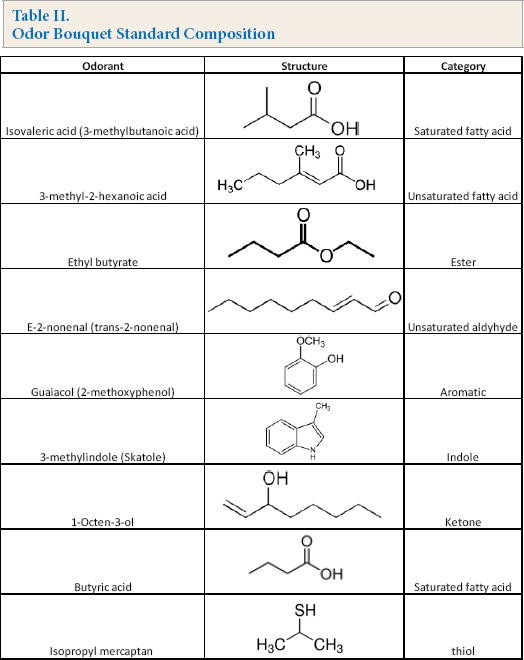
A nine-molecule odor bouquet standard was created to model absorption of common human odor chemistries into untreated and antimicrobial-treated fabrics.22,23 The odor standard is comprised of thiols, esters, ketones, aldehydes, saturated and unsaturated fatty acids, aromatic, and indole compounds (Table II). GC elution time and detection limits for individual odor isolates were independently assessed to ensure minimal to no overlaps in peak positions. Each odor body standard was prepared at 1% w/w in ethanol. Further dilutions were made in ethanol to generate standard curves for linearity in the range of 1 to 1000 ppm.
Odor Bouquet Standard Composition
Double Vial Odor Capture Preparation
An odor capture method was modified from a Rutgers University Mass Spectrometry Laboratory procedure. 24 For fabric testing, a two-chamber system was used consisting of an inner 2-mL liquid chromatography (LC) vial in an outer 22-mL GC vial. The septum of the LC vial was removed and replaced with either nothing (control), untreated fabric, or treated fabric. The odor standard (1% w/w of each odor body, 5 μL) was injected through the fabric into the LC vial using a 26-gauge gas-tight syringe. The GC vials were crimp sealed with Teflon-lined septa and the vials were incubated at 37 °C for 24 h. The GC vial headspace was analyzed for each odorant concentration (v/v) and percent reduction relative to the controls were determined.
Headspace GC-MS Analysis
Double vial odor sample headspace was analyzed using an Agilent GC-MS model 6890/5973 with a Perkin Elmer TurboMatrix 40 Trap Headspace Sampler and mass selective detection (HS-GC-MS). All studies were completed at body temperature (37 °C). Instrument parameters are listed in Appendix 1. Calibration standards were included in each sequence, as well as several air blanks. Headspace analysis of the standards was done in full-evaporation mode to eliminate matrix effects that can occur in static headspace sampling. In this mode, a small sample size (∼15-20 mg) is used, and the headspace vial temperature is set sufficiently high enough to allow for full evaporation of the volatile of interest. For this analysis, the standard samples were heated to 150 °C for 10 min prior to sampling. The ppm v/v concentration of each calibrated compound in the sample headspace was then determined using the linear-least-squares equation from the calibration plot for that compound (peak area vs. v/v concentration, Eqs. 1 and 2).


Odor Panel Testing
Internal Odor Panel Testing Protocol for Soft Surfaces
All panelists were cleared medically prior to participation. Additionally, they were asked not to chew gum, wear perfume, participate while sick, and not communicate with other panelists. The panelists (17) were trained and approved for testing, but only three were used in this research. Each test sample was first supplied to a toxicologist to assess risk and approve for smelling. Prior to each odor analysis, olfactory adaptation and fatigue were explained to them, and lab safety and proper sniffing technique were reviewed.
Sniff Procedure
Exhales must be completed prior to sniffing. Quick sniffs (1-3) were used just to bring the scent up into the nose and not into the lungs. If repeat sniffs were needed, the maximum duration for each sample was 6 sniffs/breath or 30 seconds total, whichever came first—this minimized acclimation and exposure. One minute was allowed before smelling the next sample.
Samples
All participants were notified of the surface to be tested and given the option to decline participation. Participants that could be allergic to a surface (e.g., animal bed) were instructed not participate. A control, untreated sample (not containing odor-control technology) was included in all studies and replicates of certain treatments were added blindly to monitor olfactory adaptation and fatigue. All samples were provided in clean aluminum trays weighing ∼1 g each for treated and untreated fabrics.
Method
Panelists were supplied an evaluation form. They were instructed to assess the odor on the soft surface using one of the following rankings: 0 = almost no perceptible odor; 1 = very slight odor, but pleasant; 2 = very slight odor, but not pleasant; 3 = some odor, but pleasant; 4 = some odor, but not pleasant; and 5 = much odor and/or very unpleasant.
The location of the odor analysis was in an environment that was substantially odor free, climate controlled, and with a high air turnover rate (21.5 air changes/h). There were no carpets, textiles, or materials that could absorb and retain odors in the room. Blind coding was used with each sample.
Milk Odor Generation
Odor-control technologies were pad applied to fabrics and washed. The fabrics were then cut into ∼1-g samples and placed in sterile 50-mL glass vials. Fat free, Grade A, pasteurized cows’ milk (within expiration date, 1 mL) was applied directly and evenly to the sample, making sure that all the milk was absorbed, and no milk was deposited on the container. The vials were sealed tightly and then incubated at 37 °C for 24 h. Triplicate sets of samples were prepared, using treated (containing odor-control technology) and untreated fabrics. After incubation, one set of samples was opened and evaluated by three odor panelists as per odor panel sensory testing. The other two sets were analyzed by HS-GC-MS for volatile organic compounds/odorants.
Seven-Day Wear Testing
Shirts (90% polyester/10% spandex) were treated and blindly provided to five participants. Each wearer received two shirts, one of which was treated with 15 ppm of active silver in the form of the silver-polymer complex. Participants were instructed to wear each shirt for seven consecutive days during 1 h exercise routines. Exercise routines were kept constant and shirts were only air dried between wears (no washing). At the end of seven wears, participants returned the shirts, and three trained odor panelists were instructed to evaluate odor. HS-GC-MS was further used to assess the chemicals residing in the fabrics. Fabric swatches (1 × 1 in., primarily from the chest area) were placed into 22-mL headspace vials, capped with Teflon-lined septa, and incubated at 37 °C for 24 h.
Fabric Washing Protocols
AATCC TM 61-2A
The laundering instrument (Launder-Ometer, SDL Atlas) was set to 49 °C with a wash solution consisting of 150 mL of water and 0.225 g of 2003 AATCC Standard Reference Detergent WOB, along with 50 stainless steel balls per stainless steel canister. Once the wash solution reached set temperature, a single fabric sample was added per canister (5 × 15 cm) before the wash cycle was initiated. The cycle was set for 40 rpm for the duration of 45 min. After 45 min elapsed time, the canisters were removed, spent liquid was disposed of, and each sample was transferred to a separate beaker. Next, each test sample was rinsed three times using distilled water at 40 °C for 1 min, with occasional stirring or hand squeezing. Finally, samples were dried in a tumble dryer using a normal cycle at ∼71 °C.
AATCC TM 135
All treated and untreated fabrics tested using TM 135 were washed by the Drycleaning and Laundry Institute and Dow up to 50 wash cycles using 2003 AATCC Standard Reference Detergent without optical brighteners. Wash time was 18 min total, with 12 min for wash and 6 min for rinse. Wash and rinse temperatures were ∼30 ° C. Detergent (∼66 g) was used with 68 L of water per wash. Fabric sizes were typically 15 × 15 in., plus 36 × 36 in. of ballast. Spin speed was 179 rpm for wash and 645 rpm for rinse. Additional hot rinses were used to ensure the detergent was thoroughly removed to prevent false positive antimicrobial tests on untreated fabrics. All fabrics were dried in a tumble dryer at 70 °C.
Minimum Inhibitory Concentration (MIC) Studies
MIC Inoculum Preparation
Stationary phase bacteria and yeast cultures were grown overnight at 30 °C and 25 °C, respectively, in a rotary shaking incubator (125 reciprocations/min) in the same media as that used in the MIC test (TSB concentrate). Spore suspensions of fungi were prepared in phosphate buffer and diluted into the appropriate test medium. A 1:20 dilution of the overnight culture or spore suspension was prepared in the appropriate test media and inoculated into the test mixture to give a final concentration of 106 to 107 CFU/mL in the MIC test. The lowest concentration of antimicrobial that inhibits the growth of the microorganisms is defined as the MIC. MIC results are reported as parts per million (ppm). The MIC test protocol used in these studies was based on the standard method as described by the National Committee for Clinical Laboratory Standards (NCCLS) approved standard.25,6
High-Resolution MIC Method
MIC tests against representative Gram-positive bacteria, Gram-negative bacteria, yeast, and mold were carried out using a high-resolution MIC (HRMIC) method, with representative bacteria and fungi tested in 96-well microtiter plates (200-µl final volume). Varying amounts of stock solutions containing antimicrobial agent in DI water were added to the microtiter plate at 1-5% of the total volume. The antimicrobial agent was then serially diluted in the growth media to get a series of closely-spaced endpoints. Cultures of microorganisms were added to all wells at 1-5% of the final volume. Antimicrobial dilutions and inoculations were performed using a Biomek automated workstation. All media and transfers used sterile supplies and aseptic techniques. Controls included samples with no antimicrobial added to the growth media. MIC tests were carried out using M9G 26 adjusted to pH 7.0 ± 0.5 for bacteria and M9G adjusted to pH 5.0 ± 0.5 for filamentous fungi and yeast. Bacteria were inoculated into sterile media at 106 to 107 CFU/mL and incubated at 30 °C. Fungal strains were inoculated to a final concentration of 104 to 106 CFU/mL and incubated at 25 °C.
MIC values were determined after 24 h at 30 ± 2 °C for bacteria and after a five-day incubation period at 25 ± 2 °C for fungi. The MIC value was visually determined as the lowest concentration where no visible growth (assessed as turbidity or mycelia development on the surface of the broth) was observed. Values were reported as the mean of replicate samples and in parts per million.
AATCC TM 100 Antimicrobial Testing
Specimen Preparation
Circular swatches 4.8 ± 0.1 cm (1.9 ± 0.03 in.) in diameter were cut from the test fabric using a steel die. The swatches were stacked in a 250-mL sterile glass jar. The number of swatches was determined by the minimum amount of fabric necessary for the complete absorption of 1.0 ± 0.1 mL of inoculum, with no free liquid in the jar. Samples were not sterilized in accordance with this method.
Inoculum Preparation
An overnight culture of Escherichia coli (AATC 8739) was diluted in TSB so that the recovery from untreated or treated test fabric swatches at zero contact time was 1-2 × 10⁵ organisms per sample. The recovery was reported as the number of bacteria per sample, not as the number of bacteria per mL of neutralizing solution.
Sample Inoculation
Sample swatches were placed separately in sterile petri dishes. A microliter pipette was used to evenly distribute 1.0 ± 0.1 mL of inoculum per sample set. The inoculated swatches were then transferred aseptically and stacked in a sterile glass jar. The inoculated samples were incubated at 37 °C for 24 h.
Sample Enumeration
Immediately after inoculation, 100 ± 1 mL of Dey Engley buffer was added to the jars containing untreated control swatches for a zero-contact time enumeration. The jars were shaken vigorously for 1 min, and aliquots were enumerated using the most probable number (MPN) method in TSB. The remainder of the samples were incubated at 37 °C and enumerated after 24 h of incubation.
Bacteria Imaging Studies
Confocal Microscopy Sample Preparation
Sterile filter paper was placed in the bottom of an empty petri dish and moistened with 0.5 mL of sterile filtered artificial sweat and 30 g/L of TSB diluted 1:500. Tree 0.5 × 0.5 in. fabric samples were placed on the wet filter paper and the fabric samples were inoculated with 5 × 10 µL of S. aureus culture diluted to 107 CFU/mL with artificial sweat. Petri dishes were sealed with parafilm and incubated at 36 ± 2 °C for 72 h. Samples (untreated controls and antimicrobial treated) were assessed every 24 h to ensure samples maintained some degree of moisture to prevent bacterial die of. At 72 h, two fabric samples were collected for viable plate counts (serial dilution) and one fabric sample was stained using a LIVE/DEAD BacLight bacterial viability kit (Thermo Fisher Scientific) and imaged with a confocal microscope (Table III). Cells with a compromised membrane will stain red, whereas cells with intact membranes stain green. Typically, with this protocol, live bacteria stain green and dead bacteria stain red.
Total Viable Plate Counts for Samples used in Imaging
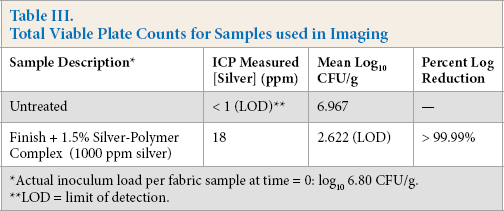
Actual inoculum load per fabric sample at time = 0: log10 6.80 CFU/g.
LOD = limit of detection.
Results and Discussion
Precedent exists today detailing antimicrobial fabric performance against human flora in numerous publications and patents. What is not acknowledged is that antimicrobials do not always support holistic fabric odor control. More specifically, body odors absorbed into the garments—retained during wash and re-released during body temperature exposure—are likely to be confounded with bacterial odors produced within the garments. Unlike many organic antimicrobials, silver chemistries provide a more balanced solution. First, silver inhibits a broad range of microorganisms at low concentrations, preventing odors before they are produced. Second, silver is a Lewis acid; it can function as an odor neutralizer, absorbing critical odors produced outside the fabric. Here, we provide evidence to support both aspects of odor control for a silver-polymer complex using chromatography, antimicrobial testing, and odor sensory studies.
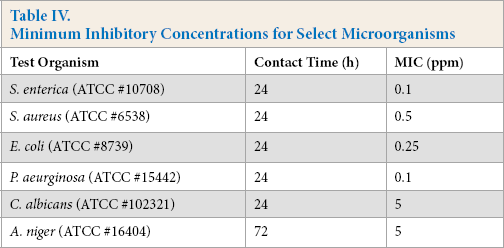
Antimicrobial efficacy was first evaluated outside of fabrics across a range of microorganisms using MIC studies. The silver complex tested demonstrated growth inhibition of relevant Gram-positive bacteria (e.g., S. aureus), Gram-negative bacteria (e.g., E. coli and Pseudomonas aeruginosa), fungi (e.g., Aspergillus niger), and yeast (e.g., Candida albicans) at concentrations below 6-ppm silver (Table IV). Further studies of fabric treated with ∼15 ppm of silver showed a two to three log bacterial reduction after 10 laundering cycles (Table V) based on TM 61-2a.
Minimum Inhibitory Concentrations for Select Microorganisms
Antimicrobial Efficacy across Tree Fabric Types Treated with Silver-Polymer Complex*
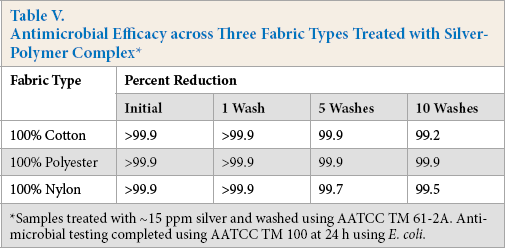
Samples treated with ∼15 ppm silver and washed using AATCC TM 61-2A. Antimicrobial testing completed using AATCC TM 100 at 24 h using E. coli.
To visually understand the antimicrobial effect of the complex, a method combining microbial staining and confocal microscopy was developed and used on 15-ppm silver treated polyester fabrics that were determined to be 99.99% active against S. aureus (Fig. 1). Little/to no growth of the S. aureus colonies were observed at two different magnifications on the treated fabric. In contrast to the treated samples, live bacteria (artificially colored blue) can be seen on the untreated polyester fabrics at the corresponding magnifications. MIC studies and fabric antimicrobial assays, combined with confocal imaging, confirmed the efficient antimicrobial nature of the silver-polymer complex.
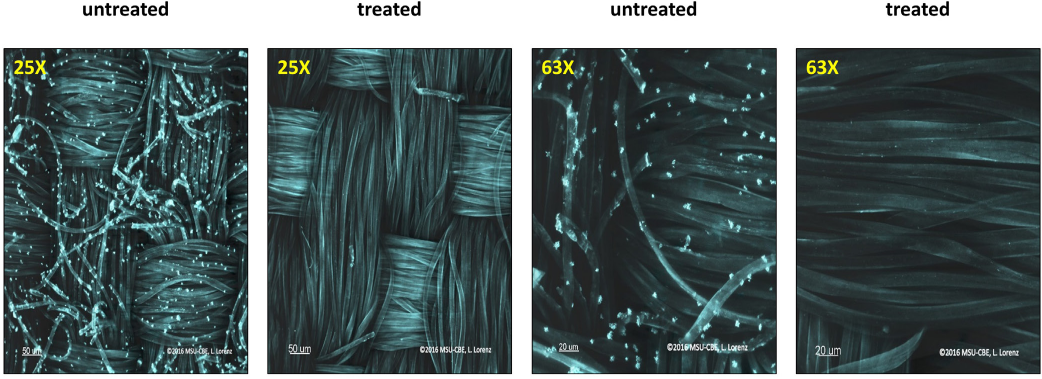
Confocal microscopy of silver-polymer complex treated and untreated polyester fabrics.
To connect fabric antimicrobial activity to odor control, gas chromatography coupled with fame ionization detection (GC-FID) was implemented to monitor odorant generation. Numerous enzymes collectively play catalytic roles in the chemical conversion of leucine (e.g., aminotransferases, decarboxylases, and dehydrogenases) to IVA, which is often associated with strong pungent cheesy or sweaty smells (Scheme 1). 27 Using synthetic sweat doped with leucine and S. aureus, bacterial catabolism was systematically monitored on treated and untreated fabrics for IVA generation after 48 h. GC-FID peak area integration was used to quantify IVA concentrations for each test fabric. Fig. 2 depicts IVA concentration differences with respect to treatment. IVA absence in silver-polymer treated fabrics supports odor-control dependence on antimicrobial activity through disruption of the leucine to IVA pathway.
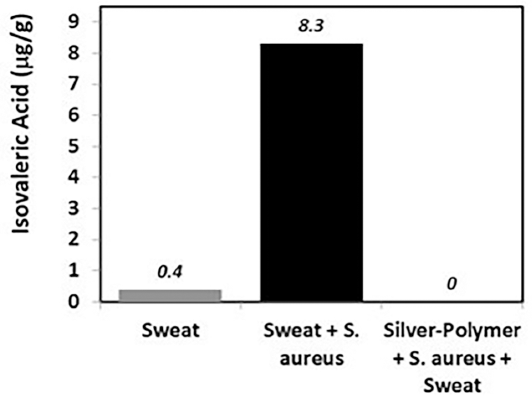
Silver-polymer complex treated fabric influence on microbe-derived IVA generation.
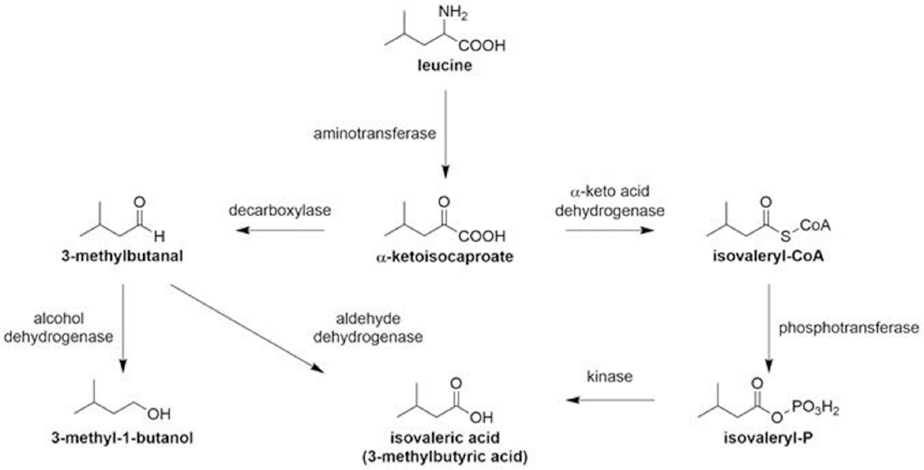
Potential catabolic pathways leading to IVA formation.
In addition to antimicrobial odor control, the odor-retention function of the complex was examined using the odor bouquet described in Table II. Overall, virgin cotton fabrics gave greater retention for select odors in the bouquet versus polyester at 37 °C (Table VI). Fabrics treated with the antimicrobial complex confirmed improved odorant reduction for heteronuclear (e.g., isopropyl mercaptan) and acid functional odors (e.g., butyric, isovaleric, and 3-methyl-2-hexanoic acid), with reductions in the 70 to 90% range (Fig. 3). Compared to polyester, odor retention selectivity supported the previous findings of Munk et al., where the more hydrophobic species (e.g., E-2-nonenal, 1-octen-3-ol, and ethyl butyrate) demonstrated affinity to the fibers. 4 Silver-polymer complexes played a minor role in changing hydrophobic odorant retention at elevated temperature (Table VI). 12
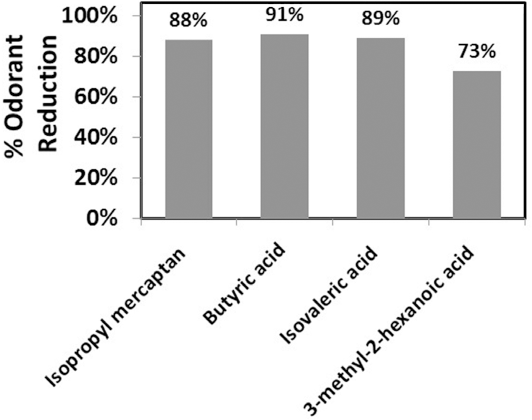
Percent reduction of select odorants available in headspace for silver-polymer complex treated cotton.
Odor Bouquet Retention as a Function of Fabric Type and Treatment
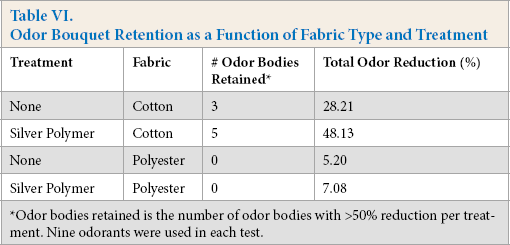
Odor bodies retained is the number of odor bodies with >50% reduction per treatment. Nine odorants were used in each test.
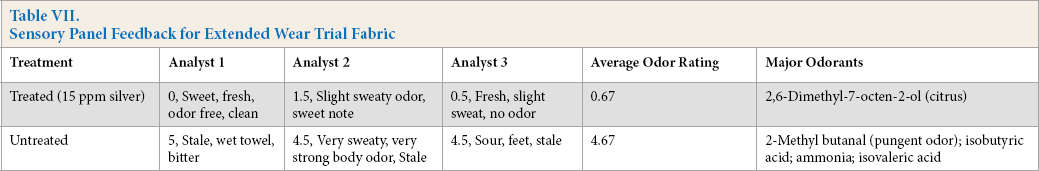
Sensory studies using an internal odor panel were conducted to support laboratory antimicrobial and absorption odor studies. Tree odor studies were completed using the silver-polymer complex. These included an extended wear trial to assess odor control without laundering (Table VII), and two wash studies where milk was used as a nutrient source for producing microorganism-dependent odor. In the extended wear study, HS-GC-MS results and blind odor panelist evaluations were completed to characterize the shirts (Table VII). Table VII represents the summaries of the five different shirts and their odor descriptions. Sniff testing by each analyst demonstrated dramatic characterization differences between the treated and untreated garments. Feedback across wearers was consistent with sweet/fresh being associated with treated materials (<1 rating) and stale corresponding to untreated fabrics (>4 rating). Common odorants measured on shirts from four of the five wearers included 2-methyl butanal, isobutyric acid, and IVA. Ammonia was found across all untreated fabrics.
Sensory Panel Feedback for Extended Wear Trial Fabric
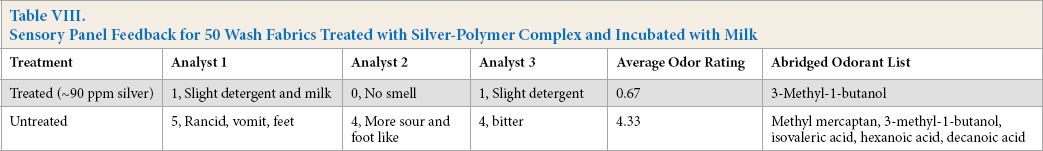
In addition to the extended wear test, silver-polymer treated and untreated fabrics were inoculated with milk to assess odor-control function after 50 wash cycles using TM 135. The treated test fabrics (90% polyester/10% Lycra) used in this study had silver levels of ∼90 ppm. Soiled fabrics containing proteins, sugars, fats, and salt from the milk, plus a low level of viable bacteria inherent to the fabric, were incubated to promote odor; all samples were blindly characterized by the odor panel (Table VIII). Similar to the wear studies, antimicrobial treatments lead to positive odor descriptions in contrast to the untreated samples. HS-GC-MS measurements substantiated the qualitative tests identifying the key odor contributors known to produce negative sensory responses. 2
Sensory Panel Feedback for 50 Wash Fabrics Treated with Silver-Polymer Complex and Incubated with Milk
To conclude the odor testing, two additional antimicrobial chemistries were evaluated to compare with the results from the silver-polymer complex tests. These included zinc pyrithione (ZPT) and 3-(trimethoxysilyl)propyl-dimethyl-octadecyl ammonium chloride (also known as Quat Silane, QS). ZPT and QS were applied at ∼3000 ppm by weight of active agent on 90% polyester/10% Lycra, while the silver-polymer complex was used at ∼90 ppm. Treated and untreated fabrics were laundered 50 times using TM 135 by Dow and the Drycleaning and Laundry Institute (Fig. 4) prior to milk addition. All fabrics demonstrated 2 to 3 log reduction by TM 100 using E. coli after washing. Statistical differences in relative odor contributions were quantified using a 1 to 5 scale across untreated controls and treated samples. These studies suggested exceptional odor-control performance by the silver-polymer complex, as compared to QS and ZPT treated fabrics, at a significantly lower use level of active agent. Inadequate odor control by QS and ZPT may be a result of antimicrobially active organic load contamination during washing, chemical stability of the active agent, and/or limitations in odor control mechanism (e.g. antimicrobial and absorption odor control).
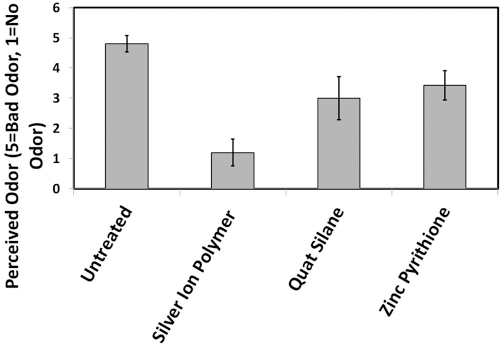
Milk-odor study comparison between QS, ZPT, and silver-polymer complex antimicrobial odor technologies.
Conclusion
Herein, we have provided antimicrobial performance, odor control, and proposed mechanistic details involving use of a novel silver-polymer complex technology for textile treatment. To further support holistic odor control, gas chromatography (GC) techniques and sensory tests were introduced to assess the silver-polymer complex's effectiveness at controlling and neutralizing malodors. Odor-prevention benefits of the silver-polymer complex were demonstrated by the inhibition of leucine conversion to isovaleric acid (IVA). Because of the soft acid nature of silver, select thiol and fatty acid odorants were also neutralized on cotton fabrics due to strong complexation. Holistic odor-management benefits were further demonstrated from odor sensory panel testing with seven-day wear trials and milk-based odor generation techniques after 50 launderings. Furthermore, comparison of the silver-polymer complex to commercially-available antimicrobials confirmed odor-control advantages of the former using milk as an odor-generating surrogate. Overall, the silver-polymer complex demonstrated promise in delivering true odor protection for both apparel and home textile consumers.
Footnotes
Appendix 1
GC-MS Parameters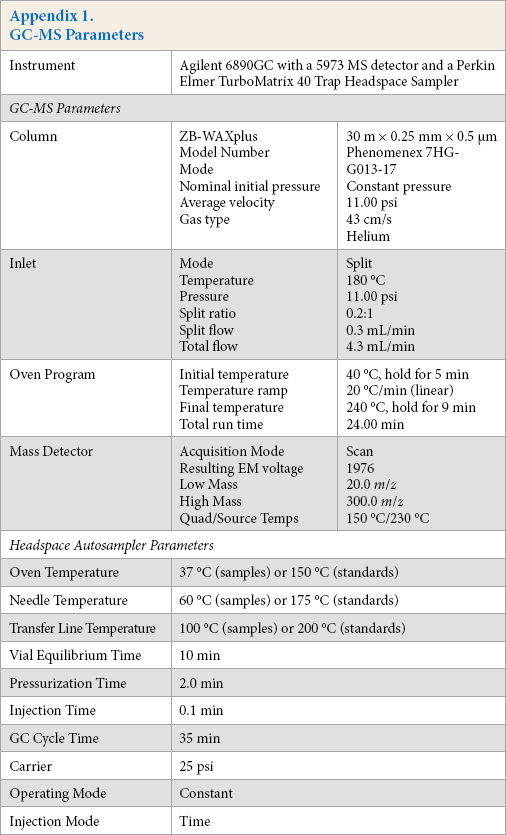
Instrument
Agilent 6890GC with a 5973 MS detector and a Perkin Elmer TurboMatrix 40 Trap Headspace Sampler
GC-MS Parameters
Column
ZB-WAXplus
Model Number
Mode
Nominal initial pressure
Average velocity
Gas type30 m × 0.25 mm × 0.5 μm
Phenomenex 7HG-
G013-17
Constant pressure
11.00 psi
43 cm/s
Helium
Inlet
Mode
Temperature Pressure Split ratio Split flow Total flowSplit 180 °C 11.00 psi 0.2:1
0.3 mL/min 4.3 mL/min
Oven Program
Initial temperature Temperature ramp Final temperature Total run time
40 °C, hold for 5 min 20 °C/min (linear) 240 °C, hold for 9 min 24.00 min
Mass Detector
Acquisition Mode Resulting EM voltage Low Mass High Mass Quad/Source Temps
Scan 1976 20.0 m/z 300.0 m/z 150 °C/230 °C
Headspace Autosampler Parameters
Oven Temperature
37 °C (samples) or 150 °C (standards)
Needle Temperature
60 °C (samples) or 175 °C (standards)
Transfer Line Temperature
100 °C (samples) or 200 °C (standards)
Vial Equilibrium Time
10 min
Pressurization Time
2.0 min
Injection Time
0.1 min
GC Cycle Time
35 min
Carrier
25 psi
Operating Mode
Constant
Injection Mode
Time