
Abstract
In this study, a hydrophilic modified polyester/PET fiber was prepared with waste PET bottles as a raw material. The PET bottles were first pelletized and used as both feed stock and for purified terephthalic acid (PTA) preparation. Glycolysis of PET bottle chips was performed to give purified PTA that was used in copolymer synthesis. Hydrophilic modified polyester was prepared from 5-sodiosulfoisophthalic acid (SIPA) and ethylene glycol, and this was copolymerized with purified PTA. The resulting alkali-soluble modified polyester and PET bottle chips were blended. After hollow spinning and alkali treatment, a good hydrophilic modified polyester fiber was obtained. Rheological properties of the modified fiber were studied, and the effect of alkali treatment on the thermal properties, water absorption, and morphology of the fibers were investigated.
Introduction
Plastic polyester (PET) bottles, with the advantages of low density, waterproof performance, high durability, mature production technology, and low cost, are increasingly used worldwide.1–3 However, the problem of environmental pollution and waste of resources caused by PET bottles has also caused concern, with many countries devoted to recycling these materials.4–9
PET resin particles can be used as a substitute for sand in traditional concrete. Rahmani indicated that compared to conventional concrete, concrete containing PET particles exhibited lower elastic modulus and splitting tensile strength, while having a porous structure. 10 Changizi regenerated polyester fiber with waste polyester bottles as a raw material for geotextiles. The mechanical properties of rock and soil were studied by using nano-silica (nano-SiO2) with polyester fiber. Shear strength and unconfined compressive strength (UCS) test data were obtained. The results showed that the mechanical properties were improved by the addition of regenerated polyester fiber and nano-SiO2. 11 Researchers developed a new method to achieve rapid decomposition of plastic bottles in a microwave to produce ethylene glycol and terephthalic acid (PTA). The energy consumption of this new method is only one-fourth that of the traditional decomposition method. The new method first cuts plastic bottles into pieces, and then sodium hydroxide and alcohol were added. After microwave heating for 1.5 min, ethylene glycol and PTA was produced. Ethylene glycol can be used in the production of polyester fiber and antifreeze, and high-purity PTA can be used in the production of paint and plastic containers. GE Plastics Company developed a “green” way to produce polybutylene terephthalate (PBT) resin and PBT/polycarbonate (PC) mixture. Allegedly, the method is helpful in reducing greenhouse gas emissions and minimizing wastes discharge. The application of this kind of resin from recycled PET bottles can make up 85% of the demand in automotive industry.12–14
The use of polyester fiber in textile materials is extensive. But polyester fiber has some shortcomings, including poor handle and warmth retaining properties.15–17 Cotton fiber is an important raw material for the textile industry, with excellent moisture absorption, softness, warmth, and many other advantages. Shortage of cotton resources and excessive production capacity of conventional polyester 18 has drawn China's attention toward developing “super imitation cotton” to make up the demand for textile fiber. 19 Therefore, recycling of waste polyester bottles and preparation of hydrophilic modified polyester fibers with good performance abilities can not only achieve resource reuse, but also lead to new types of performance fibers.
Using waste PET bottles as a raw material, through a chemical recycling process, to prepare a polyester copolymer, and then blending the polyester copolymer and PET bottle chips to produce yarn, this research successfully prepared a hydrophilic polyester copolymer/PET fiber with a moisture regain rate of 1.3%.
Experimental
Chemicals
After washing, waste polyester bottles were pelletized to give PET bottle chips. The average melting point and intrinsic viscosity of this polyester was 259 °C and 0.64 dL/g, respectively. The main chemical reagents used were dodecyl dimethyl benzyl ammonium chloride and sodium hydroxide (AR grade, Tianjin Kermel Chemical Reagent Co. Ltd.)
Copolyester Preparation
The polyester copolymer (copolyester), which contained aryl sulfonic acid groups, was prepared in three steps. First, a portion of the waste polyester bottle chips underwent glycolysis using ethylene glycol for 2 h at 135 °C to produce ethylene glycol terephthalate. Next, the purified PTA and SIPA were each separately esterified with ethylene glycol for 4 h at 250 °C. Finally, the two esterification products were copolymerized for 1.5 h at 275 °C to produce the copolyester. The specific reaction process is given in Fig. 1. The melting point and intrinsic viscosity of the copolyester were 222 °C and 0.5 dL/g, respectively. Please contact authors for information regarding the final copolymer composition.
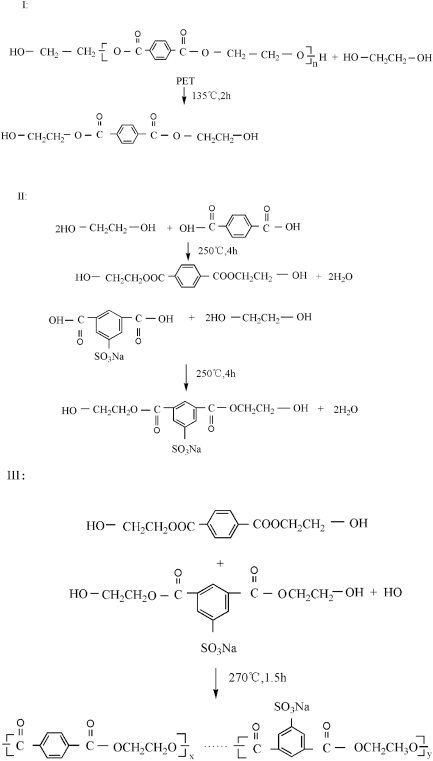
Synthesis of copolyester.
Fiber and Fabric Preparation
The PET bottle chips were dried at 175 °C for 3.5 h and the copolyester was dried at 135 °C for 3.5 h. The PET bottle chips were blended with the copolyester in a 94:6 ratio and put into the extrusion machine for melting at 220 °C. The fiber was then extruded from the wire hole and wound after cooling. After stretching, the hollow blended fiber was obtained (165 dtex/48 f). Fabrics were successfully woven from these fibers on a knitting machine. The fabric structure is shown in Fig. 2. The weight of the fabric was 0.0082 g/m2. After treatment with 3% (w/w) dilute alkali solution at 65 °C for 30, 60, or 90 min, the hydrophilic copolyester/PET fabric was obtained.
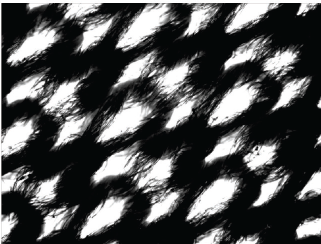
Fabric structure.
Analysis and Testing
Rheological Properties
A capillary rheometer (Rosand RH2000, Malvin Co.) was used. The capillary length diameter ratio was 8 mm/0.5 mm. The test temperature was 270–290 °C.
Differential Scanning Calorimetry Analysis
Differential scanning calorimetry (DSC) was performed on a DSC-Q2000 (TA Instrument Co.) instrument. Samples of 5∼10 mg, placed in a DSC pan, were heated from 30 to 270 °C at a rate of 10 °C/min under a constant flow of nitrogen gas. The samples were then cooled to –20 °C at a rate of 10 °C/min under a continual nitrogen gas flow.
Termogravimetric Analysis
Termogravimetric analysis (TGA) of samples was performed using a TGA-Q50 (TA Instrument Co.) at a heating rate of 10 °C/min under a constant nitrogen gas flow (100 mL/min). The temperature ranged from 0 to 600 °C.
Scanning Electron Microscopy
The fiber structures and surface morphology were observed using a JSM-6360LV scanning electron microscope (SEM). The fabric was sprayed with gold and then tested.
Fabric Alkali Reduction
Fabric (Fig. 2) alkali treatment was carried out at 100 °C using a 3% w/w NaOH. Eq. 1 was used to calculate alkali reduction rate.

G1 is the weight (g) of the untreated fabric and G2 is the dry weight (g) of the fabric after alkali treatment.
Water-Retention Rate
The fabric was immersed in water for ∼24 h. It was taken out and its partial moisture was removed by gravity. The fabric was then placed in a centrifuge tube (Fig. 3) and centrifuged for 5 min at 4000 rpm. It was removed, weighed, and then dried to a constant weight in a drying oven at 105 °C. Each set of samples had four replicates treated in this way, and the average value of the water-retention rate was the water-retention rate for each group.
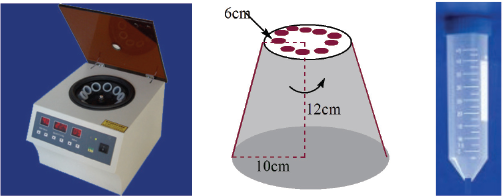
Schematic diagram of a centrifuge.
The water-retention rate (

G3 is the wet weight (g) of the fabric after centrifugal dewatering and G4 is the weight (g) of the fabric after drying.
Moisture Regain
Fabric comfort is directly affected by the moisture absorption properties of textile materials. Moisture regain reflects the process of moisture absorption. There are a variety of methods for testing moisture regain. In this study, the oven drying method was used to test the moisture regain of the yarn.
The treated fabric was placed under standard conditions (20 ± 1 °C and 65 ± 5% relative humidity) for 48 h. It was then weighed and dried to a constant weight in a drying oven at 105 °C. Each set of samples had four replicates treated in this way, and the average value of moisture regain was the moisture regain for each group.
Moisture regain (
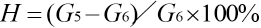
G5 is the fabric weight (g) after conditioning at constant temperature and humidity for 48 h; G6 is the weight (g) of the fabric after drying.
Results and Discussion
Flow Performance Analysis—Copolyester
Polyester is processed in a molten state. Fig. 4 shows the relationship between shear stress (lgτ) and shear rate (lgγ) of the copolyester. Fig. 5 show the relationship between shear viscosity (lgη) and shear rate (lgγ) of the copolyester.
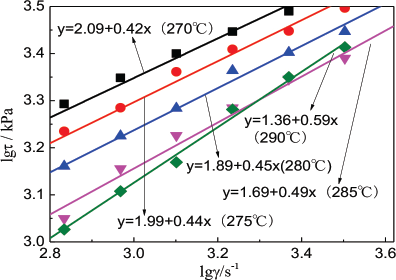
Relationship between lgτ and lgγ of copolyester.
As shown in Fig. 4, τ increased with the increase in γ at the selected test temperature, and there was a linear relationship between lgτ and lgγ, with slopes all less than 1 under the test conditions. This indicates that the flow behavior of the melt was the pseudo-plastic non- Newtonian fluid flow of a linear polymer. At the same γ value, the η value gradually increased with increasing temperature. This is mainly due to the increased free volume and weakening of molecular interaction forces, which is conducive to the movement of large molecules, at increased temperatures. Thus, the flow was enhanced, and the flow behavior was close to that of a Newtonian fluid.
Fig. 5 shows that η of the copolyester decreased with the increase in γ, and a “shear thinning phenomenon” was observed, which was similar to the rheological behavior of pure PET. From a macro perspective, the rheological behavior of the copolyester remained very similar to the original PET.
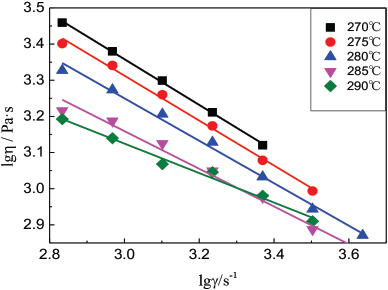
Relationship between lgη and lgγ of copolyester.
Thermal Performance Analysis—Copolyester
DSC Analysis
Fig. 6 shows the DSC curves of copolyester and PET. The glass transition temperature (Tg) and melting temperature (Tm) of the copolyester were lower than those for PET. This is because the inclusion of a flexible chain segment and the heterogeneous aryl sulfonic acid group destroyed the regularity of the original PET structure, reducing the degree of order. In addition, the PET polyester showed a cold crystallization temperature (Tcc) and a crystallization temperature (Tc). But there were no Tcc or Tc. values for the copolyester. Due to the poor flexibility of the PET molecular chain, the general cooling process for PET was not long enough for crystallization to be completely carried out. However, during the next heating process, when the temperature reached a certain degree, the molecular chains oriented in the lattice, and cold crystallization occurred. In the copolyester structure, the flexible molecular chain, combined with the aryl sulfonic acid groups, destroyed the regularity of the structure and was, therefore, not conducive to crystallization. This explains why the crystallization temperature disappeared and the bonding temperature of the copolyester was lower. Therefore, during copolyester drying, it should be appropriate to reduce the drying temperature to avoid blocking due to high temperature.
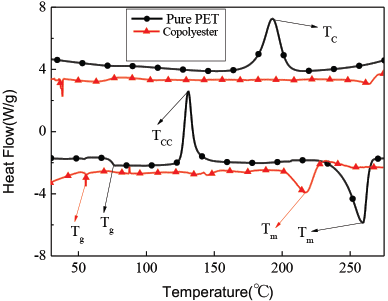
DSC characterization of copolyester.
Termogravimetric Analysis
Fig. 7 shows the thermogravimetric analysis (TGA) and dTGA curves of the copolyester and the PET. The starting thermal decomposition temperature of the copolyester, the end temperature, and the maximum thermal degradation rate were greater than that of PET. This indicated that the thermal stability of the copolyester was greater than that of PET due to the presence of aryl sulfonic acid groups in the former.20–22
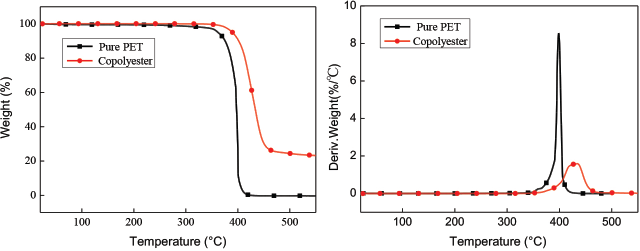
TGA and dTGA curves of copolyester.
Fiber SEM Analysis
Because PET contains aromatic groups and relatively rigid molecular chains, PET fabrics feel stiff. To improve its performance, it is necessary to regulate the PET fiber cross-section and fiber modulus. We prepared a copolyester/PET fiber with pits and micro pores by hollow blend spinning and alkali reduction (Fig. 8). Fig. 8 shows that, with the extension of processing time, the surface pores of the fiber were increased. This microporous and hollow structure can allow a layer of still air to form on the fiber surface, thus large amounts of air can be stored, and the performance was improved. 18
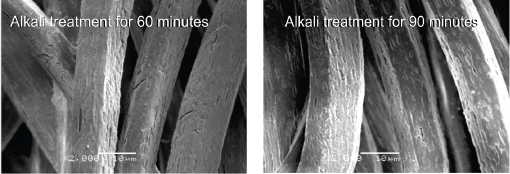
SEM analysis of fibers.
Fabric Thermal Performance Analysis
DSC Analysis
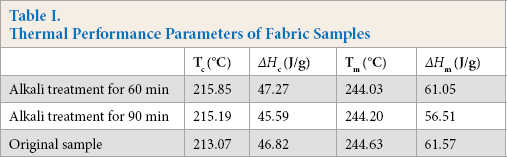
Fig. 9 shows the DSC analysis of the copolyester/PET fabric with respect to processing times. The corresponding data is listed in Table I. The crystallization peak temperature of the fabric after alkali treatment was 215–216 °C and its crystallization range was narrow. The crystallization peak temperature of the fabric without alkali treatment was 213 °C. The crystallization temperature and crystallization perfect degree of the fabric was improved after alkali treatment. This is because there are two components of the fabric before the alkali treatment: PET and copolyester. Of them, the copolymer's crystallization ability is poor. Its existence is equivalent to “impurities” in the system, which has great influence on the molecular motion of the polyester. Therefore, at a lower temperature, the polyester begins to crystallize. However, after alkali treatment, the copolymer in amorphous regions are dissolved, improving its oriented structure. Thus, at a relatively higher temperature, the ordered arrangement can be achieved, which leads to the increase in crystallization temperature. There was an insignificant change in the melting points of the fabric before and after alkali treatment, but all the melting points were lower than that of the PET alone. Before alkali treatment, the intermolecular forces acting on the copolyester in the fabric was less and the conformation entropy greater. The overall result led to the decreased melting point. In addition, hydrolysis of PET occurred, which resulted in a decline in the molecular weight of polyester and a lower melting point.23,24
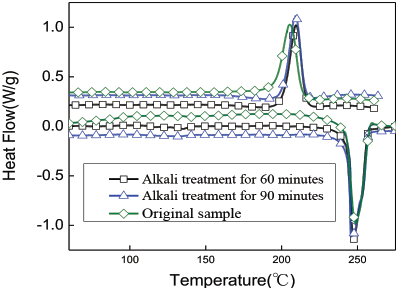
DSC curves of fabrics.
Thermal Performance Parameters of Fabric Samples
TGA Analysis
Fig. 10 shows the TGA curve of the fabric. At different processing times, the starting and end temperatures of thermal decomposition did not change much. The thermal decomposition starting and end temperatures were 387 °C and 470 °C, respectively. The effect of alkali treatment time on the thermal decomposition properties of the fabric was insignificant.
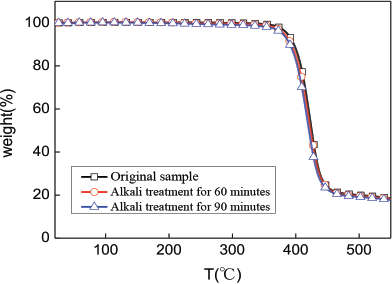
TGA curves of fabrics.
Fabric Alkali Reduction Analysis
The fabric alkali reduction rate increased with the increase in alkali hydrolysis time (Fig. 11). This is because the alkali treatment was a double diffusion reaction process. The fiber surface wetting swelling degree increased with time; the double diffusion reaction was carried out in full. The probability of chain fracturing increased in the amorphous region. As the alkali reduction rate increased, a greater number of micro holes were created on the fiber surface, leading to a rougher surface and improved fiber moisture absorption.
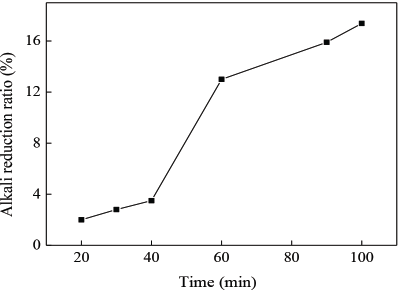
Change of alkali reduction rate of fabrics at different times. (Alkali treatment conditions: NaOH concentration: 3%; Processing temperature: 100 °C)
Fabric Water-Retention Rate
The fabric water-retention rate was greater as the alkali treatment time was extended due to the increased number and volume of micro holes created by prolonged alkali treatment (Fig. 12). Because of the capillary pressure of the micro pores, the water was sucked into the fiber. At a certain centrifugal velocity, the capillary pressure was greater than or equal to the centrifugal force; the water inside the pores can be preserved within the fiber, 16 increasing the water-retention rate of the fabric.25–27
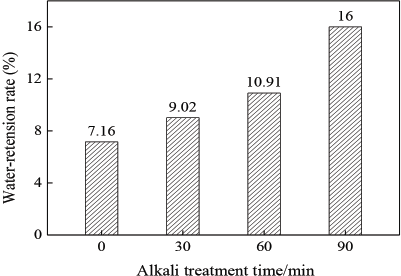
Water-retention rate of fabrics.
Fabric Moisture Regain
Moisture regain measures the amount of the fiber moisture absorption performance. 8 With the extension of alkali treatment time, the copolyester/PET fabric moisture regain increased (Fig. 13). This was due to the increased presence of micro pores in the fiber, along with the increased fiber specific surface area. Accordingly, the surface adsorption ability and the capacity of the fiber surface to adsorb water molecules were enhanced, improving fiber absorption performance.28–30
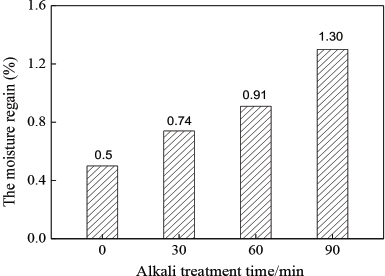
Moisture regain of fabrics.
Conclusions
A hydrophilic copolyester was prepared from recycled PET by first performing glycolysis on the PET and subsequent ethylene glycol esterification to produce the esterified PTA monomer. A second monomer, ethylene glycol esterified SIPA, was synthesized and the two monomers were copolymerized to give the copolyester. The copolyester was blended with recycled PET, and then spun into yarn and used for fabric creation.
The copolyester showed the thinning fluid characteristics of a typical shear. The glass temperature and melting point of this copolyester, which contained aryl sulfonic acid groups, were lower than those of ordinary polyesters. The thermal stability of this copolyester was greater than that of PET itself. Under given conditions, the copolyester did not show cold crystallization and hot crystallization values. With increased alkali treatment time, the alkali reducing rate of the copolyester/ PET fabric increased. This increased treatment time led to an increase in micro holes appearing on the fiber surface, as well as increased surface roughness. Additionally, the moisture regain, water retention rate, and water absorption of the fabric improved with this treatment.
Footnotes
Acknowledgement
The authors would like to acknowledge funding for this research contributed by the National Natural Science Foundation of China (NSFC) (No: 51373027) and the Natural Science Foundation of Liaoning Province, China (No: 2015020221) for their assistance with this research.