
Abstract
Poly(vinyl alcohol) (PVA) hydrogel nanofibers are a potential candidate for textile-based drug-release applications. Polycarboxylic acids 1,2,3,4-butanetetracarboxylic acid (BTCA) and citric acid (CA) are low-cost alternatives reported to easily crosslink electrospun PVA hydrogel. These can be directly added into the spinning solutions. One of the most efficient non-steroidal anti-inflammatory drugs (NSAIDs), Naproxen (NAP), was selected as a model drug for this study. The release mechanisms of drug-loaded electrospun PVA nanofibers are based on the diffusion of the drugs through the swollen PVA fibrous matrix and the release due to partial dissolution of the matrix. Control over drug-release characteristics can be provided through partial crosslinking of the PVA fibrous matrix.
Introduction
Electrospinning has attracted a great deal of attention due to its relative ease of use, adaptability, ability to create fibers on the nanometer scale,1,2 potential for surface modification,3,4high surface area to volume or mass ratio, small inter-fiber pore size, and high porosity.1,3,4 The design and production of drug-loaded nanofiber-based materials generated by electrospinning is of interest to innovative drug-delivery systems. One of the main advantages of the electrospinning process over the conventional film-casting technique is the highly-porous structure of electrospun fiber mats, which exhibit greater surface area that presumably could allow drug molecules to diffuse out of the matrix much more controlably. 5 In terms of material selection, electrospun poly(vinyl alcohol) (PVA) hydrogel nanofibers are believed to be a potential candidate for drug-release applications. PVA is a hydrophilic polymer with good chemical and thermal stability.6,7 Electrospun PVA nanofibers have been one of the most extensively-studied topics due to its biocompatibility, nontoxicity, hydrophilicity, and ease of processing.8,9
Many researchers have studied drug release from PVA fibers in recent years.5–7,10,11 The release mechanisms of drug-loaded electrospun PVA nanofibers are based on diffusion of the drugs through the swollen PVA fibrous matrix and release due to partial dissolution of the matrix.6,7,10 Control of drug release can be provided through partial crosslinking of the PVA fibrous matrix. 10 Methanol treatment and chemical crosslinking with glutaraldehyde or glyoxal are the most common treatments found in the literature.12,13 However, the drug can be entrapped in the fibers, as happens during methanol treatment. 7 Glutaraldehyde has been widely used to crosslink biopolymers for medical applications. However, contradictory results have been published on the cytotoxicity of glutaraldehyde-crosslinked biomaterials. 14 Moreover, in the vapor state, glutaraldehyde has a pungent odor, with an odor threshold of 0.04 ppm. 15 It is also difficult to handle during crosslinking because of its odor and low vapor pressure. 14 The bifunctional reagent glyoxal is also used to crosslink functionalized macromolecules such as cellulose and PVA. Glyoxal (40%) is moderately toxic by the oral route, has a lower toxicity by the dermal route, and is moderately toxic by inhalation. It causes slight to definite skin irritation depending on the exposure duration. 16
Electrospun PVA nanofibers containing model drugs could be crosslinked with the vapor from the aqueous solution of either glutaraldehyde or glyoxal, followed by heat treatment. This method could minimize the toxicity of these crosslinkers.9,10 But vapor-induced crosslinking needs post-treatment and it is difficult to achieve reproducible results with this approach.
Therefore, in the present study, the polycarboxylic acids 1,2,3,4-butanetetracarboxylic acid (BTCA) and citric acid (CA) were selected as crosslinking agents for loading Naproxen (NAP) into electrospun PVA hydrogels (Fig. 1). BTCA and CA are low-cost alternatives that were reported to easily crosslink electrospun PVA hydrogels.12,13 Another advantage is their miscibility with PVA electrospinning solutions, allowing them to be directly added into the spinning solutions. They are known non-formaldehyde crosslinking reagents. Esterification can occur with heat and accelerated by the presence of catalysts.17,18 Because of the melting temperature of NAP (∼153 °C), cyanamide was selected as a catalyst to reduce the crosslinking temperature. 17 Potential issues with cyanamide toxicity may limit its practicality for use in drug-release formulations for human use and alternatives should be further investigated. 19
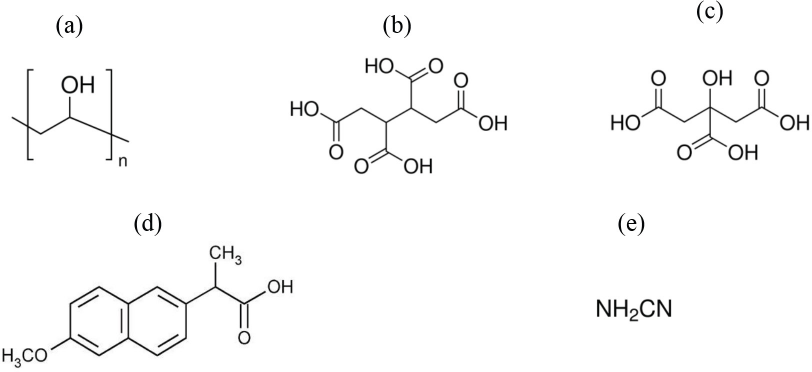
(a) PVA, (b) BTCA, (c) CA, (d) NAP, and (e) cyanamide structures.
The toxicological properties of BTCA have not been fully determined. George et al. studied BTCA in rats and gavage doses of up to 1000 mg per kg on days 6–19 were not associated with any adverse fetal changes.20,21 Hebeish et al. used BTCA in the green synthesis of antimicrobial cotton fabrics. They used chitosan having different molecular weights along with nontoxic BTCA. 22 CA is rated as nutritionally harmless since it is a nontoxic metabolic product of the body 23 and it has been approved by the US Food and Drug Administration (FDA) for using in food formulations. 24
The use of electrospun fibers as drug carriers is promising in the future of drug-delivery applications, especially for pain-related topical administrations. Non-steroidal anti-inflammatory drugs (NSAIDs) are used for controlling pain and inflammation in rheumatic diseases. NAP, which is one of the most efficient NSAIDs,25,26 was selected as a model drug for this study.
NAP-loaded PVA hydrogel nanofibers were prepared and characterized. Crosslinking of these nanofibers with poly-carboxylic acids and its effect on the resultant nanofiber morphology, swelling behavior, and weight loss were investigated. NAP release characteristics were also studied.
Experimental
Materials
PVA with an average molecular weight of ∼125,000 g/mol, NAP, BTCA, CA, and cyanamide were purchased from Sigma Aldrich Chemical Co. Chemical structures are given in Fig. 1.
Electrospinning Solution Preparation
A weighed amount of PVA was dissolved in distilled water at 100 °C to prepare an aqueous PVA stock solution at a fixed concentration of 10% w/w. It was stirred for 4 h and cooled to room temperature (RT) with stirring. BTCA or CA crosslinking agent was then directly added into the spinning solution with cyanamide as a catalyst at a ratio of 2:1 (w/w), followed by stirring for 15 min. The concentration of the BTCA and CA were fixed at 20% (w/w of polymer) based on preliminary studies. 10% (w/w of polymer) NAP was dispersed in the PVA solution by stirring for 4 h prior to electrospinning.
Electrospinning
Electrospinning of the polymer solutions was carried out by a set-up consisting of a syringe (10 mL) and a stainless-steel needle (1.5-cm long, 22 gauge, with a fat tip), a ground electrode and a high voltage supply (Simco, MP Series CM5 30 P, Charging Generator Output 30 kV DC). Polymer solutions were electrospun at a voltage of 18 k V, a tip-to-collector distance of 15 cm, and a feed rate of 0.5 and 0.7 mL/h. All electrospinning experiments were performed at RT (22 ± 2 °C) with a relative humidity (RH) of 22–40%.
A grounded, stationary rectangular metal collector covered by a piece of aluminum foil was used for nanofiber deposition. Electrospinning of each sample was carried out for 10 h and 20 h.
After electrospinning, PVA/BTCA and PVA/CA nanofibers were heat set at 110 °C for 20 min in an oven to enhance the esterification reaction.
Characterization
Except for the drug release studies, all characterizations were carried out with 10 h collected PVA nanofibers, because the collection period affected the thickness of the nanofiber mats and not the material properties. However, for the drug release studies, the percentage of the released drug was affected by mat thicknesses, which are directly related to the diffusion path of the drug.
Electrospinning Solution Characterization
Viscosity of the polymer solutions was measured by using a Brookfield DV-III Rheometer with the SC4-27 spindle type at 30 rpm. Surface tension measurements were carried out by a Kruss Easy Dyne Analyzer by the plate method. Conductivity measurements were carried out using a J.P. Selecta CD-2004 conductivity meter. All electrospinning experiments were performed at RT (22 ± 2 °C) with a relative humidity (RH) of 22-40%.
FTIR
Fourier transform infrared spectroscopy (FTIR) analyses were carried out to confirm esterification of PVA with BTCA or CA using a PerkinElmer FTIR spectrometer. Pure drug (NAP), neat PVA nanofibers (PVA), NAP loaded PVA (NAP/PVA), and BTCA- and CA- crosslinked NAP-loaded PVA nanofibers (NAP/PVA-BTCA and NAP/PVA-CA) were analyzed as their respective KBr pellets. Scans were obtained in the spectral range from 650 to 4000 crrr−1 with a resolution of 1 crrr−1. To eliminate ambiguity in FTIR analysis by simplifying ester carbonyl band analysis, a post alkaline treatment with 0.1 M NaOH solution at RT for 2 min, was also applied to NAP/PVA-BTCA and NAP/PVA-CA samples to convert carboxyl groups to carboxylate groups. 12
Nanofibrous Mat Thermal Properties
Thermal behaviors of NAP and PVA nanofibers were investigated by differential scanning calorimetry (DSC, TA Q10). NAP and electrospun nanofibers were sealed in an aluminum pan and heated under a continuous nitrogen purge at a rate of 50 mL/min and samples were scanned at a heating rate of 10 °C/min between 0 and 350 °C. Thermogravimetric analysis (TGA, Perkin Elmer TGA-4000) were carried out by heating samples from 25 to 600 °C at a rate of 10 °C/min under continuous nitrogen purge at a rate of 20 mL/min.
X-ray Diffraction
X-ray powder diffraction (XRD, Philips X'Pert Pro Powder X-ray diffractometer) patterns were determined for NAP and PVA nanofibers using Cu Kα radiation at a diffraction angle of 2θ from 5 to 50°.
Scanning Electron Microscopy
The morphology of PVA nanofibers were observed by scanning electron microscopy (SEM, FEI Quanta250 FEG). The electrospun nanofibers were sputtered using an EMI-TECH K550X ion sputtering device with a thin layer of gold deposited prior to SEM observation. The mean diameter of the resultant fibers was calculated from measurements on SEM images of 10,000× magnification by using the Image J program. Approximately 50 measurements were carried out from different parts of each sample.
Thickness Measurement and Statistical Analysis
The thicknesses of the nanofiber mats were measured using a Mitutoyo Digital Micrometer at 0.001 mm accuracy.
All fiber diameter and thickness measurements were expressed as mean ± standard deviation (SD). Data were analyzed by one-way ANOVA followed by a Tukey HSD post-hoc test. Differences of p < 0.05 were considered statistically significant.
Nanofibrous Mats Swelling and Weight Loss
Swelling and weight loss of the NAP-loaded electrospun non-crosslinked and BTCA- or CA-crosslinked PVA nanofiber mats were measured upon exposure in phosphate buffer (PBS) at pH 7.4 (37 °C) for 24 h. The samples were then removed from the medium and carefully blotted with tissue paper to remove the excess buffer from the surface. The degree of swelling due to the water uptake 27 and weight lossl2were then determined. The percentage of degree of swelling and weight loss were calculated by Eqs. 1 and 2, respectively.
M was the weight of each nanofiber mat sample upon exposure in PBS for 24 h, Md was the weight of the PVA fibers after swelling and subsequent drying, and Mi was the initial sample weight.
In Vitro Drug Release
The total immersion method was used to study the release characteristics of the drug from the NAP-loaded electrospun PVA nanofiber mats. The samples (3 × 3 cm) were accurately weighed and immersed in a glass bottle containing 40 mL PBS, and the bottles were incubated in a horizontal incubation shaker (Thermo-Scientific MaxQ6000) at 37 ± 0.5 °C and 60 rpm.
At a specified immersion period ranging between 0 and 24 h, 0.5 mL of the sample was taken out at selected times and an equal volume of medium was returned to the system after withdrawal. The samples were then assayed spectrophotometrically using an Evolution Array UV-Visible spectrophotometer (Termo Fisher Scientific) at 263 nm. The experiments were carried out in triplicate. The release of the drug from the samples was reported as cumulative drug release as a function of the immersion period. The calibration curve was linear for NAP (r > 0.99) across the concentration range of 0.625–50 μg/mL. The maximum absorbance measurement results were adapted to this calibration curve.
Results and Discussion
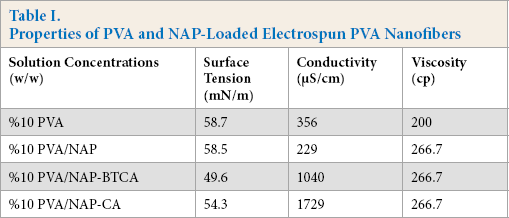
The composition of the spinning solution is directly related to the resultant fiber morphology. Table I displays changes in some of the most important solution parameters after the addition of BTCA or CA. The conductivity of the solutions showed an increase with BTCA or CA addition, due to the carboxylic groups present in both. Solutions with BTCA or CA added had the same viscosity values when compared to the pure PVA solution. However, there was a slight decrease in the surface tension with the addition of BTCA or CA. NAP addition didn't significantly affect the surface tension of the PVA solutions. Electrospinning of PVA/NAP-BTCA or PVA/NAP-CA solutions were easier than that of the pure PVA solution due to the higher conductivity and decreased surface tension of the solutions, which decreased the diameter of the resulting nanofibers.
Properties of PVA and NAP-Loaded Electrospun PVA Nanofibers
FTIR of NAP-Loaded Electrospun PVA Nanofibers
The interaction between PVA nanofibers and NAP and the esterification of PVA with BTCA or CA was investigated by FTIR spectroscopy. Fig. 2 shows the FTIR spectra of NAP and neat PVA, non-crosslinked NAP/PVA, NAP/ PVA-BTCA, and NAP/PVA-CA nanofibers. Key NAP peaks included peaks at 1603 cm–1 due to υ(C–C) modes of the aromatic groups, 30 and at 1226 cm–1, indicative of the -O-stretch.25,31,32 In addition, the vibrational modes detected at 1026 cm–1 that correspond to C–O–C bonds in NAP 33 can be seen at lower intensities in spectra of NAP/PVA, NAP/PVA-BTCA, and NAP/PVA-CA nanofibers. New vibrational bands were observed for NAP/PVA-BTCA and NAP/PVA-CA nanofibers around 1714 cm–1, which are due to the formation of ester C=O groups. Additionally, two peaks were observed at 1142 cm–1, which can be assigned to the C-O ester stretch. 12
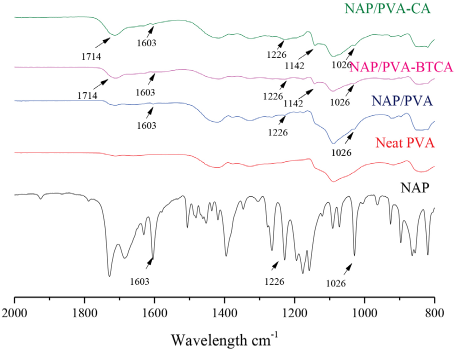
FTIR spectrum of pure NAP powder, 10 h produced neat PVA, NAP/ PVA, NAP/PVA-BTCA, and NAP/PVA-CA nanofibers.
Fig. 3 shows the FTIR spectra of NAP/PVA-BTCA and NAP/ PVA-CA nanofibers before and after post-alkaline treatment. A new band at 1556 cm–1 emerged after alkaline treatment that was attributed to carboxylate anions. 12 The ester C-O stretch band at 1142 cm–1 remained present at a lower intensity, which validated ester link formation between PVA, and BTCA or CA.
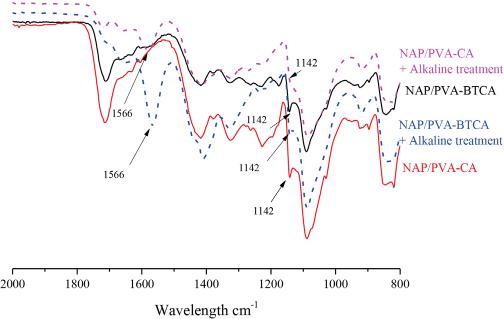
FTIR spectrum of 10 h produced NAP/PVA-BTCA and NAP/PVA-CA before and after post-alkaline treatment.
Termal Properties of NAP-Loaded Electrospun PVA Nanofibers
DSC thermograms of pure NAP powder, 10 h produced neat PVA, NAP/PVA, NAP/PVA-BTCA, and NAP/PVA-CA nano-fibers are shown in Fig. 4. Neat PVA mats exhibited a loss of moisture (a temperature range of ∼30–40 °C) coupled with a glass transition temperature (Tg) of ∼122 °C and a melting temperature (Tm) of ∼215 °C. The melting enthalpy (ΔHm) of neat PVA mats was 86 J/g. DSC thermogram of NAP/ PVA nanofibers were similar to neat PVA nanofibers with Tg = 99 °C, Tm = 207 °C, and ΔHm = 75 J/g. The observed Tm values of the PVA matrix in NAP/PVA nanofibers were not very different from that of the neat PVA nanofibers. But the presence of NAP between the PVA chains decreased hydrogen bonding resulting in the decrease of Tg from 122 °C to 99 °C. 34
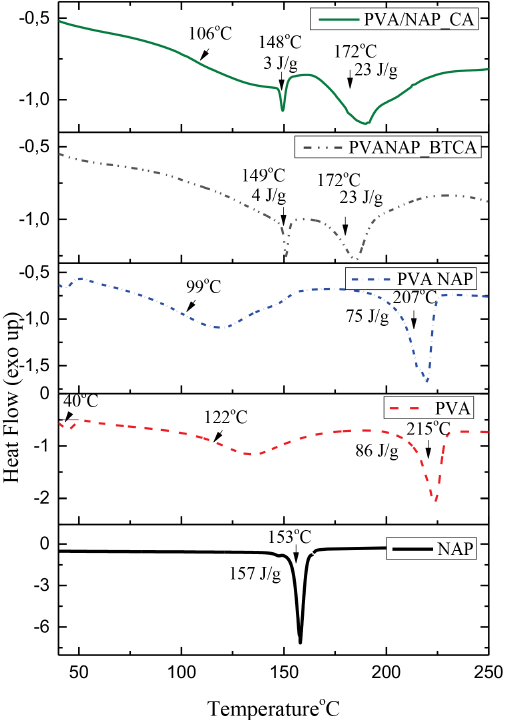
DSC thermograms of pure NAP powder, 10 h produced neat PVA, NAP/PVA, NAP/PVA-BTCA, and NAP/PVA-CA nanofibers.
DSC thermograms of NAP/PVA-BTCA and NAP/PVA-CA nanofibers were different from neat NAP/PVA and neat PVA nanofibers. Tg depends on the polymer chain rigidity for any pure polymer, but for a crosslinked polymer, chain rigidity depends on the crosslink density as well as on the chemical structure of the crosslinking agent. The PVA hydroxyl groups contribute, by hydrogen bonding, to the stiffness of the linear polymer. By introducing BTCA or CA as crosslinking agents into the PVA polymer, the number of hydroxyl groups diminishes and hydrogen bonding interaction decreases, which produced a diminution in the stiffness of PVA nanofibers. At the same time, new bridges are generated between the PVA chains through BTCA and CA; hence the Tg of NAP/PVA-BTCA and NAP/PVA-CA nanofibers were expected to be affected.34,35
The Tg of NAP/PVA-CA nanofibers was 106 °C, which was higher than that for the non-crosslinked NAP/PVA nanofibers, whereas NAP/PVA-BTCA nanofibers did not show a clear Tg value. For NAP/PVA-CA nanofibers, new bridges caused an increase in the Tg value, but for NAP/PVA-BTCA nanofibers, a higher crosslinking density likely caused somewhat greater PVA chain rigidity that resulted in the disappearance of Tg. 36
The Tm of NAP/PVA-BTCA nanofibers was 172 °C and the ΔHm was 24 J/g. NAP/PVA-CA nanofibers had nearly the same values: Tm = 172 °C and ΔHm = 23 J/g. For these nanofibers, melting temperatures and melting enthalpies were lower than for non-crosslinked PVA nanofibers, which could be explained by the decrease in crystallinity of the PVA matrix.34,37 Peaks at 149 °C (ΔHm = 4 J/g) and 148 °C (ΔHm = 3 J/g) in DSC thermograms of NAP/PVA-BTCA and NAP/PVA-CA nanofibers, respectively, could be assigned to melting peaks of NAP after heat treatment.
In Fig. 5, TGA thermograms of pure NAP powder, electrospun neat PVA, NAP/PVA, NAP/PVA-BTCA, and NAP/PVA-CA nanofibers were shown. In these curves, the electropsun neat PVA and NAP/PVA nanofibers lost about 6% of mass at temperatures up to 80 °C due to the evaporation of absorbed moisture, with the NAP/ PVA nanofibers exhibiting two steps of weight loss. The decomposition of neat PVA began ∼270 °C with half of its mass lost at 330 °C, leaving only ∼2 weight % residue at 600 °C. Neat PVA nanofibers had two degradation steps, with elimination reactions starting at ∼270 °C and polymer backbone breakdown (mostly chain-scission reactions) starting at ∼375 °C, leading to weight losses of ∼83% and ∼28%, respectively. 12 These temperatures were 306 °C and 387 °C for NAP/PVA nanofibers, with weight losses of ∼84% and ∼29%, respectively. The decomposition of NAP/PVA nanofibers at 360 °C resulted in half of its mass loss, leaving only a ∼5 weight % residue at 600 °C. The presence of NAP seemed to delay thermal degradation of the PVA matrix. 6
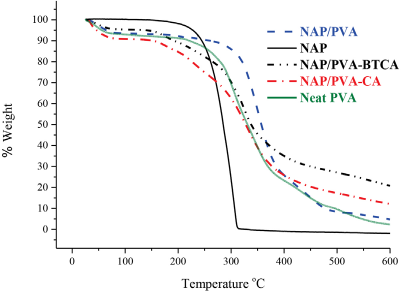
TGA thermograms of pure NAP powder, 10 h produced neat PVA, NAP/PVA, NAP/PVA-BTCA, and NAP/PVA-CA nanofibers.
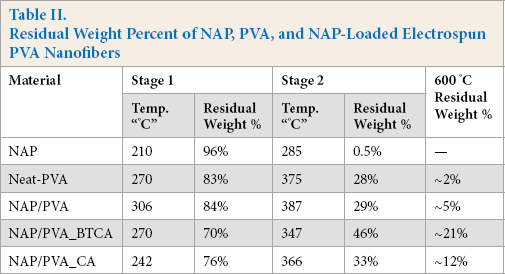
BTCA- and CA-crosslinked NAP/PVA nanofibers showed significantly different behaviors compared to neat and NAP/PVA nanofibers. The first stage of NAP/PVA-BTCA nanofiber thermal degradation started ∼270 °C (∼70 weight %) and the second stage started ∼347 °C (∼46 weight %). After the second step, due to chain-scission reactions, the NAP/PVA-BTCA nanofibers lost 54% of weight and left only ∼21 weight % residue at 600 °C (Table II). The NAP/ PVA-CA nanofibers showed similar behaviors to the NAP/ PVA-BTCA nanofibers. However, the first step of thermal degradation started ∼242 °C (∼76 weight %) and the second stage started ∼366 °C (∼33 weight %). After the second step, due to the chain-scission reactions, the NAP/PVA-BTCA nanofibers lost 67% of weight and left only ∼12 weight % residue at 600 °C. These results confirmed that increase in thermal stability was a direct consequence of crosslinking with BTCA and CA, and that BTCA crosslinking was more effective than CA crosslinking.
Residual Weight Percent of NAP, PVA, and NAP-Loaded Electrospun PVA Nanofibers
XRD of NAP-Loaded Electrospun PVA Nanofibers
The XRD patterns of pure NAP powder, 10 h produced neat PVA, NAP/PVA, NAP/PVA-BTCA, and NAP/PVA-CA nanofibers were recorded to investigate the possible differences in the crystallinity of the structures (Fig. 6). In the XRD of pure NAP powder, sharp peaks (at a diffraction angle of 2θ) of 6.5, 12.5, 13, 16.5, 18, 19, 20, 22, 23.5, 27, and 28.2 were present, suggesting that the drug was a crystalline material. 38 In general, when a polymer contains a crystalline region, the XRD peaks are sharp and their intensities are high, whereas for an amorphous polymer, they are broad. 39 Neat PVA presented a diffraction pattern that was completely diffused, reflecting the amorphous nature of the PVA matrix. However, BTCA- and CA-crosslinked nanofiber patterns showed a wide peak around the diffraction angle of 2θ at 19-20 due to the crosslinked structures.
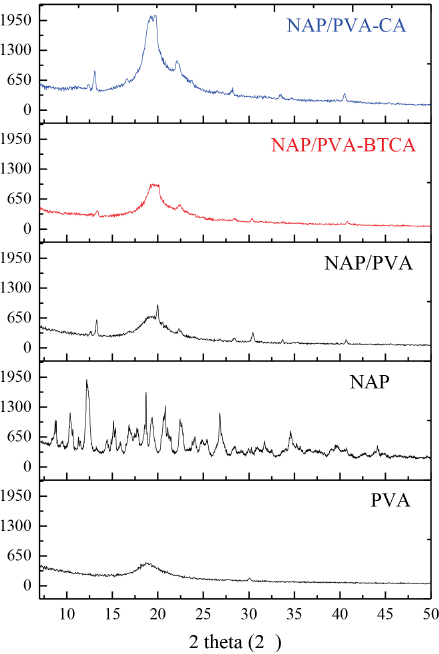
XRD diffraction patterns of pure NAP powder, 10 h produced neat PVA, NAP/PVA, NAP/PVA-BTCA, and NAP/PVA-CA nanofibers.
In the NAP-loaded nanofibers, the complete disappearance of the characteristic NAP XRD peaks was expected, indicating that the NAP in the electrospun PVA nanofibers was no longer present as crystalline material. However, a few peaks can be seen around the diffraction angle of 2θ; 13, 19, and 22 with lower intensities belong to NAP, suggesting that there could be some NAP crystallites in the PVA matrix.
Morphology of NAP-Loaded Electrospun PVA Nanofibers
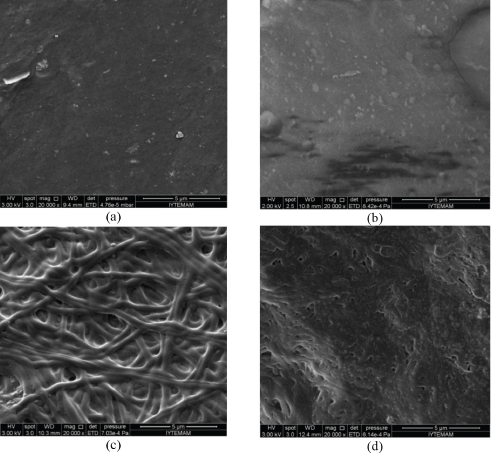
The SEM micrographs and mean diameter of the nanofibers and the mean thickness of the membranes are given in Fig. 7 and Table III, respectively. It was observed that NAP/ PVA-BTCA and NAP/PVA-CA nanofibers were successfully electrospun. No NAP crystals were detected by SEM either on the surface of the fibers or outside the fibers as shown in Fig. 7. This indicated that NAP was totally embedded within the fibers.
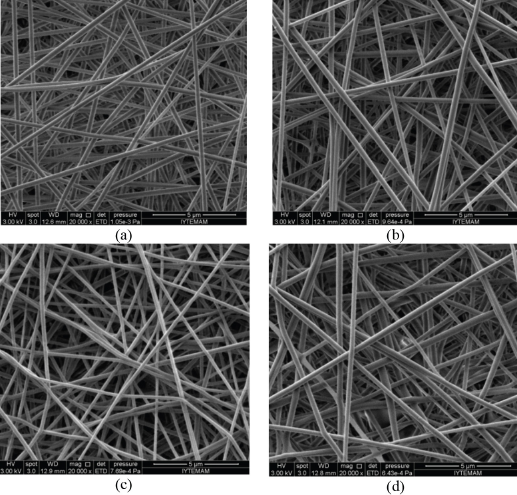
SEM Images of 10 h produced (a) neat PVA, (b) NAP/PVA, (c) NAP/ PVA-BTCA, and (d) NAP/PVA-CA nanofibers.
Mean Diameter of 10 h Produced PVA and NAP-Loaded Electrospun PVA Nanofibers
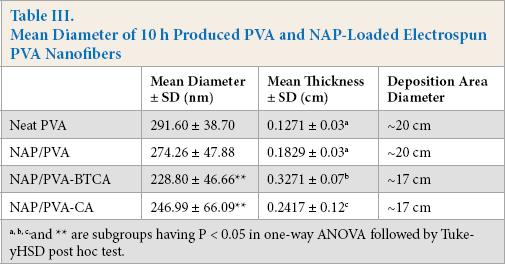
a, b, c, and ** are subgroups having P < 0.05 in one-way ANOVA followed by Tuke-yHSD post hoc test.
Differences in fiber diameters and thickness were analyzed by one-way analysis of variance (ANOVA) followed by a Tukey test for pairwise comparison. There was no significant effect on fiber diameter by the incorporation of NAP. Considering polycarboxylic acid crosslinking, the resultant fiber diameters decreased by the addition of BTCA or CA compared to non-crosslinked samples. This difference of p < 0.05 was considered statistically significant, but there was no significant difference between NAP/PVA-BTCA and NAP/PVA-CA nanofibers. The tukey subgroups are noted in Table III.
With regards to mean thickness of the nanofiber mats, NAP loading did not cause a significant difference in the thickness, whereas BTCA or CA addition caused statistically significant increases in thickness values. It is possibly related to the diameter of the deposition area. Addition of BTCA or CA reduced the jet path, and the bending instability caused spreading over a smaller area, which increased mat thickness. However, BTCA-added mats had better electro-spinability, making them thicker than CA-added mats
Swelling and weight loss of NAP/PVA, NAP/PVA-BTCA and NAP/PVA-CA nanofibers are given in Fig. 8. Without crosslinking, the degree of swelling of NAP/PVA nanofibers was ∼631%, while the percentage of weight loss was as much as ∼44%. BTCA or CA crosslinking led to an increase in the degree of swelling of ∼1110% and ∼1580%, respectively. On the other hand, weight loss was decreased to a great extent by BTCA crosslinking (∼3% and ∼42% for BTCA or CA, respectively). Greater weight losses were due to PVA nanofibers not being fully crosslinked.
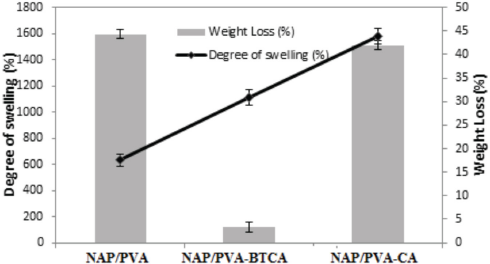
Swelling and weight loss of 10 h produced NAP/PVA, NAP/PVA-BTCA, and NAP/PVA-CA nanofibers.
When neat and NAP/PVA nanofiber mats were immersed in PBS, they immediately shrank and became almost transparent. The BTCA- or CA-crosslinked mats became bulky and stayed opaque. Fig. 9 shows the SEM images of the samples after immersion in PBS for 24 h and further drying. The nanofibrous structure of non-crosslinked PVA nanofibers was totally destroyed due to high solubility. The nanofibrous structure of the BTCA-crosslinked mat was preserved. However, the CA-crosslinked mat almost lost its fibrous structure, having a swollen and conjoint appearance. This was probably due to the highest swelling capacity of the NAP/PVA-CA nanofibers. The results showed that the electrospun mat retained its structure against PBS in terms of weight loss by the use of BTCA as a crosslinker.
SEM images of 10 h produced (a) neat PVA, (b) NAP/PVA, (c) NAP/PVA-BTCA, and (d) NAP/PVA-CA nanofibers after immersion in PBS for 24 h.
Drug Release from NAP-Loaded Electrospun PVA Nanofibers
The release characteristics of NAP from the NAP-loaded electrospun nanofibers are shown in Figs. 10 and 11 for 10 h and 20 h production period samples respectively. For the 10 h produced samples, NAP release from NAP/ PVA nanofibers showed a burst effect during 15-30 min due to high solubility of PVA, losing all of its drug content immediately. One of the factors controlling the release of a drug from a drug delivery system, especially a hydrogel carrier, is its swelling behavior. 6 As soon as the PVA matrix began to swell; NAP molecules were leached out from the matrix very rapidly. Another contributing factor was the dissolution of the PVA matrix within the release medium. This indicated that the mechanism for the burst release of NAP included the swelling and the partial dissolution of the PVA matrix.
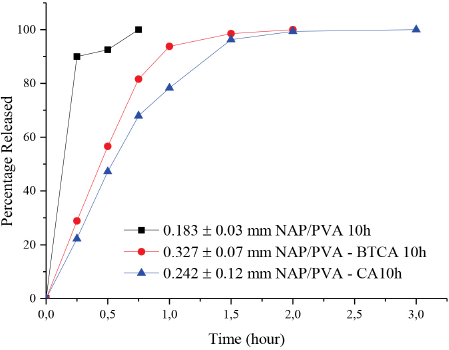
Percent NAP release from 10 h produced NAP/PVA, NAP/PVA-BTCA, and NAP/PVA-CA nanofibers.
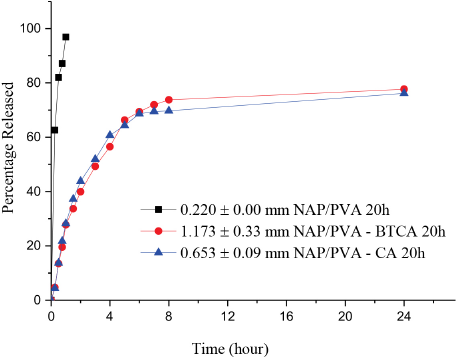
Percent NAP release from 20 h produced NAP/PVA, NAP/PVA-BTCA, and NAP/PVA-CA nanofibers.
Crosslinking enhanced the protection of mat structure against dissolution in PBS and slowed down the release of NAP from the drug-loaded nanofibers. The release of drugs from hydro-gels involves water absorption into the polymer matrix and release of the drug via diffusion. 29 BTCA- or CA-crosslinked PVA nanofibers gave lower drug release rates when compared to the non-crosslinked NAP/PVA mats. The total amount of the drug released from the NAP/PVA-BTCA and NAP/PVA-CA nanofibers were 93% and 78% respectively within 60 min whereas non-crosslinked NAP/PVA nanofibers released all of its drug content within 45 min. Crosslinking did not decrease the total released drug amount.
NAP/PVA, NAP/PVA-BTCA, and NAP/PVA-CA nanofibers were produced for 20 h to give thicker mats and to see whether it is possible to extend the release time by increasing the diffusion path. 40 Neat PVA solution had lower conductivity values when compared to the BTCA- or CA-added solutions and NAP/PVA nanofibers were deposited on a larger area than the crosslinked nanofibers. Thus, a longer production period did not increase the thickness of the NAP/PVA nanofiber mat (0.220 ± 0.004 mm). When BTCA or CA was added to the spinning solutions, conductivity of the solutions increased and the nanofiber deposition area became smaller than that for the non-crosslinked NAP/ PVA nanofibers for both 10 h and 20 h collected samples. NAP/PVA nanofibers released 81% of NAP content in 30 min, and NAP release reached to 97% after 60 min. Since NAP did not dissolve in the PVA solutions, the polymer jet broke down occasionally during the electrospinning process, leading to lower production of the thicker PVA mats. Especially for CA-added nanofibers, productivity was very low and the resulting mat thickness was thinner than that for BTCA-added mats (BTCA, 1.17 ± 0.33 mm; CA, 0.653 ± 0.09 mm). Despite this, the CA- crosslinked nanofibers showed similar drug release values to the BTCA-crosslinked nanofibers. NAP/PVA-BTCA and NAP/ PVA-CA nanofibers released 50% of the NAP content in ∼3 h and released 74% and 70% of NAP content, respectively, after 8 h. NAP release reached 77% for NAP/PVA-BTCA nanofibers and 76% for NAP/PVA-CA nanofibers after 24 h (Fig. 11). Increase in the mat thicknesses slowed down NAP release, however, it was unable to release all its drug content. This was possibly due to the compact structure of the thicker nanofibers, retaining the rest of the unreleased drug in the nanofibers.
Conclusions
Electrospun non-crosslinked and BTCA- or CA-crosslinked PVA nanofibers containing NAP were produced. The resulting nanofibers were characterized by FTIR, TGA, DSC, and X-Ray analysis. FTIR spectra of PVA nanofibers confirmed the ester link formation between PVA and BTCA or CA attributed to crosslinking. DSC thermograms showed that by introducing BTCA or CA into the PVA polymer, Tg and Tm values changed due to the crosslinking density. The TGA results also confirmed that the increase in thermal stability was a direct consequence of crosslinking with BTCA or CA, and when they were compared, BTCA crosslinking was more effective than CA crosslinking. Due to the greater number of BTCA functional groups, its degree of cross-linking was greater than that for CA. 41 The XRD patterns of BTCA- and CA-crosslinked nanofibers showed a wide peak around the diffraction angle of 2θ, 19-20, due to the crosslinked structure. It can be seen from the SEM images that NAP/PVA-BTCA and NAP/PVA-CA nanofibers were successfully electrospun. No NAP crystals were found either on the surface of the fibers or outside the fibers.
The effect of BTCA and CA crosslinking were also investigated in terms of fiber diameters, mat thicknesses, swelling, weight loss, and NAP release characteristics. The weight loss and swelling of the PVA mats could be significantly decreased by crosslinking with polycarboxylic acids, even at a fixation temperature of 110 °C. BTCA crosslinking was more advantageous to the preservation of the nanofibrous structure and weight. On the other hand, CA-crosslinked PVA nanofibers showed greater swelling and a lower NAP release rate. Increased mats thicknesses also slowed down NAP release due to the increased diffusion path.