
Abstract
The absorption spectrum of Sudan Red III (SR) in aqueous solution and a series of aqueous alcohol solutions containing sodium dodecyl sulfate (SDS) surfactant was determined by UV-Vis spectrophotometry. After establishing appropriate association models to analyze the experimental data, the association constants Km of SR and SDS in various solutions were determined. All association constants in aqueous alcohol solutions were greater than those in water. The aqueous ethanol solution had the largest association constant, indicating that addition of a small amount of alcohol enhanced the association between SR and SDS. Association thermodynamics function ΔrGm values were also calculated from the association constants.
Introduction
Surfactants are widely used in household and industrial cleaners, cosmetics, research laboratories, and as plasticizers in cement and concrete chemistry. One of the most important properties of aqueous surfactant solutions is their ability to solubilize a wide variety of organic compounds,1,2 such as organic dyes.3,4 This solubilization can be explained by the specific interactions between surfactant molecules and organic compounds viz. by coulombic, hydrophobic, and charge transfer forces. Since surfactant and dye interaction research has great significance for textile dyeing5,6 and other areas,7–12 it was studied extensively over the last three decades.13–22
Various surfactant-dye systems have been studied. Oakes et al.23,24 studied the solubilization of dyes by surfactant micelles. Hao et al. 25 and Chen et al. 26 investigated the interactions between crystal violet and sodium bis(2-ethylhexyl)sulfosuccinate (AOT) in aqueous solutions and in AOT/isooctane/ water microemulsions. Wang et al. 27 studied the interaction of the anionic dye Phenol Red with the cationic surfactant cetyl trimethylammonium bromide (CTAB) in aqueous solution and its influence on the formation of CTAB micelles. Barry et al. 28 and Hung et al. 29 found that binding of curcumin with phospholipid micelles significantly altered the microstructural properties of micelles. Tehranibagha et al. 30 and Su et al. 31 investigated the interaction between quaternary ammonium Gemini surfactants and azo dyes Congo Red, Methyl Orange, and Disperse Blue 56. They found that the formation of dye-surfactant ion-pair complex in the mixed solution resulted in a change in dye maximum absorption wavelength and absorption intensity. Samiey et al. 32 showed that the binding of Malachite Green monovalent cation (MG+) to Triton X-100 was exothermic, however binding of MG+ to dodecyl trimethylammonium bromide (DTAB) and sodium dodecyl sulfate (SDS) in some concentration ranges of the surfactants was endothermic and in others, was exothermic.
Research showed that surfactant interactions with dyes in solutions depended on dye structures, chemical characteristics of the dye, and surfactant used.33–39 Solvent effects on these interactions may be very large. Alcohols, as co-solvents, can change the rate of organic, inorganic, and enzymatic reactions.40,41 Samiey et al. 42 found that the observed association rate constant increased in water–ethanol–ethylene glycol ternary mixtures due to hydrogen bonding and hydrophobic interaction between MG+ and alcohol molecules.
Sudan Red III (SR) is a synthetic red dye with an azo structure (Fig. 1). As a lipophilic compound,43,44 it is soluble in fats, oils, acetone, and benzene, but insoluble in water. SR has strong characteristic absorption peaks in the visible region,45,46 so it is often used in kinetics studies.
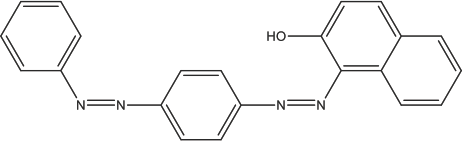
Molecular structure of Sudan Red III (SR).
Some azo dyes have potential carcinogenic effects. Various azo dyes, including SR, have been listed as carcinogenic substances by the International Agency for Research on Cancer (IARC), and banned as pigment additives. Although many nations prohibited these azo dyes, a considerable amount of azo dyes were used in production of cloth dyed by illegal vendors. In April 2003, a French agency discovered substantial amounts of this dye present in dried and crushed or ground chili pepper imported from some Eastern countries. Some food production enterprises use it as a food coloring to improve the food color and luster, and to reduce the cost. The problem of illegally adding SR in food has gained more and more attention in recent years. There is a need for quick and easy ways to determine small quantities of SR in aqueous solutions,47,48 as the lack of specificity of existing methods could lead to the misidentification of the analyte. Therefore, the study of dye-surfactant interactions in complex systems has value in improving dye detection.49–51
By measuring the absorption spectra of SR in water and aqueous alcohol solutions at room temperature (RT), we found that the association interaction between SR and SDS led to the solubilization of SR in aqueous solutions of SDS. We established the association models and investigated the association constants between SR and SDS by measuring the absorbance of SR in these different solutions. The effect of alcohol on the association between SR and SDS in aqueous alcohol solutions was further studied. These research results may lead to an effective method to detect and remove SR.
Experimental
Materials and Apparatus
SR dye and SDS surfactant were both purchased from Shanghai Zhongqin Chemical Reagent Corp. Methanol (AR grade), ethanol (AR grade) and n-propanol (AR grade) were supplied by Tianjin Kaitong Chemical Reagent Corp., Tianjin Northern Tianyi Chemical Corp., and Shanghai Jianxin Chemical Corp., respectively. Doubly distilled water, with conductivity less of than 1.8 × 10⁻⁷ S/m was used throughout the study. The UV–Visible absorption spectra for dye solutions and samples were measured on a LabTech UV–2100 UV–Visible (UV–Vis) spectrophotometer.
Absorbance Measurements of SR in SDS Aqueous Solution
Because the solubility of SR in SDS aqueous solution is low, a series of reaction media containing 2.3 × 10⁻⁶ M of SR and SDS at 2.0 × 10⁻², 4.0 × 10⁻², 6.0 × 10⁻², 8.0 × 10⁻², and 1.0 × 10⁻¹ M concentrations were prepared. The absorbance of each sample in optical cuvettes (1–cm path length) were measured using UV-Vis spectrophotometry at RT (25 °C) at 510 nm wavelength.
Absorbance Measurements of SR in SDS Alcohol-Aqueous Solutions
Methanol, ethanol, and n-propanol stock solutions of SR (2.0 × 10⁻⁴ M) were prepared, using an ultrasonic device to aid in dissolution. Various amounts of SDS were weighed and 0.5 mL of each stock solution was separately pipetted into a volumetric flask, and then diluted with water up to 25 mL to obtain a series of reaction media containing SR (4.0 × 10⁻⁶ M) and SDS at the five concentrations mentioned in the previous section. The concentration of alcohol in these solutions was 20 mL/L. To reduce the experimental error, the same volumetric flask was used and samples were mixed using the same procedure. The absorbance of each sample was measured using the UV-Vis spectrophotometer as described in the previous section.
Results and Discussion
Absorption Spectrum of SR in SDS Aqueous Solution
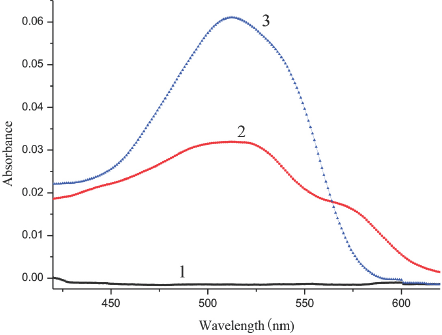
Although Sudan Red III is insoluble in water, the color of the solution changed after addition of SDS. To verify this change, we measured the spectra of SDS in water (curve 1), SR in water (curve 2), and the SR in SDS aqueous solution (curve 3) as shown in Fig. 2. The absorbance of SR in water was approximately zero (curve 2). When SDS was added to the solution, the absorption intensity changed remarkably, with the spectrum of SR in the SDS aqueous solution (curve 3) having a strong absorption peak at 510 nm. The difference between curves 2 and 3 can be considered as evidence of the association between SR and SDS.
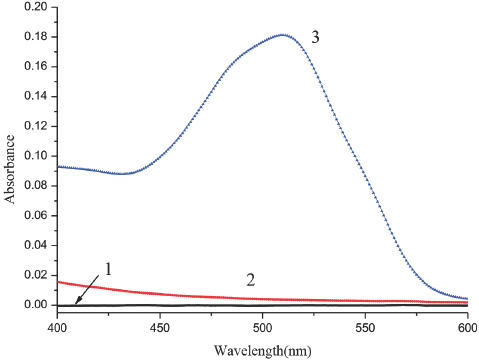
Absorption spectrum of SR association with SDS in aqueous solution. 1. SDS in water, 2. SR in water, 3. SR in SDS aqueous solution. SR concentrations were 1.14 × 10⁻⁵ M.
Absorption Spectrum of SR in SDS Aqueous Alcohol Solutions
Using methanol as a reference, we measured the spectra of SR in the SDS aqueous methanol solution (Fig. 3). The spectrum of SR in the aqueous methanol solution without SDS (curve 2) had a strong absorption peak at 490 nm. When SDS was added to the SR solution (curve 3), the color and the spectrum of the solution changed remarkably. Outside of the regions where curve 3 exceeded the absorbance values of curve 2 (peaking at 510 nm in curve 3), the sum of the absorbances for each point on curves 1 and 2 was approximately equal to the absorbance of each corresponding point on curve 3. We further measured the absorption spectrum of SR in the SDS aqueous ethanol solution (Fig. 4) and its absorption in the SDS aqueous n-propanol solution (Fig. 5). Similar changes were observed for the curves in all three figures (Figs. 2–5). The differences between curves 1, 2, and 3 in each figure can be considered as evidence for the association interaction between SR and SDS.
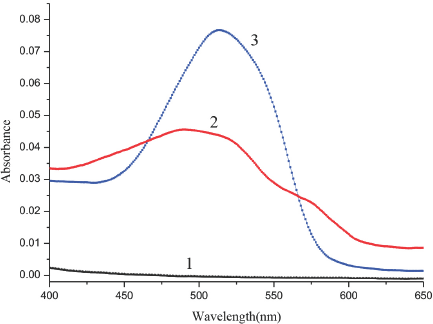
Absorption spectrum of SR association with SDS in aqueous methanol solution. 1. SDS in aqueous methanol solution, 2. SR in aqueous methanol solution, 3. SR in SDS aqueous methanol solution. SR concentrations were 4.0 x 10⁻⁶M.
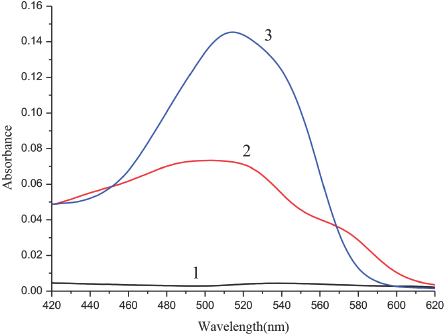
Absorption spectrum of SR association with SDS in aqueous ethanol solution. 1. SDS in aqueous ethanol solution, 2. SR in aqueous ethanol solution, 3. SR in SDS aqueous ethanol solution. SR concentrations were 4.0 x 10⁻⁶ M.
Absorption spectrum of SR association with SDS in aqueous n-propanol solution. 1. SDS in aqueous n-propanol solution, 2. SR in aqueous n-propanol solution, 3. SR in SDS aqueous n-propanol solution. SR concentrations were 4.0 x 10⁻⁶ M.
Association Constant Km between SR and SDS
Assuming formation of a 1:1 complex between SR and SDS in aqueous solutions, the association constant Km may be expressed as Eq. 1.
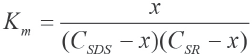
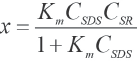
CSDS and CSR are the initial concentrations of SDS and SR respectively and x is the concentration of the complex. When x is small, the experimental data may be analyzed through the Rose-Drago equation (Eq. 2).52,53
According to Beer's law, the absorbance of a sample with a 1-cm path length is expressed as Eq. 3.

A corresponds to the absorbance of the solution, εSDS, εSR, and εc are molar absorptivities of SDS, SR, and the complex, respectively. Combination of Eqs. 2 and 3 yields Eq. 4.
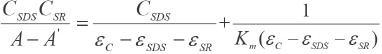
The equilibrium constant Km and (εc -εSDS - εSR) can then be calculated from the slope and the intercept.
Association Constant Km between SR and SDS in Aqueous Solution
SR/SDS/water solutions (5) with a CSR of 2.3 × 10⁻⁶ M and a CSDS varying from 2.0 × 10⁻² M to 1.0 × 10⁻¹ M were pre- pared. The absorbance of each sample was measured at 25 °C and a wavelength of 510 nm using distilled water as a reference. It took about 2 h to reach the equilibrium of the association reaction before measurements were taken. The value of εSDS and εSR were measured and found to be negligible. Fig. 6 shows a plot of
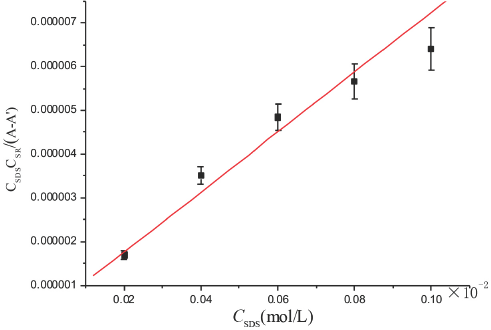
Plot of
Association Constant Km between SR and SDS in Alcohol-Aqueous Solutions
Five SR/SDS/methanol/water solutions with the same Cmethanol, with CSR being 4.0 × 10⁻⁶ M and CSDS varying from 2.0 × 10⁻² M to 1.0 × 10⁻¹ M were prepared. The absorbance of each sample was measured at 25 °C and 518 nm wavelength using the aqueous methanol solution as a reference. It took about 2 h to reach the equilibrium of the association interaction before measurements were taken. The value of εSR is essential for calculation of Km, therefore a series of SR aqueous methanol solutions at various concentrations were measured at 25 °C at 518 nm wavelength. A plot of absorbance vs the concentration of SR gave a straight line passing through the origin, as shown in Fig. 7a. The value of εSR was obtained from the slope of the straight line, which was (1.027 ± 0.002) × 104 L/mol•cm. The value of εSDS was measured and found to be negligible. The adsorption of a little SR on the wall of flask decreased the effective concentration of SR in the solution and affected the precision in determinations of εSR1, (εC1 - εSDS - εSR1), and εC1. However, when all the samples were prepared with the same procedure, this error became systematic and did not affect the precision in calculation of equilibrium constant Km1. Fig. 8a shows a plot of
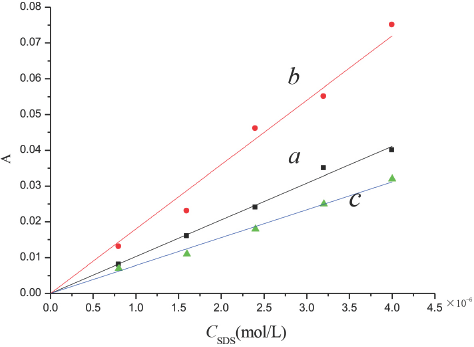
The absorbance of SR in SDS aqueous alcohol solutions. a. aqueous methanol solution, b. aqueous ethanol solution, c. aqueous n-propanol solution.
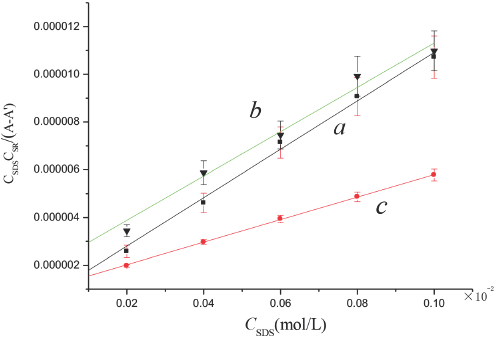
Plot of
SR in the SDS aqueous ethanol solution and aqueous n-propanol solution were prepared by the same procedure, and the absorbance was measured. Figs. 7b and 7c show the values of the molar absorption coefficient were ε
SR2
= (1.8 ± 0.002) × 104 L/mol-cm and ε
SR3
= (0.78 ± 0.002) × 104 L/mol-cm. Fig. 8 shows plots of
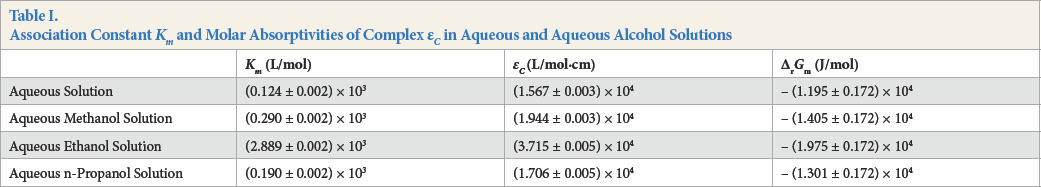
All of the values of the equilibrium constant and molar absorptivities are listed in Table I, columns 2 and 3, Km is the association constant and εc are the molar absorptivities of the complex. From Table I, we can find that all these association constants and molar absorptivities in aqueous alcohol solutions were greater than in aqueous solution, which indicated that adding a small amount of alcohol enhanced the association interaction between SR and SDS.
Association Constant Km and Molar Absorptivities of Complex εc in Aqueous and Aqueous Alcohol Solutions
Thermodynamic Parameters Δr Gm of Association between SR and SDS
μ SR , μ SDS , and μ c are the chemical potentials of SR, SDS and the association complex in solutions, respectively, and can be expressed as the following equations (Eqs. 5–7).
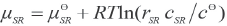

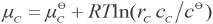
cSR, cSDS, and cc are the concentrations of SR, SDS, and the association complex, respectively, γ is the activity coefficient and meet

Where
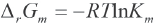
With Eq. 9, the obtained Km can be used to calculate Δr Gm.
All values of Δr Gm are listed in Table I, column 4.
Conclusions
In this research, the absorption spectrum of SR in aqueous solution and a series of aqueous alcohol solutions with the surfactant SDS has been determined at RT. By measuring the absorbance of SR in various solutions and using the appropriate association models to analyze the experimental data, we obtained the association constants and the Gibbs free energies of SR and SDS. By analyzing these results, we found that the association between SR and SDS can be promoted by adding a small amount of alcohol. Among them, the influence of ethanol is the most obvious and the association constant of SR in the SDS ethanol-aqueous solution is at its maximum. The associated effect of anionic surfactants can be explained by hydrogen bonding and hydrophobic interactions between the surfactant and SR. Since the dissolution of SR in aqueous solution is obviously enhanced by small concentrations of the anionic surfactant SDS, this can be used for SR detection and removal.
Footnotes
Acknowledgements
This work was supported by the Innovation Fund of Small and Medium-sized Enterprises of Gansu province (Grant No. 1407GCCA013), the Lanzhou Municipal Science and Technology Bureau Program (Grant No. 2015-4-137), and Qing Lan Talent Engineering Funds of Lanzhou Jiaotong University.