
Abstract
An experimental model using only bijective functions was designed to describe the dye degradation of three dyes: C.I. Reactive Blue 19, C.I. Reactive Black 5, and C.I. Reactive Red 120. The experimental model was compared to a theoretical predictive exponential decay model based on the principles of Fick's first law of diffusion. The models agreed within a range of 3 to 35% for the Reactive Blue 19 experiments, 1 to 9% for the Reactive Black 5 experiments, and 1 to 15% for the Reactive Red 120 experiments, with tighter fits at higher rates and concentrations. A 25% increase in the volume of solvent used only decreased the residence times of the reaction by 0.9%, 0.6%, and 5.3%, respectively.
Introduction
Textile dye wastewater contains a complex mixture of components with high concentrations of organic and chro-mophoric substances. Furthermore, dye wastewater typically contains high salt loads; it is common for industrial-scale dye wastewater to have high biological and chemical oxygen demands (BOD and COD), which left untreated, causes severe aquatic environmental damage.
Treatment options for different types of dye wastewater vary greatly. The processes involved encompass physicochemical treatments, such as membrane separation or chemical (Fenton) oxidation, as well as biological treatments, such as using aerobic bacteria or activated sludge. 1 The textile industry uses a variety of methods to treat dye wastewater, as discussed, with selected case studies by Wang et al. 1 The in situ breakdown of a variety of dye types, including anthra-quinone, azo, and azine type dyes (shown in the Appendix), using photo-electro catalytic oxidation (PECO), is an important advancement in dye wastewater treatment as these reactive dyes make up greater than 65% of the dyes presently used and are non-biodegradable. 2 According to Sala, industrial pilot plants using photoelectrochemical treatments predict energy usage of up to 5.7 kWh/m3 to achieve 90% discoloration. 2 Zanoni et al. have reported that the PECO degradation of C.I. Reactive Orange 16 resulted in a first-order reaction up to 0.0309 g/L in dye concentration, with the addition of 1.0 M of NaCl; they also studied the effects of pH on degradation rate. 3 As an extension to the research conducted by Zanoni et al, Carneiro et al. also conducted kinetic studies on Reactive Orange 16 at pH < 5 and pH > 10 using different salts. 4 Compared to the research focus of both Zanoni et al. and Carneiro et al, the focus of this paper is on kinetic modeling of dye degradation in a continuous flow tubular reactor without salt addition.
The PECO method of organic degradation is a novel method of reducing pollution. The treated wastewater can be reused as feed water, therefore, PECO processes conserve water and eliminates the need for chemical treatment reagents. Wang et al. have extensively characterized the properties and degradation capabilities of graphene-titania composite film electrodes for the X-3B dye. 5 However, their analysis does not encompass the catalyst's efficacy for degradation over a range of complex reactive dyes, which this paper attempts to do.
The focus of this research was to design an experimental model for the complete degradation of various dissolved dyes in water using PECO. The model would relate the changes in electrical current against the remaining number of moles of the principal (degrading) dye. The end products were determined through nuclear magnetic resonance (NMR) spectroscopy, and the remainder of chromophoric substances determined through absorption spectrophotometry. The experimental model was compared with a theoretical predictive model derived from principles of Fick's first law of diffusion.
Theoretical Considerations
Theoretical Modeling
The PECO process is well understood and documented. Konstantinou and Albanis have explained the subject matter, both kinetically and mechanistically, in their research with regards to the degradation of a variety of dyes containing various functional groups. As a crude summary, the complete pathway yields, for any of the studied dyes, water, carbon dioxide, and salts. 6 The PECO process is largely a radical reaction, whose initiation-termination steps can be seen in Fig. 1. 6
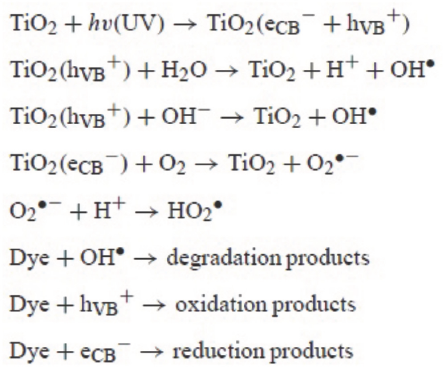
Radical formation, propagation, and termination degradation pathway.
The penultimate step to the neutral products yielded are simple aliphatic chains and carboxylic acids, 6 which, owing to their low molecular weight, are difficult to detect using any modern methods, including gas chromatography (GC), liquid chromatography (LC), mass spectrometry (MS), and NMR spectroscopy.
It was discovered from earlier experimental trials that neither electrochemical or photochemical processes were able to degrade any dye for concentrations greater than 0.6 g dye/L of solvent.
The flow in the tubular flow reactor is laminar. It was assumed that the reaction only took place on the catalyst surface. Furthermore, it was assumed that the rate of reaction on the outer surface of the catalyst was negligible compared to the rate of reaction on the inner surface (bulb side). It was also assumed that the rate of dye conversion on the inner surface of the catalyst was much more significant than the rate of conversion caused by un-catalyzed radical mechanisms.
The rate of reaction is given in Eq. 1.

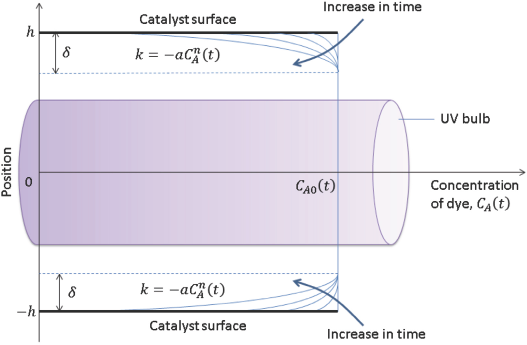
Reaction and diffusion occurring within a thin film of width.
Since a diffusion limited model was proposed, the governing principle for mass transfer between the catalyst surface and the thin-film is Fick's law of diffusion, given by Eq. 2.
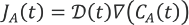
From Fick's first law of diffusion, it was postulated that, since the mass flux decreases with time and dye concentration, the theoretically predicted rate of reaction would follow an exponentially decaying profile of the form given in Eq. 3

Once the values of the variables in Eq. 3 have been obtained, the predicted concentration,
Experimental Modelling
Since the dynamic concentration of the principal (degrading) dye cannot be measured, an experimental model describing the changes in concentration of the principal dye is necessary. The Beer-Lambert law cannot be applied to correctly ascertain the principal dye concentration due to the absorbance values of its fragments. The measured current is
It was proposed that since
From the experimental data, Eqs. 4 and 5 were derived.

where
The concentrations obtained from the experimental model
Materials and Procedure
The dyes tested using the PECO dye degradation process were C.I. Reactive Blue 19 (∼50% pure), C.I. Reactive Black 5 (∼55% pure), and C.I. Reactive Red 120 (∼50-70% pure).
The reactor was a 1-L capacity cylindrical polyurethane tube with electrodes, fitted with a hollow shell TiO2 catalyst and a 36 W elongated UV light bulb within a protective hard shell clear glass sleeve (Fig. 3).
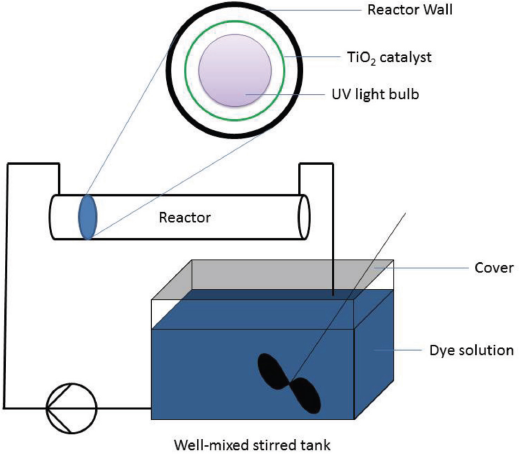
Reactor design.
The feed source to the reactor was an 8-L capacity vented tank fitted with a 26 W centrifugal pump, connected by a 0.5 in. ID polyethylene tube. The recycle stream connected the outlet of the reactor to the tank, also by a 0.5 in. ID polyethylene tube. The apparatus is capable of sustaining plug flow conditions; however, the experiment was conducted under laminar flow conditions, which are typical for industrial processes. All the equipment used for the experiments were purchased from Aquamost.
A Unicam UV-Vis UV-1 spectrophotometer was used to analyze the absorbance spectra of the dye at different time intervals. The spectrophotometer used had an accuracy of 0.1 ppm for organic compounds such as dyes, with a wavelength accuracy of 1 nm.
All experiments used 0.3 g of dye (known as the principal dye) at a voltage setting of 7.00 V. Experiments were conducted with 6 L or 8 L of deionized water. Changes in current were monitored and recorded as the experiment progressed. Between three to five 15-mL samples of dye solution were taken at intervals throughout the experiment, without replacement, for analysis by absorption spectrophotometry. The final sample was taken for NMR analysis. For NMR analysis, 10 mL of dye solution was extracted with 5 mL of chloroform-
All reactions were run continuously until the dye solution was completely decolorized, however the end point of each experiment was only an estimate since the apparatus could not be monitored at all times.
Results and Discussion
For all dyes, NMR analysis of the final samples did not show peaks of organic material other than that of the solvent (chloroform-
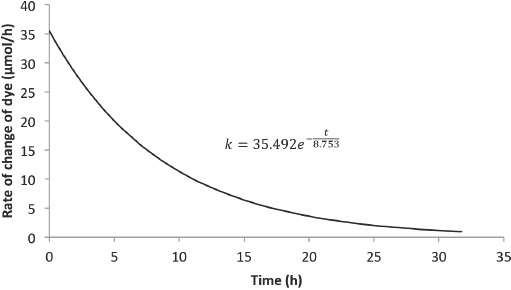
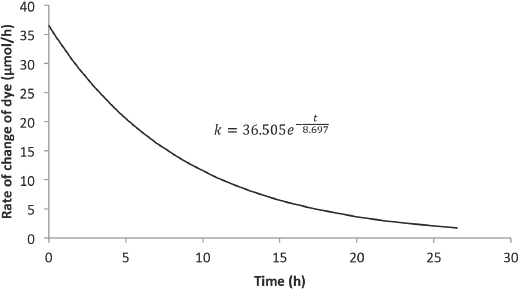
Figs. 4 and 5 show the predicted rate of concentration change with time for 6 L and 8 L of Reactive Blue 19 dye solution, respectively. The change in the solvent volume was necessary to change the opacity of the dye solutions within the reactor. Uncertainties pertaining to the change in opacity were taken into consideration by the model. The unknowns
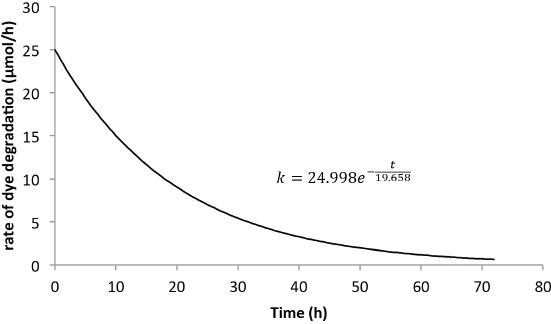
Predicted rate model for Blue 19 (6-L solution).
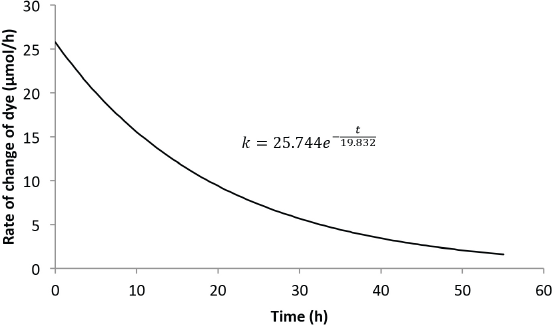
Predicted rate model for Blue 19 (8-L solution).
The integrated area at some chosen
The total integrated area must be equal to the initial dye concentration.
Figs. 4 and 5 show clearly that the rate of dye degradation was not completely zero at the measured end of the reaction, which agrees with theoretical predictions that a zero rate can only be achieved after an infinite time has passed. Integrating from 0 <
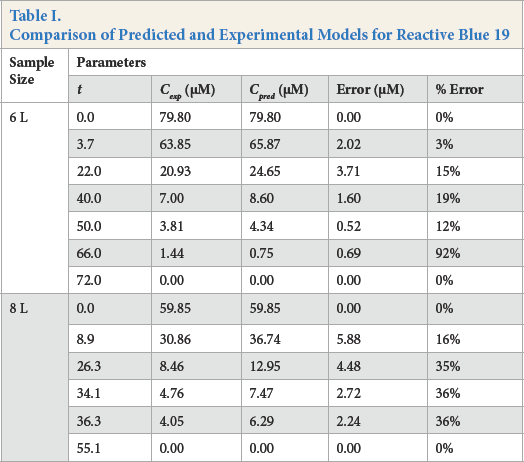
Comparison of Predicted and Experimental Models for Reactive Blue 19
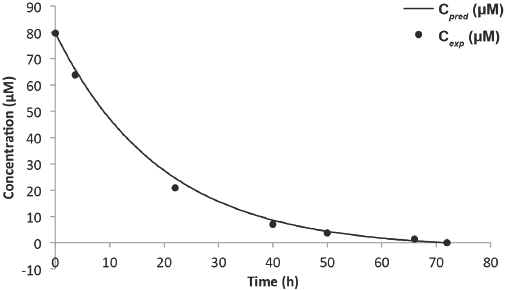
Predicted vs experimental concentration model for Blue 19 (6-L solution).
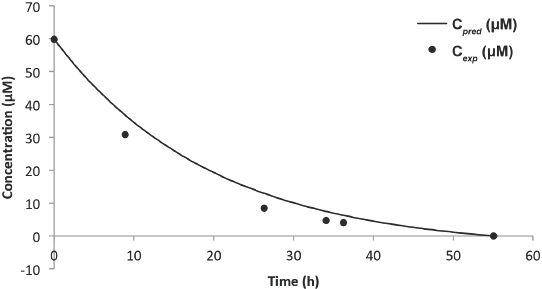
Predicted vs experimental concentration model for Blue 19 (8-L solution).
From Table I, it can be seen that as the reaction progressed, the errors became larger. The increase in the magnitude of errors can be attributed to inhibitive competition for active catalyst sites by the principal dye fragments. With exception of the 92% error from the 6-L experiment, the range of error from the 8-L experiment (16–36%) was much larger than the 6-L experiment (3–19%). One plausible reason was application of the Beer-Lambert law to the 8-L experiment at
For both experiments, modeling for low rates (hence concentration) gave inaccuracies, as seen by the 92% error in the 6-L experiment and the 36% error in the 8-L experiment. These large errors were attributed to the lack of equipment sensitivity. Although these errors many seem alarming, they were clearly insignificant, since the associated concentrations were within the range of 1 μM.
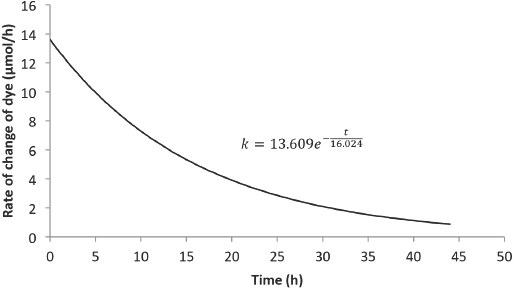
Figs. 8 and 9 show the predicted rate of change of concentration with time for 6 L and 8 L of Black 5 dye solution, respectively. Compared with the rate from the Blue 19 experiments, the initial rate of dye degradation for the Black 5 experiments were ∼42% greater. Also, the residence times for the Black 5 experiments were 56% less than the residence times for the Blue 19 experiments.
Predicted rate model for Black 5 (6-L solution).
Predicted rate model for Black 5 (8-L solution).
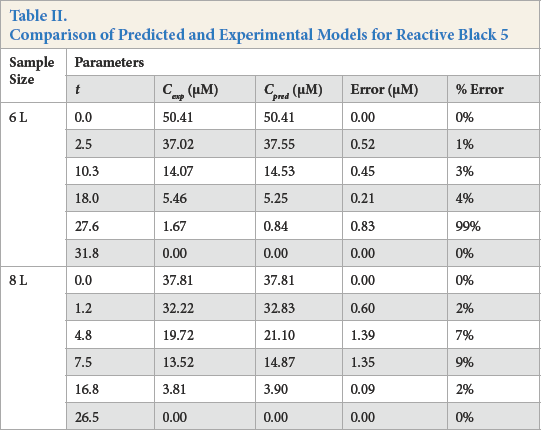
Figs. 10 and 11, and Table II compare the predictive and experimental models. Unlike the Blue dye experiments, the predicted model fitted the experimental model much better, with errors ranging between 4% to 9%, disregarding the obvious outlier of 99% in the 6-L experiment (Table II). From the results, it appears that the predictive model was highly dependent on the concentration obtained from the Beer-Lambert correlation at some initial time
Comparison of Predicted and Experimental Models for Reactive Black 5
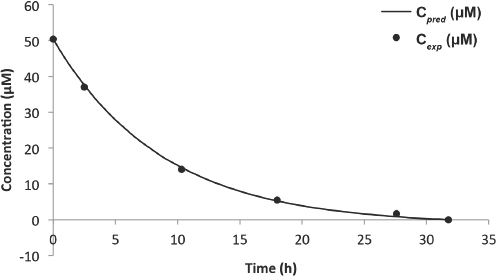
Predicted vs experimental concentration model for Black 5 (6-L solution).
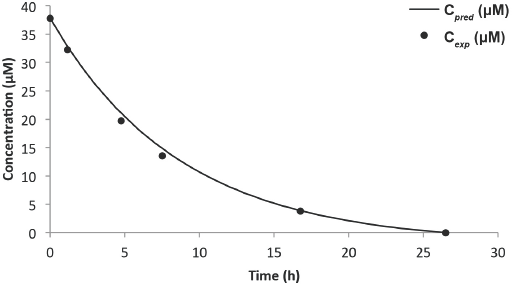
Predicted vs experimental concentration model for Black 5 (8-L solution).
Figs. 12 and 13 show the predicted rate of concentration change with time for 6 L and 8 L of Reactive Red 120 dye solution, respectively. Compared with rates from the Blue 19 experiments, the initial rate of dye degradation for the Red 120 experiments were approximately 46% less. Also, the residence times for the Red 120 experiments were 18% less than the residence times for the Blue 19 experiments.
Predicted rate model for Red 120 (6-L solution).
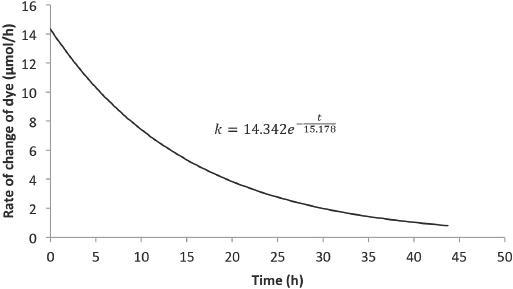
Predicted rate model for Red 120 (8-L solution).
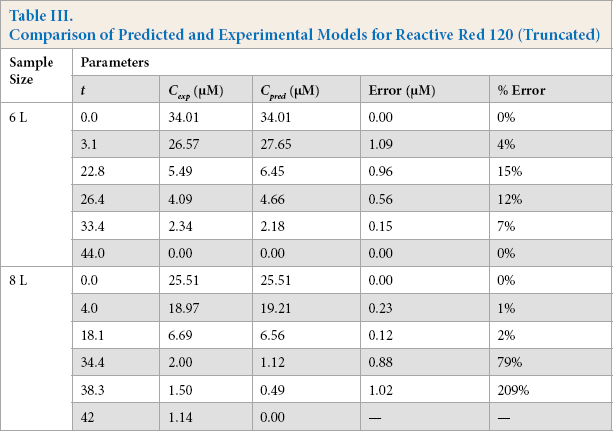
Figs. 14 and 15, and Table III compare the predictive and experimental models. Analysis of the Red 120 degradation was similar to that of Black 5; however, the predictive model for the 8-L experiment underestimated the end time for the reaction by 65 min. It was noted that the efficacy of the catalyst slowly dwindled (as observed from the drop of initial current) as more experiments were performed, which may be a factor in the prediction accuracy. From the results, it is clear that the predictive model was highly dependent on the concentration obtained from the Beer-Lambert correlation at some initial time
Comparison of Predicted and Experimental Models for Reactive Red 120 (Truncated)
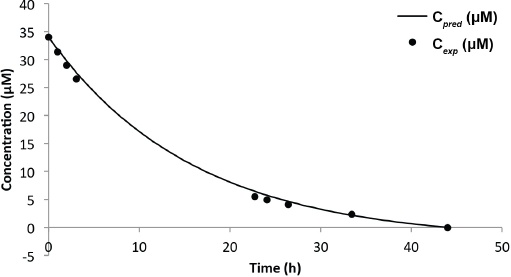
Predicted vs experimental concentration model for Red 120 (6-L solution).
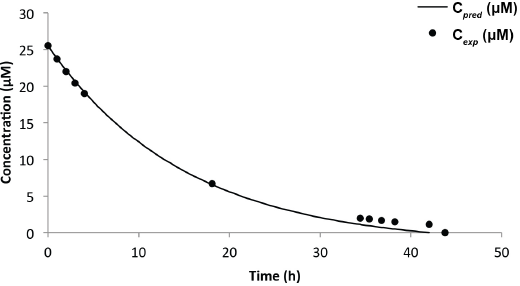
Predicted vs experimental concentration model for Red 120 (8-L solution).
For all three dye experiments, it was clear that for a fixed amount of dye used (0.3 g), the changes in concentration (hence opacity) had little effect on the residence times, with changes of 0.9%, 0.6%, and 5.3% for Blue 19, Black 5, and Red 120 dyes, respectively. It is certain that for 0.3 g of dye, in any reasonable concentration that allows for penetration of the UV light to the catalyst surface, that the predictive model could describe the time for complete degradation.
The model inherently accounted for the ever-changing conditions of the catalyst, which directly affected the current in the reactor, thus the absorbance within the Beer-Lambert region and, therefore, the prediction.
While it may seem disconcerting that the associated percent errors were large at lower concentrations, these errors did not reflect the inaccuracy of the theoretical model. The errors stemmed from a small sample size, which prevented finer measurements due to lack of equipment sensitivity. The small errors associated with the 6-L Red 120 dye experiment were purely coincidental. Regardless, the kinetics of the reaction were indeed between first- and second-order, as observed by the shape of the concentration plot (and also in contrast to Sala et al.) 2 Furthermore, since the models are smooth, bijective functions, it is proposed that scaling the model processes to larger concentrations can be easily done.
Currently, the design of the reactor severely limits operability past 0.1 g dye/L of water due to the lack of UV intensity on the catalyst face. Hence, the current reactor does not suggest industrial viability. However, the PECO process itself is industrially viable if a high-efficiency reactor can be made. Future efforts should involve a “Plate-and-Frame” type of reactor with alternating catalyst and UV emitting frames rather than the current “Shell-and-Tube” flow reactor.
Conclusions and Recommendations
The predictive model used in this study agreed closely with the experimental model for the Reactive Black 5 experiments. A comparison between the Blue 19 experiments with the Black 5 experiments indicated that it was incumbent to obtain an initial sample within a short time from the start of reaction to obtain an accurate predictive model. To ensure repeatability of results, more trials should be run. New trials varying the amount of dye used should be done to establish a basis for possible reactor scale up. Trials with different dyes with same molar amounts should also be done to identify similarities between rate constants and residence times.
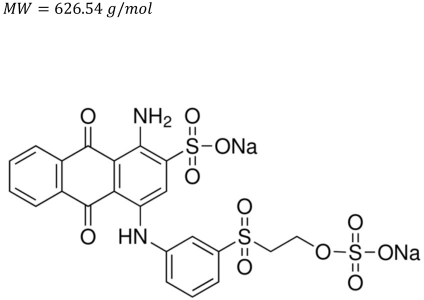
Reactive Blue 19.
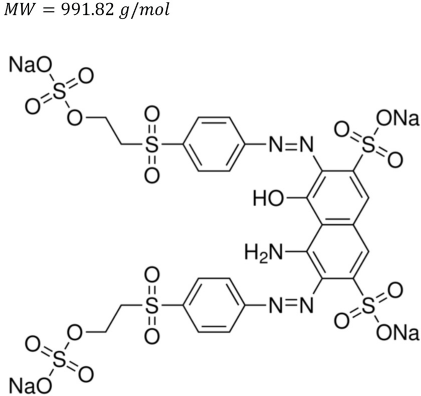
Reactive Black 5.
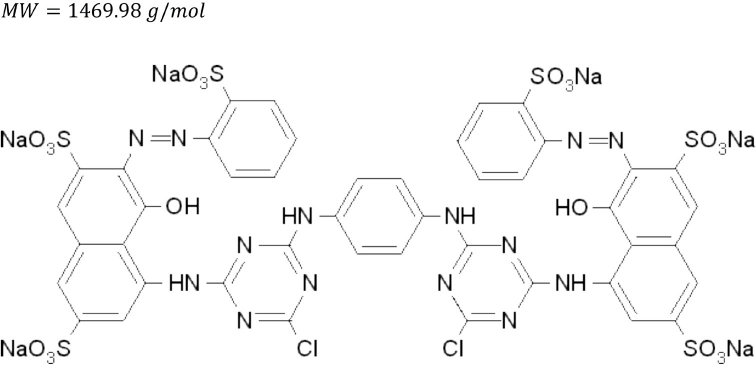
Reactive Red 120.
Footnotes
Acknowledgements
The authors would like to thank Rob McClain of the University of Wisconsin-Madison Chemistry department for allowing the use of his laboratory equipment and sincere guidance. The authors would also like to acknowledge Ashutosh Kumar of the University of Wisconsin-Madison Mathematics department for answering numerous random questions on mathematics. Last, but not least, the authors would like to extend our sincerest gratitude to Aquamost, in particular Terry and Tom Barry, for providing all the necessary equipment and the provision of spare parts. Without the help of these wonderful individuals, this paper would not have been possible.