
Abstract
Carboxymethylated cotton might provide an eco-friendly novel approach to impart different functions to fabric by crosslinking or self-assembly deposition of nanolayers. The anionic content of carboxymethylated cotton was determined by acid-base titration. Two interrelated methods of surface electrochemistry for anionic cotton fabrics were investigated in this paper. Measurement of surface charge on carboxymethylated cotton was achieved by characterizing the zeta potential of the anionized fibers via streaming current (SC) and fiber-pad streaming potential (SP) measurements, which showed only a small percentage of total charges contributed to the surface charge. SC and SP methods were proven to be useful in studying the surface charge of ionic cellulose.
Introduction
Negatively-charged cellulose can be made via various routes, such as treatment with chloroacetic acid, chlorosulfonic acid, or sodium 4-(4,6-dichloro-1,3,5-triazinylamino)-benzenesulfonate.1,2 The product of the carboxymethylation of cotton cellulose is carboxymethylcellulose (CMC), or anionic cellulose. 3 It is also termed as cellulose glycolate and cellulose glycolic acid, which is formed by the treatment of cellulose with chloroacetic acid and sodium hydroxide.
Different degrees of substitution depend on different steps of treatment. 3 Substitution is predominantly at the 6-0 position on the cellulose molecules, followed by 2-0, 2,6-di-O, 3-0, 2,3-di-O, and 2,3,6-tri-O positions. The reaction proceeds unevenly with areas of high and low substitution. 4
Anionic cotton is formed from the carboxymethylation reaction throughout the cotton fiber cross section. 5 Previous studies proved cotton fiber carboxymethylation proceeds initially at accessible hydroxyl groups, and subsequently, with slow penetration into the ordered regions. Carboxymethylation proceeds very easily in amorphous regions, as compared to crystalline regions. The distribution of the carboxymethyl groups is very uneven at the early stages of the reaction. 5 With increased reaction time, the reactants penetrate to the more highly-ordered regions, resulting in more complete and even distribution of carboxymethyl groups. 6
In the carboxymethylation reaction, the cellulosic fabric is soaked in sodium hydroxide and then padded, followed by drying. In this process, cellulosic fabric converts native cellulose into alkali cellulose. Cellulose fibers are swollen and activated for other chemical treatment. Alkali celluloses reactive sites react with sodium chloroacetate. Sodium chlo-roacetate treatment is done either by soaking and padding, or by direct padding through the chloroacetate solution, followed by drying. The dried samples are cured and washed. Otherwise, the cellulosic fabric can be soaked and padded through the mixture of sodium or ammonium chloroacetate solution prepared by neutralizing monochloroacetic acid with a weak base like sodium carbonate, ammonium carbonate, and so forth. The monochloroacetic acid flakes are dissolved in deionized water. Solution concentrations up to 9.0 M have been prepared and neutralized using the weak base. Carbon dioxide is evolved in the reaction as monochloroacetic acid is neutralized. This solution is used to pad the cotton, followed by further treatment under various conditions. Hydroxyl groups on the cellulose chains are replaced by stable ether linkages, forming anionic cellulose as shown in Fig. 1.6–9
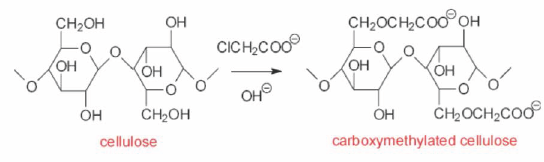
Carboxymethylation reaction of cotton with chloroacetic acid and sodium hydroxide. 8
In prior work, cotton fabric made anionic via carboxymethylation with monochloroacetic acid can be crosslinked in a second step by application of agents with the opposite ionic charges. 10 Hashem et al. reported enhancing wrinkle free properties of carboxymethylated cotton fabric via ionic crosslinking with poly(vinylpyrrolidone). 11 In addition, layer-by-layer self-assembly deposition of polyelectrolytes on ionic cotton have been studied in recent reports.12,13 However, few studies focus on charge distribution of anionic cotton fabrics, which is an important factor in further ionic crosslinking or nanolayer self-assembly processes. Charge distribution of anionic cotton controls surface properties and the structure of the assembled layers, such as the layer morphology and thickness.
The relative amount of total negative charges of carboxy-methylated cotton can be found by acid-base titration. 14 Streaming current and streaming potential measurements are sensitive methods for detecting cellulose fiber surface charge.15,16 In this research, the surface charge of anionic cotton with two different levels of treatment was determined by streaming current and streaming potential measurements. Total and surface charges of anionic cotton fabrics from two levels of treatment are compared, and charge distributions were determined.
Experimental
Materials
Bleached 100% cotton woven fabric was used in all experiments. Monochloroacetic acid (CAA, 99%, Acros Organics Co.) was used as anionic agent. Sodium hydroxide (50% w/w aqueous solution, Fisher Scientific Inc.) was used as base. Polyelectrolytes for charge titration consisted of the potassium salt of poly(vinylsulfonic) acid (PVSK, 170 kDa) and poly(diallyldimethyl) ammonium chloride (poly-DADMAC, 400-500 kDa), both of which were supplied by Aldrich Co. All experiments were performed with, and solutions prepared from, deionized water from an ion-exchange system (Pureflow Inc.), which was further processed in a Milli-Q Gradient unit (Millipore) to ensure ultrapure water (resistivity greater than 18 MΩ).
Carboxymethylated Cotton Preparation
Cotton fabrics (cut to 30.5 cm squares) were made anionic by carboxymethylation using a simple, two-step procedure reported elsewhere.2,3 First, the fabric samples were soaked for 10 min in 20% sodium hydroxide aqueous solution, padded to 100% wet pickup, and dried at 45 °C for 12 min. Separately, a solution of CAA was neutralized by a weak base, sodium carbonate, to form a sodium chloroacetate solution. Two different chloroacetate solution concentrations were prepared (95 and 195 g/L) to produce two different levels of anionicity in cellulose. This was done by soaking the pretreated fabrics for 5 min in the respective aqueous solutions of chloroacetate, padding to 100% wet pickup, curing for 30 min at 85 °C, and washing with water. Acidification with 2 g/L acetic acid and washing again with water was finally performed before air drying for storage until use. Randomized samples were cut from the carboxymethylated cotton specimens.
Acid-Base Titration
The total anionic content of the carboxymethylated samples was quantitatively determined by acid-base titration and reported as mmol /100 g of fabric. The method was adopted from previous work 10 Small pieces (2.5 × 2.5 cm) were cut from different parts of the treated sample. These pieces were further cut into smaller pieces (3 × 3 mm). They were then soaked in 0.5% hydrochloric acid overnight. The sample pieces were then filtered off, washed several times with deionized water until the washed water showed no presence of chloride by the silver nitrate drop test, then dried at 105 °C for 3 h. They were then weighed accurately to 0.25 g and soaked overnight at room temperature in 25 mL of 0.05 N NaOH. The blank was kept without any fabric sample in it. The next day, the blank was first titrated with 0.05 N aqueous HC1 using phenolphthalein indicator. At the endpoint, the volume of HC1 spent was recorded as Vblank. The procedure was repeated for the soaked sample and the reading was noted as Vsample.
Negative groups of the anionic cotton reacted with hydrochloric acid. After the reaction, the fibers were filtered and washed until no hydrochloric acid was left, which was proved by the silver nitrate drop test. Sodium hydroxide was added to neutralize the filter fibers, with an excess amount left to be titrated by hydrochloric acid. Vblank is the amount of HC1 required to neutralize NaOH without fibers present. Vsample is the amount of HC1 added to neutralize the remaining NaOH not consumed by the fiber. Therefore, the difference between Vblank and Vsample determined the total negative charge of anionic cotton, as calculated by Eq. 1.
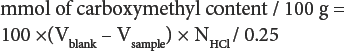
NHCl = 0.05 N, the normality of the titrant HC1 solution. For example, if Vblank is 14 mL and Vsample is 10 mL, the mmol of carboxymethyl content / 100 g is equal to 80 mmol / 100 g.
Surface Charge Determination
Streaming Current (SC) Tests
An ECA2000P electrokinetic charge analyzer (Chemtrac Systems Inc.) was used in these experiments. The procedure for testing anionic cotton is summarized as follows. An anionic cotton sample was cut into very tiny pieces, and ∼0.25 g of anionic cotton fibers was mixed with 50 mL deionized water. When fibers were cut from 95 g/L anionic cotton, poly-DADMAC (0.002 N) was added to make the solution positively charged and, after stirring for 20 min, the mixture was then filtrated to yield 10 mL of sample.
The SC device was cleaned to remove any residual sample from previous titrations. Diluted sample (5 mL) was placed in the device. The apparatus was equilibrated with a preliminary aliquot of the sample to be tested. A fresh aliquot was added, and the initial signal was recorded from the meter output. The initial sign of the charge indicated by the streaming current detector was noted. When the initial sign was positive, the sample was titrated with a suitably dilute solution of high-charge anionic titrant PVSK (0.0025 N). The addition rate of PVSK was equivalent to small amounts added each 10 s or so, with the aim of completing each titration in about 60 to 120 s. Titration was continued until the meter output changed from positive to negative. The titration endpoint was obtained from the curve of amount of titrant added vs. the streaming signal. The amount of titrant added to neutralize the sample was used to determine the endpoint.
In the blended solution, which was composed of anionic cotton fiber and added cationic polyelectrolyte poly-DADMAC, the charges of poly-DADMAC minus the charges of anionic cotton should theoretically be equal to the charges of PVSK added to the endpoint. The surface charge of anionic cotton can therefore be calculated from the amount of titrant added to the sample solution at the endpoint.
In this experiment, 0.25 g cut anionic cotton fiber (95 g/L) pieces were mixed with 50 mL deionized water, and then 20 mL poly-DADMAC (0.002 N) was added. Excess cationic polyelectrolyte (poly-DADMAC) should be mixed with the anionic sample. Because anionic cotton cellulose has more negative charges than untreated cotton, it is assumed that there are more negative charges on the fiber surface. To make sure that all negative charges on the anionic fiber's surface were neutralized, 20 mL or more poly-DADMAC was added. The mixture was filtered, and 10 mL was removed to use as a sample for SC testing. The output of the sample used in the test should be positive. With anionic titrant PVSK added, the SC output value changed from positive to negative. According to the endpoint, the dosage of added PVSK (0.0025 N) to neutralize the positive sample was 0.29 mL (this was evaluated from the curve of SC meter output vs. the amount of titrant added shown in Fig. 2). The surface charges of anionic cotton were calculated from Eq. 2.
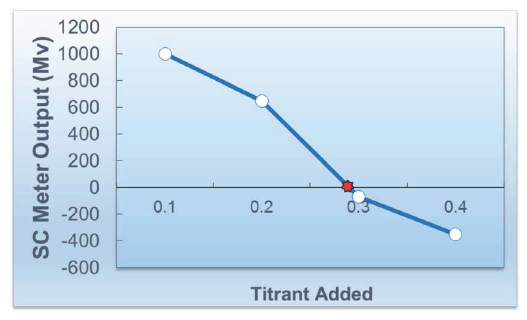
The curve of SC meter output vs. the amount of titrant added. The curve corresponds to a solution of the sample titrated by PVSK under neutral condition. Each additive amount was 0.1 mL. The star represents the endpoint.

Fiber-Pad Streaming Potential (SP) Tests
The purpose of the fiber-pad SP tests is to evaluate the nature of charges on the outer surface of the fibers. SP tests were conducted with deionized water and carried out with a streaming potential jar (SPJ) zeta potential analyzer (North Carolina State University Paper Chemistry Laboratory). 17 Untreated and anionic cotton were cut into very tiny fibers. Samples (pH ∼ 7) of the cut fibers (about 0.25 g for each sample) on an oven-dry basis were blended in 50 mL deionized water for a few minutes. Flow of a fiber suspension towards a screen caused gradual build-up of a fiber pad. Streaming potentials were determined with a pressure differential of 207 kPa across the fiber pad. The streaming potential of untreated cotton fiber solution was measured without titrant additive. Poly-DADMAC (0.002 N) was used as a cationic titrant in anionic cotton tests.
In fiber-pad streaming potential tests (Fig. 3), initial addition of 10 mL poly-DADMAC to the anionic cotton (95 g/L) fiber suspension caused an immediate rise in streaming potential to less negative or more positive values. Thereafter, the streaming potential began to decay back in the direction of its initial state prior to adding poly-DADMAC. The obvious rise shown in Fig. 3 is due to the positive charges of the cationic titrant, which affected the potential of the anionic cotton fiber solution. As titration with highly-charged cationic polymers was carried out, the decay of streaming potential values with time was consistent with diffusion of polyelectrolyte into the anionic solution as the cationic polymer was gradually adsorbed onto the anionic fiber surface. A second, equal dose of poly-DADMAC was added after an elapsed time of 12 min. It immediately reversed the streaming potential to positive; but later, the value of streaming potential decayed again, resulting in a near-zero streaming potential after an additional 8 min of continual stirring. A total of 20 mL poly-DADMAC was added in the anionic sample (95 g/L) to reach the endpoint. The surface charge of the anionic cotton fiber (95 g/L) was calculated using Eq. 3.
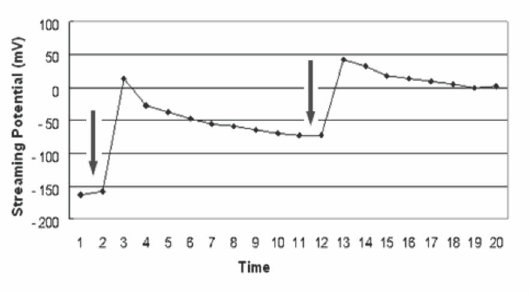
Decay of SP with time when adding poly-DADMAC in the medium-level treatment anionic sample at the 2nd and 12th minute.
Here, 20 mL of the titrant poly-DADMAC (0.002 N) was added to neutralize the solution of anionic cotton fibers (95 g/L). However, in four other tests, every initial quantity of cationic poly-DADMAC additive to the solution was slightly different. The titration endpoint was reached for all the tests in spite of the different additive quantity every time, which affected the total time of the SP test and the total amount of poly-DADMAC added to neutralize the negative charges on the surface of anionic cotton fibers.
Like the titration process in anionic samples (95 g/L), 10 mL poly-DADMAC was added to anionic cotton (190 g/L) fiber suspensions at first, causing an immediate rise in the streaming potential to less negative values (Fig. 4). The streaming potential then began to decay back in the direction of its initial state prior to the addition of cationic polyelectrolyte. A second, equal dosage of poly-DADMAC, added after an elapsed time of 12 min, raised the streaming potential to zero; however the streaming potential decayed to negative again later. Compared to the amount of cationic titrant used to neutralize the anionic cotton (95 g/L) fiber suspensions, more cationic titrant was needed for neutralization of the 190 g/L anionic cotton fiber suspension. Therefore another equal dosage of poly-DADMAC was added at the 20th minute. The streaming potential reversed from negative to positive after decay, resulting in a near-zero streaming potential after an additional 8 min of continual stirring. At the endpoint, a total of 30 mL poly-DADMAC was added to the 190 g/L anionic cotton fiber suspension. The surface charge was calculated by using the same method from the previous example.
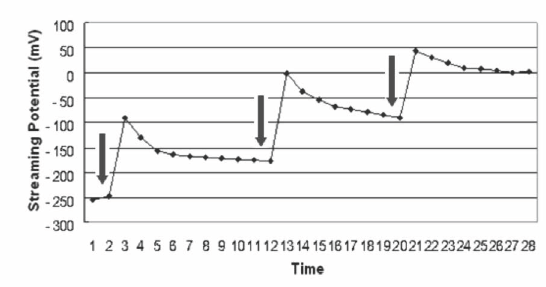
Decay of SP with time when adding poly-DADMAC in the 190 g/L treated anionic sample at the 2nd, 12th, and 20th minute.
The amount of cationic titrant poly-DADMAC (0.002 N) to neutralize the anionic solution of cotton (190 g/L) fibers was 30 mL. As mentioned previously, in four other tests, every initial quantity of cationic poly-DADMAC added to the solution was different. However, the titration endpoint was reached for all the tests in spite of the different addition of cationic poly-DADMAC.
Results and Discussion
Total Charges of Carboxymethylated Cotton
Total charges of anionic cotton with two level treatments and control in five samples are showed in Table I. Control samples carried a small negative charge due to the presence of some carboxylic acid groups from oxidation at the primary hydroxylic sites.11,12 Additionally, cellulose fabrics were anionized, increasing the negative charge significantly by carboxymethylation. These results indicated that cotton fabric treated with a high concentration (190 g/L) of chloro-acetate led to little rise in total negative charges compare to the fabric treated at a medium concentration (95 g/L). The standard deviation was quite low compared to the average value; the five separate determinations yielded parallel values, indicating that the cotton fabrics were equally reacted with the anionic chemicals. The anionic treatment procedure was reproducible.
Total Charge of Anionic Cotton with Different Concentration Treatment
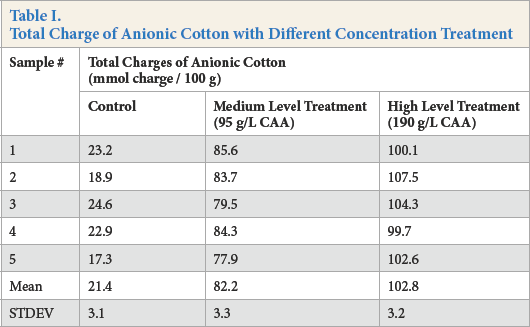
These values confirmed the difference of total negative charges between the anionic cotton samples by two concentration treatments. Although the total charge of anionic cotton with the high-level treatment was higher than that treated with the medium-level treatment, it was not twice as high. As the anionic reactant concentration increased, the total charge of the cotton also increased, but the increase was not proportional to the increase of the anionic reactant. For instance, the biggest difference in total charge of anionic cotton by high-level and medium-level treatment was about 25 mmol / 100 g. Therefore, above 95 g/L concentration, only increasing the anionic agents concentration to 190 g/L concentration under the same conditions did not directly obtain two times the number of negative charges in the cotton fibers. The reasons for this result are: 1) increased anionic reactant led to increased hydrolysis reaction speed and 2) the electrostatic repulsion increased due to the greater number of negative groups, which makes the anionic reactant inaccessible to the cotton.
Contrasting the total charge of untreated cotton, the anionic cotton has greater total charge after treatment. However, the fiber without any anionic treatment still had some negative charges when it is in aqueous solution due to the carboxyl groups. After the anionic treatment, more negative charges should be getting onto the cotton.
SC Measurements
In SC measurement, the endpoint of titration can be evaluated by the curve of SC-meter output vs. the titrant added. Fig. 2 shows the SC signal changed from positive to negative with the negative titrant PVSK addition. The amount of titrant at the endpoint was determined when the output went to zero.
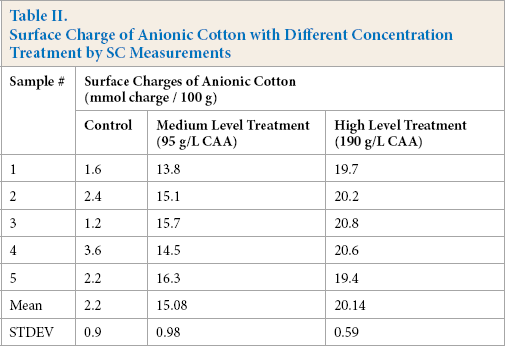
Through this method, surface charges of anionic cotton with two-level treatments and control of five separated samples are shown in Table II. Cotton samples with medium- or high-level carboxymethylation treatment had similar surface charges in five separate evaluations. The standard deviations were very small, and each test result was close to the average value. This means the anionic treatment was repeatable and negative charges were uniform on the surface even though these samples were cut from different places in a large anionic-treated cotton specimen. The surface charge of anionic cotton from 190 g/L treatment was less than twice that of the 95 g/L treatment. The control samples also had a very small amount of negative charges on the surface compared to the anionized treatments.
Surface Charge of Anionic Cotton with Different Concentration Treatment by SC Measurements
In Table III, let the amount of anionic agent reacted with cotton be Q, the quantity reacted with inner fiber be Qi, and the quantity reacted on the fiber surface be Qs. When the anionic agent quantity is increased to 2Q, the quantity reacted with the fiber surface Qs’ is more than Qs, but less than 2Qs, which means that the surface of the cotton fiber that reacted with medium level CAA was not completely covered. There remained some places to react with anionic agent on the fiber surface.
Quantity of Anionic Reactant Reacting with the Fiber Interior or Surface a
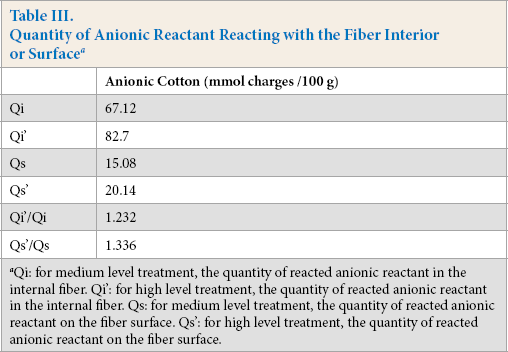
Qi: for medium level treatment, the quantity of reacted anionic reactant in the internal fiber. Qi': for high level treatment, the quantity of reacted anionic reactant in the internal fiber. Qs: for medium level treatment, the quantity of reacted anionic reactant on the fiber surface. Qs': for high level treatment, the quantity of reacted anionic reactant on the fiber surface.
Table III gives each value of anionic agent reacted with cotton interior or surface. Here the number of charges identified the quantity of anionic reactant. For anionic cotton, Qi’ = 1.232 Qi and Qs’ = 1.336 Qs. Surface and inner charges increased due to the increase in anionic reactant. The surface charges increased more than the inner charges because as the anionic reactant concentration increased, the electrostatic repulsion in the fiber was greater than that on the surface. This electronic repellent force retarded reaction of the anionic groups with hydroxyl groups. In previous research, for cationic cotton, Qi’ = 1.272 Qi and Qs’ = 1.694 Qs. High cationic reactant concentration had a greater effect on the amount of charge increase than the anionic reactant. This is because the anionic cotton had a greater total charge, both in the fiber and on the surface, than cationic cotton. Therefore, less anionic reactant reacted with cotton having a high reactant concentration due to greater electrostatic repulsion.
Regardless of the anionic chemical concentration, the surface charge was only a small part of the total charge. In SC measurement, the polymer chains are twisted with only a few internal anionic groups having reacted with the cationic polyelectrolyte. When the positive polyelectrolyte was added, the outside negative charges were neutralized, but the internal part, within the polymer, would be expected to remain negative in charge. The anionic cotton fiber had pores that act as if they were dead-ended cylinders, having one end open to the aqueous solution. At low conductivity, the characteristic sizes of pores in the fiber appears to be sufficiently small, so that high mass polyelectrolytes have difficulty getting into them. But in acid-base titration, the titrant consists of low-mass ions, which easily penetrate into the fiber pores, and all charges of the treated fibers will be measured. Therefore, the surface charges of anionic cotton tested by SC measurements were reliable.
SP Measurements
Fig. 5 shows that the streaming potentials of the anionic cotton fibers with the two treatments were negative. The suspension of anionic cotton fiber (high-level treatment) had a much higher potential than anionic cotton fiber (medium-level treatment). The potential of untreated cotton was -28 mV, while the potentials of anionic cotton fibers with medium- and high-level treatments were -163 and -254 mV, respectively. These observations indicate that the untreated cotton fibers had a negative charge in an aqueous suspension, and that carboxymethylation produced further negative charges on the cotton fiber surface. The streaming potential of anionic cotton from the 190 g/L treatment was less than twice the value corresponding to the 95 g/L treatment. Increased anionic agent concentration did not proportionately increase the streaming potential of the anionic cotton fiber suspension.
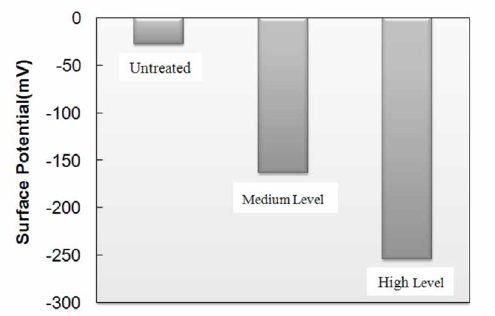
The potentials’ difference among untreated, 95 g/L and 190 g/L treated anionic cotton fibers.
SP testing was used to measure the surface charge of anionic cotton in five different samples. For each experimental run, the dosage of poly-DADMAC varied. The SP output changed from negative to positive by adding cationic titrant several times, depending on its initial addition quantity. The results of negative charges on the cotton fiber surface in five separate evaluations are shown in Table IV. The standard deviations were very small. Each test result was very close to the average value, indicating that the SP tests were reproducible.
Surface Charge of Anionic Cotton with Different Concentration Treatment by SP Measurements
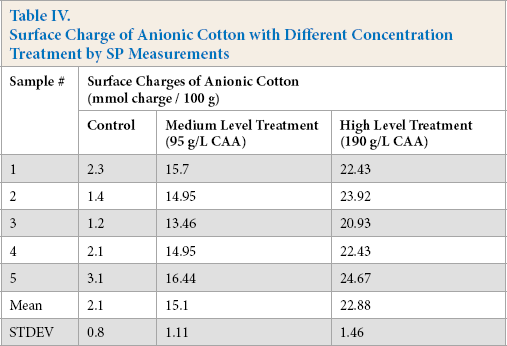
For anionic cotton cellulose treated with two concentrations of reactant, the ratios of surface charge to the total charge were almost the same value (∼20%). Anionic cotton (190 g/L treatment) had a higher ratio of surface charge to the total charge than the corresponding 95 g/L treatment. In this experiment, doubling the anionic agents doesn't increase the ratio of surface charge over the total charge, which may indicate the anionization process of cotton occurred evenly through the fiber. The treatments only gave the fiber anionic charges, but did not change its physical structures.
In the SC measurement, the tested solution was filtrated from the blended solution of anionic cellulose and excess poly-DADMAC. However, in the SP device, the solution containing anionic cotton fibers was directly tested. As shown in Fig. 6, there was only a small difference between the surface charge values obtained by the two methods, with the value from SP higher than the value from SC. This difference was due to the cotton fiber pores. When the cationic titrant was added to the anionic solution, it only reacted with the charges outside. As the mixing time was increased, some titrant molecules diffused into the pores and reacted with the charges inside. For example, in the 190 g/L treated anionic fiber solution, the SP stirring time was longer than that used in the SC test. This means the poly-DADMAC macromolecule had a greater chance of diffusing into the pores and reacting with negative charges. In addition, at a low degree of carboxymethylation, CMC molecules are extended and its structure looked like a rod. As the degree of carboxymethylation increased, the molecules overlapped and formed coils. Therefore, the surface charge of anionic cotton after high-level treatment measured by SP testing was a little higher than that by SC testing, and the results of anionic cotton after medium-level treatment by two methods had almost the same value.
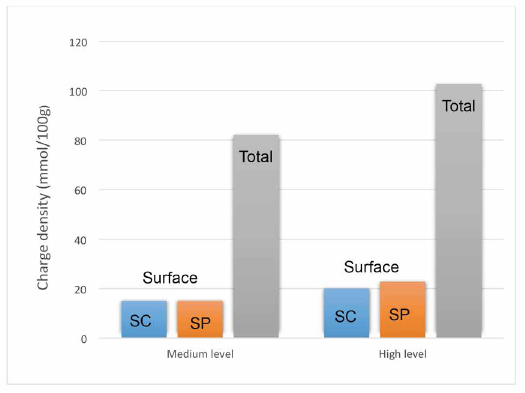
Charges of anionic cotton with two-level treatments.
Conclusions
The surface charges from very small amounts of carboxy-methylated cellulose fabric were characterized with two novel and simple methods presented in this study. As anionic charges on the surface of carboxymethylated cellulose interacted with counter ions in the solution, the streaming current and streaming potential were traced by the electrometer during an ionic solution flow. Through these two measurements, surface charges of cotton fiber treated with two concentrations of anionic reagent were determined: only a small percentage of total charge was located on the surface. Five repetitions from random samples gave similar SC and SP results. The anionic treatment was found to be reproducible and the reactions were evenly distributed in the fiber. In all samples, the ratio of surface charge to total charge was similar. The results of surface charge obtained by the SP technique were similar to those obtained by the SC technique. Therefore, SC and SP measurements can be further used to determine the surface functionality of ionized textile materials by in situ characterization of the material's surface charge potential.
Footnotes
Acknowledgements
The authors acknowledge financial support from the National Research Initiative of the USDA Cooperative State Research, Education and Extension Service, grant number 2007-35504-18290.