
Abstract
AATCC Test Method (TM) 66 is a widely used method to determine wrinkle recovery of woven fabrics. Using a dynamic measurement system designed in the author's laboratory, this study enabled dynamic measurement of every frame image collected during the wrinkle recovery process. The precision of this system was tested against a standard wrinkle recovery angle tester. Data and plot comparisons indicated that the wrinkle recovery period in AATCC TM 66 should be shortened to balance both efficacy and efficiency.
Introduction
Wrinkles can have a bad influence on fabric appearance. What's worse, it's prone to cause intense fabric wear along the direction of crease line or wrinkles, thus quickening fabric damage. 1 For this reason, wrinkle recovery is an important index to fabric performance.
Wrinkle recovery is the resistance to fabric wrinkling in use and the fabric's ability to recover after wrinkling. Tere are two kinds of methods to test wrinkle recovery performance, the subjective method and the objective method. The subjective method, also called the appearance method, evaluates wrinkle recovery performance by comparing the wrinkled fabric specimens with standard specimens. However, some research has indicated that man-made observation errors take place more often and more severely using the subjective method. 2 The objective method characterizes wrinkle recovery using the winkle recovery angle (WRA).
WRA is the most commonly used indicator of a fabric's ability for wrinkle recovery. It is the angle between the free end and fxed end of a specimen in a regulated pattern afer weight application and removal for a certain time period. AATCC Test Method (TM) 66 is a representative method used for WRA determinations.
However, neither method can fully evaluate the entire wrinkle recovery process. The evaluation of wrinkle recovery performance by these methods neglect other factors involved in the wrinkle recovery process. Another method analogous to AATCC TM 66 is AATCC TM 128. In Qiu and Yang's research, 3 the deformation time suggested by AATCC TM 128 should be reduced to improve its efficiency. The analogous conclusion is reached in the present study.
In this study, a dynamic measurement of wrinkle recovery is proposed. Dynamic measurement devices can analyze every photographic frame taken for three groups of fabric samples during the whole wrinkle recovery process. The new device automatically applies weight pressure to the fabric samples and removes the weight pressure at a given time, while automatically taking pictures every few seconds and processing the data. Use of this device can help minimize manual interference and visual bias that may lead to errors. It also makes it possible to identify slight changes at different stages of a fabric sample's winkle recovery process.
Afer validating the precision of the dynamic measurement system against a standard WRA tester and loading device, it was discovered that the length of testing time afer pressure unloading in the existing AATCC TM 66-2008 was not really effective. The wrinkle recovery period needs shortening with guaranteed precision.
Methodology
Dynamic WRA Test System
The dynamic WRA test system was devised in the digital processing laboratory of the School of Textiles and Apparel at Jiangnan University. 4 Tis system is distinguished from the standard WRA test system by its automation and its precision using automatic digital scale WRA measurement. A photograph and mechanical drawing of the system is shown in Figs. 1 and 2.
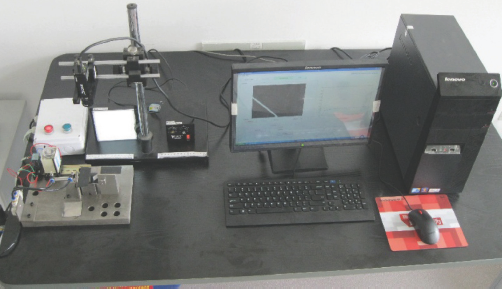
Dynamic WRA test system for wrinkle recovery.
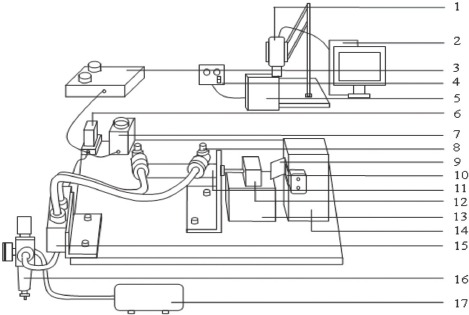
Schematic of dynamic WRA test system for wrinkle recovery.
The dynamic WRA test system includes the following components (Fig. 2): air compressor (17), pressure-reducing valve (16), electromagnetic valve (15), and air cylinder (11) connected successively from one to another to provide stable and consistent pressure (in this study, the pressure was set to the same pressure made by a 500-g loading device as specified by AATCC TM 66) over a certain period of time (5 min). The electromagnetic valve (15) is controlled by a relay group—made up of an intermediate relay (6) and a time relay (7)—to drive air cylinder (11) and push briquette (12) above platform (13) to press the woven fabric specimen (9). The controlling box (3) controls the actions of the relay group. The charge-coupled device (CCD) camera (1) collects frame pictures of the specimen's free leg during the wrinkle recovery process at certain rate and resolution of 640 × 480 pixels. The light source (5) provides a horizontal light of a certain brightness. The computer (2) analyzes collected pictures and the light source controller adjusts the brightness. The specimen holder with stainless steel leaves is set on a specimen holding platform (14), slightly higher than the briquette platform (13), to hold the specimen (9) and avoid its adhesion between the fxed leg and the free leg. Tis system also includes a JA-1.2T micro punch as a sampler (Fig. 3).
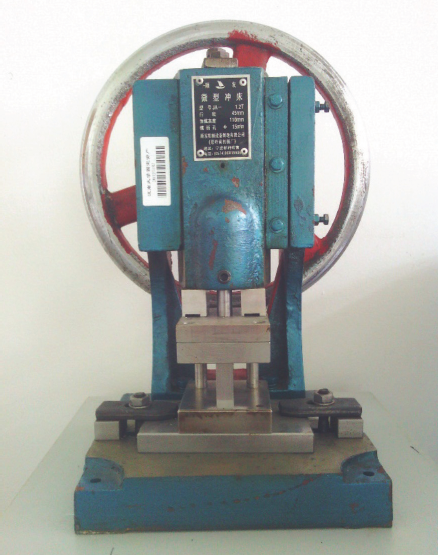
JA-1.3T micro punch.
Software matched with this hardware is a program developed on Matlab by Wang Lei. 4 In this study, the software calls the CCD camera (1) to photograph frame pictures at the rate of 1 frame/s during the 5 min wrinkle recovery, and then binarization, thinning, and Hough transformation of the original pictures sequentially to compute the WRA value corresponding to each frame shot. The computed WRA values are listed and stored as Matlab data for further analyses.
Image Collecting
Afer the weight was removed, the software called the CCD camera using the Basler industrial video suite to collect gray scale images (Fig. 4) of a specimen during wrinkle recovery at the rate of 1 frame/s, altogether for 300 frames in 300 s. The image resolution was 640 × 480 pixels. Tere was a strong contrast between the color of the specimen and the background. The light was adjusted to be bright enough for later image processing.
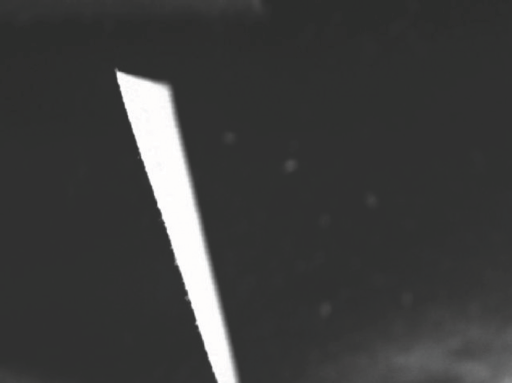
Original wrinkle recovery image.
Thresholding
Thresholding is a simple but effective tool used to separate objects from the background. It arises due to substantial differences between the gray levels of pixels belonging to the object and the gray levels of pixels belonging to the background. The output of the thresholding operation is a binary image; one state indicating the foreground objects, while the complementary state corresponds to the background. 5 In this study, the foreground was represented by gray-level 0 (black) and the background by gray-level 255 (white) as shown in Fig. 5. Ostu's method for thresholding was used in this study. 6

Binary wrinkle recovery image.
Tinning
Tinning is the reduction of generally elongated patterns to a line-like representation. Successive layers of pixels on the boundary of the patterns can be deleted using a thinning algorithm until only a skeleton remains. 7 Since, according to AATCC TM 66-2008 (Option 1), a vertical plane through its center should be sighted and aligned with the vertical mark on the circular scale if the free end of the specimen twists, the thinning algorithm is a crucial preparation before the Hough transformation for angle calculations (Fig. 6).

Result of thinning algorithms on wrinkle recovery image.
Hough Transform and Recovery Angle
The Hough transform is a widely-used parameterized detection method for geometric figures as lines, circles, ovals, and so forth. 8 Using the Hough transform algorithm, the line in the thinning figure can be extracted and the coordinates of every pixel in the line is transformed to a coefficient field. Through the relationship of line interception, the extraction of lines is converted into numbers. 9
A target straight line can be expressed in polar coordinates, as shown in Eq. 1.
In a given image space
Going through the whole image, the corresponding
The steps taken to find the WRA for every collected image by the CCD camera using the Hough transform were as follows:
Images were loaded afer thresholding and thinning processing
The size of the Hough transform accumulator was determined according to the image size and allocated storage
Values for Δ
Hough transform the pixel if it was white—for every pixel in the picture
Frequency statistics for the parameter space of
The WRA obtained by Hough transform of the data obtained using the dynamic WRA test system was 75.1°.
Shown in Fig. 7 are pictures at 1, 5, 10, 30, 60, 71 (when the WRA reached 90% of the WRA afer 300 s), 120, 150, and 300 s. Tese time were chosen because the WRA changes were most obviously seen.
Time lapse images taken during wrinkle recovery by dynamic WRA test system. a) 1, b) 5, c) 10, d) 30, e) 60, f) 71, g) 120, h) 150, and i) 300 s.
The angles corresponding to every picture in Fig. 7 are given in Table I. Processing the pictures as described above, the wrinkle recovery process was measured dynamically and the WRA analyzed from more aspects.
Experimental
Tere were two experiments in this study. Experiment 1 was an accuracy validation of the dynamic measurement system, which only captured the last picture afer 5 min and compared the calculated value of the angles with the standard WRA test system (Fig. 8). The standard WRA test system, as shown in some research, is regarded as having the better testing precision than others. 12
Standard WRA test system and loading device.
Experiment 2 used the new dynamic WRA test system, which captured 300 pictures at a rate of 1 frame/s during the whole recovery time of 5 min, followed by results analysis.
Materials
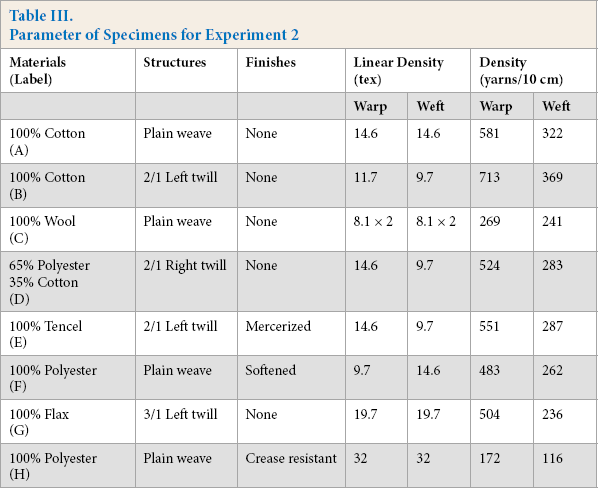
In Experiment 1, there were three different types of specimens tested with specific parameters (Table II). Four groups were created; each group containing one specimen each of the three types of specimens for a total of three specimens per group. The four groups contained specimens that were warp folded face-to-face, warp folded back-to-back, filling folded face-to face, and filling folded back-to-back. Warp folded means the long dimension of the specimen was parallel to the warp direction of the fabric, and filling folded means the long dimension of the specimen was parallel to the filling direction of the fabric. Twelve groups (36 specimens) were used in Experiment 1, with their results compared for accuracy validation. In Experiment 2, the same materials were tested as in Experiment 1 plus 5 other kinds of specimens were tested as well. Altogether, eight kinds of specimens in their 32 groups were measured in Experiment 2.
Parameter of Specimens for Experiment 1
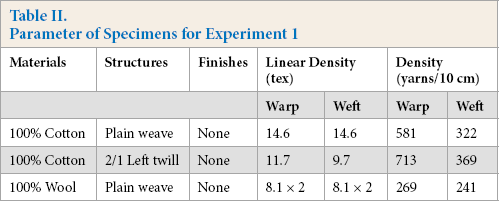
The materials chosen were varied and were finished differently, so there were great differences in their resistance to recovery. Tese materials are listed in Tables II and III.
Parameter of Specimens for Experiment 2
The size of each specimen was 40 × 15 mm and were laid fat to condition at 65 ± 2% relative humidity (RH), at 25 °C for 24 h.
Procedures
Experiments 1 and 2 both used the same test method for each test device, AATCC TM 66-2008 (Option 1). 13 To summarize, a 500-g weight was applied to each 40 × 15 mm specimen for 5 min ± 5 s, and afer a recovery time of 5 min ± 5 s, a recovery angle was read and recorded. Details are available in the test method reference. 13
For tested specimens in both Experiments 1 and 2, each captured picture was processed to a WRA value as previously described. In Experiment 1, only one WRA angle value for each specimen was directly shown on the screen. In Experiment 2, the 300 WRA values for each specimen were plotted for later comparisons. The x-axis displayed time in 1 s units and the y-axis displayed the corresponding WRA value in 1 degree units. One line appeared for each specimen, and three lines for a group test were obtained for analyses.
Special Instructions
Two kinds of notable errors occurred in the experiments. First, the fibers or yarns of the free leg of the specimen touched and were blocked by the briquette platform (see in Fig. 2 the constituent part 13) if the specimen was placed lower than the standard height. In this case, the recovery was greatly influenced by the additionally external force given by the contact area of the briquette platform and fibers or yarns of the specimen. Second, for specimens whose edges were not treated clearly, the very irregular edge influenced the operation of the soft-ware to give a fluctuant and inaccurate result of the angles calculation. Both of the errors can be detected clearly as they both show dynamic measurement error features (Fig. 9).
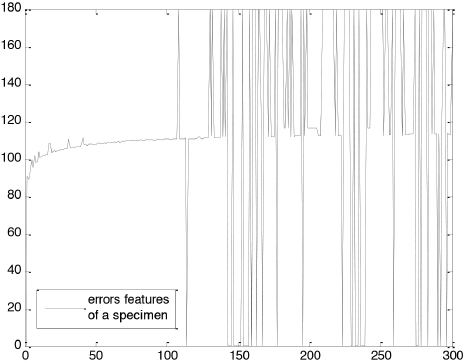
Specimen error features.
Fig. 9 displays the errors well: before 100 s, the first kind of error appears, and afer 100 s, the second kind of error appears.
These errors can be clearly observed in the experiment. Therefore, obvious errors like intense recovery fluctuations and excursions from normal test results were excluded. Usually, the experiment for each group of each kind of specimen will hold up to five times if notable errors occurred in the first three times or less. To better present and analyze valid experimental results, these errors were excluded.
Results and Discussion
Accuracy
The highly automated dynamic WRA test system was introduced in Fig. 2. The specimens, afer weight removal, did not need to be transferred to another place and the need to keep the free hanging end of the specimen in alignment with the vertical mark was not necessary either, as for the standard WRA test system. If the free end of the specimen twisted, algorithms in the dynamic WRA test system calculated the WRA value better than by sighting and aligning visually using the standard WRA test system.
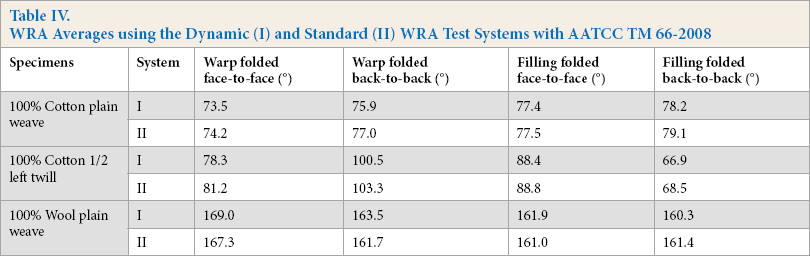
Testing results are compared in Table IV. The data shows that, for the tested specimens, testing results using the standard WRA test system and the dynamic WRA test system were very close. The differences between them remained between 0 and 3°, most of which were less than 2°. The standard deviation (obtained with Eq. 2) of every tested group of specimens using the dynamic WRA test system was most often restricted to the reference standard deviation for the wrinkle recovery test in AATCC TM 66-2008 (Option 1), in which the advised standard deviation is confined to warp 2.47° and filling 2.50°. 13 Tis can be explained with few man-made interferences in the tests using the dynamic WRA test system. Therefore, it is feasible to use the dynamic WRA test system to test wrinkle recovery.
WRA Averages using the Dynamic (I) and Standard (II) WRA Test Systems with AATCC TM 66-2008
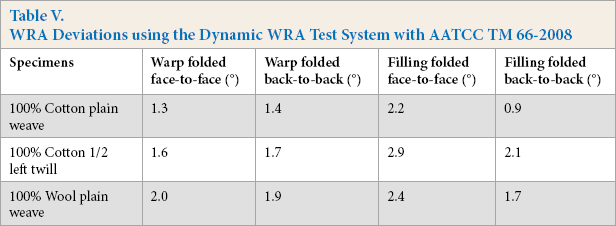
WRA Deviations using the Dynamic WRA Test System with AATCC TM 66-2008
Dynamic WRA Test System Results
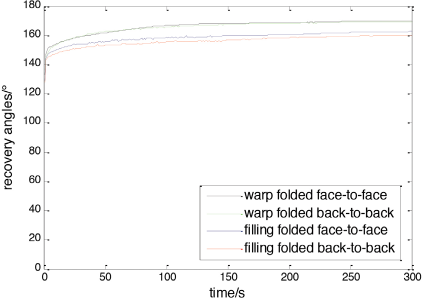
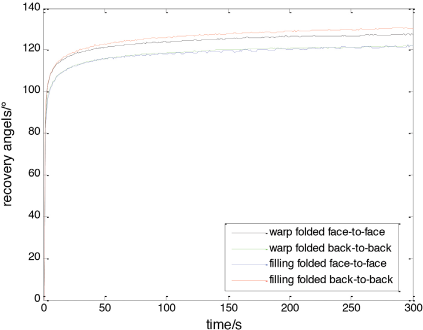
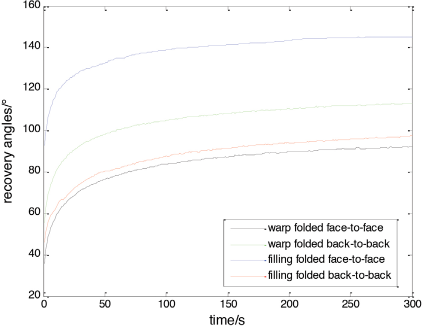
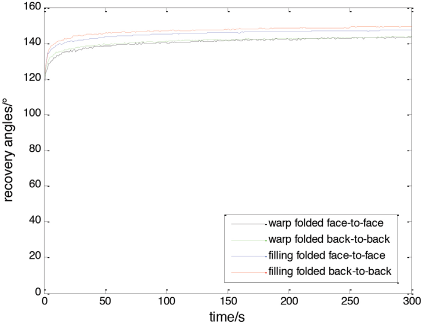
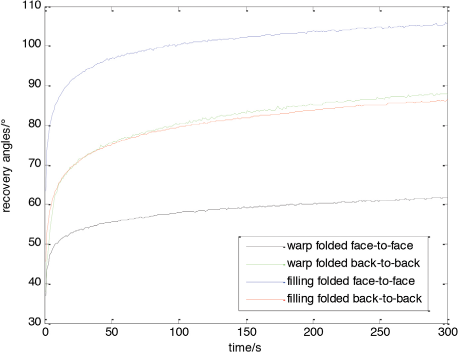
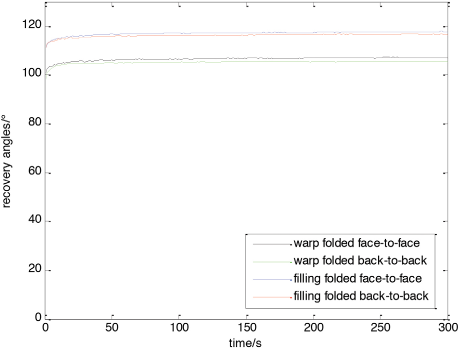
The results of dynamic measurement of eight groups of samples, from Specimens A to H, are shown in Figs. 10–17.
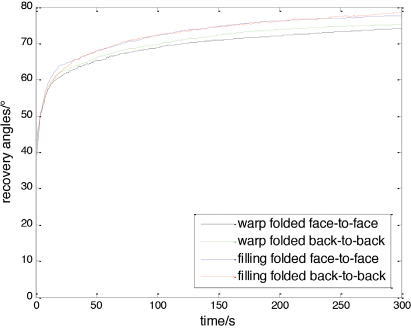
Dynamic WRA test system wrinkle recovery measurements of specimens A.
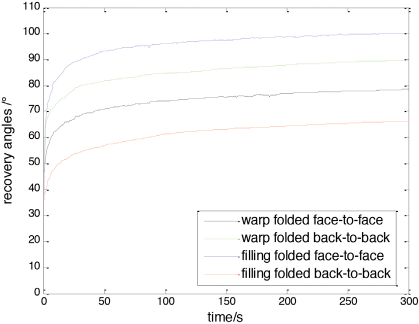
Dynamic WRA test system wrinkle recovery measurements of specimens B.
Dynamic WRA test system wrinkle recovery measurements of specimens C.
Dynamic WRA test system wrinkle recovery measurements of specimens D.
Dynamic WRA test system wrinkle recovery measurements of specimens E.
Dynamic WRA test system wrinkle recovery measurements of specimens F.
Dynamic WRA test system wrinkle recovery measurements of specimens G.
Dynamic WRA test system wrinkle recovery measurements of specimens H.
To avoid errors, the line that is mostly between the other two lines from the three lines of one folded pattern was chosen to compare with the results of other groups of specimens, and the data values corresponding to that line are the values compared to other groups.
Because there was little difference between the face side and the back side of plain weave specimens, the testing results of face-to-face folded and back-to-back folded in one direction of both 100% cotton and 100% other fiber specimens were nearly the same. AATCC TM 66-2008 (Option 1) specifies that if the difference between face-to-face and back-to-back averages is not greater than 15°, average all warp readings and all filling readings separately. If the difference between face-to-face and back-to-back averages is greater than 15°, report the four averages separately. 13 To meet these conditions, the following comparisons used only the average readings and filling readings.
For every group of specimens, besides the wrinkle recovery angle at 300 s, the angles at 1 s, 10 s, 60 s, the time when the recovery angle reached the 90% of the angle at 300 s, and the growth rate of recovery angles near 10 s and 60 s were also compared. To make it easier to differentiate, we call the angles at the 1 s the initial wrinkle recovery angle, and the angles at 300 s the final wrinkle recovery angle (Tables VI A–D.). Growth rate over a period of time is calculated as given in Eq. 3.
Data Comparisons for Specimens A and B
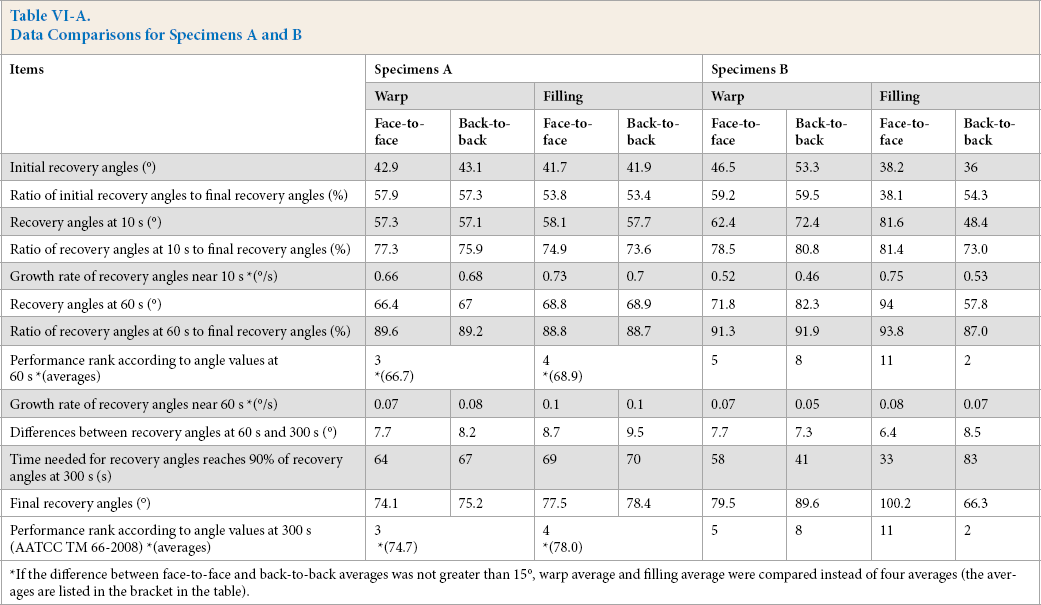
If the difference between face-to-face and back-to-back averages was not greater than 15°, warp average and filling average were compared instead of four averages (the averages are listed in the bracket in the table).
Data Comparisons for Specimens C and D
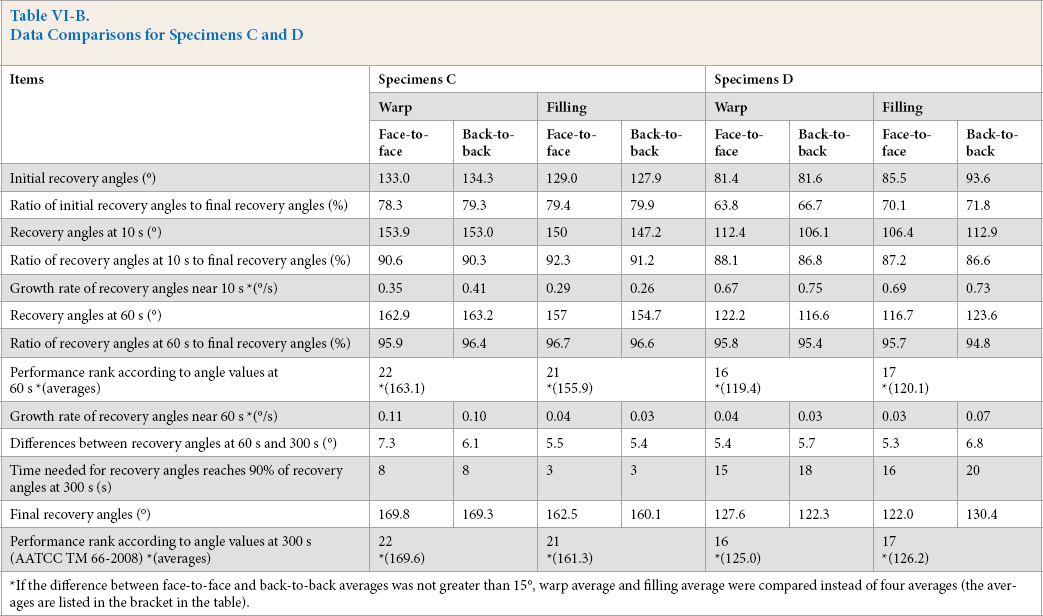
If the difference between face-to-face and back-to-back averages was not greater than 15°, warp average and filling average were compared instead of four averages (the averages are listed in the bracket in the table).
Data Comparisons for Specimens E and F
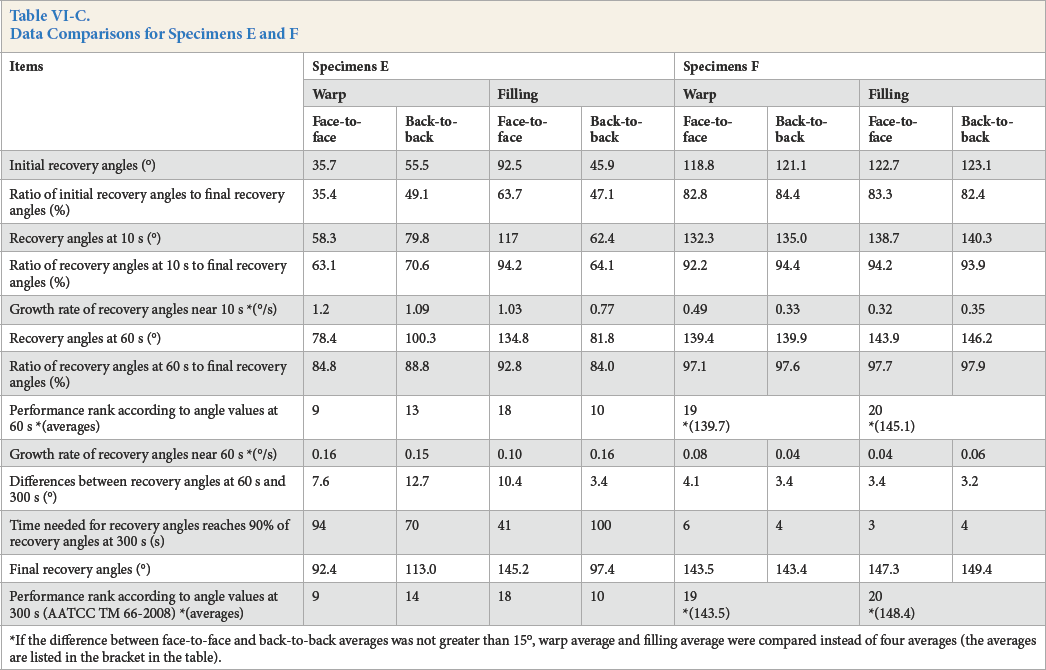
If the difference between face-to-face and back-to-back averages was not greater than 15°, warp average and filling average were compared instead of four averages (the averages are listed in the bracket in the table).
Data Comparisons for Specimens G and H
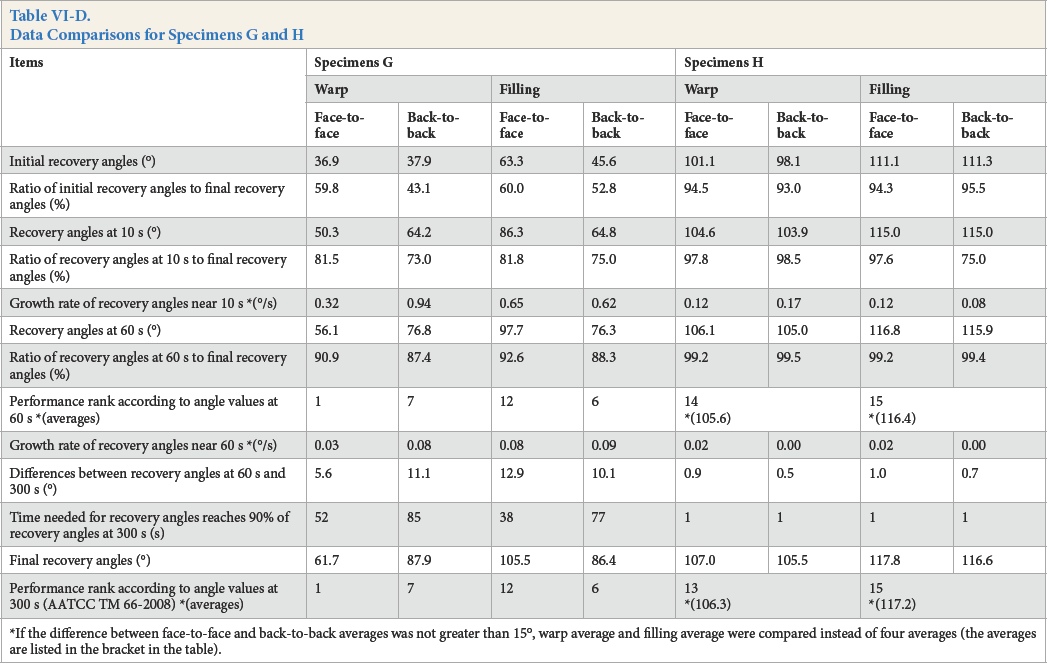
If the difference between face-to-face and back-to-back averages was not greater than 15°, warp average and filling average were compared instead of four averages (the averages are listed in the bracket in the table).

A(T + n) is the recovery angle at (T + n) seconds. For example, for one specimen in its folded pattern, the recovery angle at 6 s is 53.3°, at 15 s is 60.1°, then the recovery angle growth rate near 10 s is (60.1° – 53.3°) / 10 s = 0.68 °/s.
The initial recovery angles are important for comparison between fabrics made of different materials. Fabrics made from 100% wool usually have obvious wrinkle recovery differences from fabrics made from 100% cotton. Most of the initial recovery angles of every group of specimens were greater than 50% of the final WRA value. However, this cannot be used to judge wrinkle recovery performance accurately, due to the great uncertainty and changes in angles in the first 10 s if the comparisons are not limited to specimens of different materials. For example, for fabrics having the same materials and structures (100% cotton twill, Specimens B) but different folding, the initial WRA value of specimens filling folded face-to-face was 8.3° less than that for specimens warp folded face-to-face, while the WRA value at 10 s of the filling folded was 19.2° greater than the warp folded. It was impossible to read and record the initial recovery angle with the standard WRA test systems—the first second goes by quickly before the specimen was transferred from the loading place and was fxed on the holder.
For all the specimens tested, the performance of wrinkle recovery could be judged to be roughly accurate afer 10 s. Tat is, the performance ranks of WRA values did not change for most specimens (Figs. 10–17; the curves did not intersect with each other in most cases), whether or not these were made of the same materials or with the same structures. The rank of wrinkle recovery performance judging from the recovery angles at this time even matched perfectly with the rank at 300 s according to AATCC TM 66-2008 (Option 1). But slight changes also occurred to particular specimens at a time near 10 s, indicating that this match may only be a coincidence. As for 100% cotton plain woven specimens folded back-to-back, WRA values at around 10 s for warp direction and filling direction did not have a certain rank (Fig. 13). Therefore, the 10 s time period for these specimens was not long enough to reliably judge the performance differences. What's more, the growth rate of WRA values at this time was not only large, but was also notable among various specimens. The interferences resulting from the differences of time when the specimens were fxed in the holder with tweezers were also much more notable than at a longer recovery time, and every second meant notable changes in WRA values that accounted for differences in wrinkle recovery performance. Therefore, WRA value readings at 10 s cause errors to occur for standard WRA test systems.
Afer 60 s, most WRA values surpassed 90% of the final WRA values, but not all. However, those who haven't reached 90% of the final WRA values were also very close to it, with slight differences appearing in the final 240 s for some specimens. To understand this better, the differences between the WRA values at 60 s and the final WRA values were calculated (Tables VI A–D). Usually, the last 240 s of the recovery process contributed less than 10° of the WRA value, usually near 5°. Therefore, it is feasible to judge the wrinkle recovery performance according to WRA values afer 60 s.
Differences in the performance of Specimens H (warp folded) and Specimens E (warp folded back-to-back) were compared. Their performance ranks of 60 s and 300 s respectively were reversed, yet their whole dynamic measurement recovery curve and the final 300 s result that Specimens E (warp folded back-to-back) was better than Specimens H (warp folded) according to AATCC TM 66-2008 (Option 1) were contradictory. The dynamic measurement curve and Table VI show that Specimens H (warp folded) recovered much faster than Specimens E (warp folded back-to-back); the former needed only 1 s to reach 99.6° (average from folded face-to-face and back-to back), 90% of its final WRA value, while the latter needed 70 s for the same result. The difference in their final WRA values at 300 s was only 6.7°. Based on a rough performance assessment according to AATCC TM 66-2008 (Option 1), these results could be regarded as having the same recovery performance, yet their actual performance differed remarkably. If the dynamic measurement curve is a referable performance indicator, Specimens H (warp folded) were better recovered than Specimens E (warp folded back-to-back). It appears that the recovery performance estimation at 60 s can balance efficiency and effectiveness, and can provide additional useful information, that is, whether the specimens can recover both well and quickly.
Conclusion
The time of test for wrinkle recovery afer removing the weight in AATCC TM 66-2008 (Option 1) should be shortened. In our tests, all specimens reached 90% of their final WRA value at 60 s. The rank of wrinkle recovery performance remained unchanged afer 60 s, as the rate of increase in WRA values were too slow to make any difference. According to these results and analyses, the conclusion was reached that the recovery time in AATCC TM 66-2008 of 300 s was too long and inefficient. The recovery time should be shortened so that both precision and efficiency can be assured. Based on all specimens tested, the recovery time should be shortened to 60 s.
Footnotes
Acknowledgement
The authors would like to thank the anonymous reviewers and the handling associate editor for their insightful comments. This project was supported by the National Natural Science Foundation of China (grant number 61203364), the China Postdoctoral Science Foundation (grant number 20110490098), the Special Financial Grant from the China Postdoctoral Science Foundation (grant number 2012T50754), and the Foundation of Engineering Research Center of Technical Textiles, Ministry of Education (grant number 2011k-03).