
Abstract
Rheumatoid arthritis (RA) is a relatively common autoimmune disease with strong genetic and environmental determinants. The disease manifests itself as inflammation of the synovia and usually progresses to joint erosion and destruction. The disease can also be considered as a systemic disease because extra-articular manifestations are often observed throughout many organs and tissues of the body. Patients with severe RA have altered peripheral blood monocytes (PBM) that express activation markers. Two such markers, PKC-η and iNOS, were studied using confocal laser scanning microscopy to determine how these markers are expressed during disease progression. Healthy individuals expressed neither of the two markers, but there was an elevated level of PKC-η observed as the disease progressed (40% in mild RA and 100% in severe RA patients). Concordant expression of the two markers was observed in only 3% of PBM from mild RA patients, reaching 38% in severe RA patients. No cells expressing iNOS alone were observed in any of the patients studied. These data support the hypothesis linking PKC-η expression with the regulation and predisposition to the development of the iNOS phenotype in severe RA patients. PKC-η may therefore be a key regulator in the production of elevated plasma nitric oxide (NO) and corresponding circulating reactive nitrogen intermediates in severe RA and may be a possible target to regulate iNOS induction and NO production by monocytic cells in RA patients and possibly other inflammatory diseases.
Keywords
N
Biosynthesis of NO is a complicated process under the control of three isoenzymes, nitric oxide synthases (NOS), namely, nNOS, eNOS, and iNOS (Andrew and Mayer 1999). nNOS is a neuronal, constitutive, Ca2+-and calmodulin-dependent enzyme involved with neurotransmission. eNOS is also Ca2+ and calmodulin dependent and constitutively produced, mainly by endothelial tissues, and is involved with the regulation of vascular tone and maintenance of blood pressure. Finally, iNOS, an inducible enzyme produced by many cells including monocytes is involved in a number of immunological functions that require production of large and sustained quantities of NO. This inducible enzyme is Ca2+ independent (Hobbs et al. 1999).
The second marker studied, protein kinase C-eta (PKC-η), is one of 12 PKC isotypes found in cells (Newton 1995). They are serine-threonine kinases involved in cytoplasmic signaling and have been implicated in numerous regulatory functions. These kinases have a complex tissue distribution and often compete or oppose regulatory functions. PKC isotypes are classified into three major families that in some ways delineate the cytoplasmic conditions in which the molecule is most active. The classical PKC molecules (α, β1, β2, and γ) have been shown to be activated by phospholipids and diacylglycerol and require Ca2+ for activity. Novel PKC molecules (δ, ∊, η, θ, and μ) have also been shown to be activated by phospholipids and diacylglycerol but are Ca2+ independent. Atypical PKC molecules (ζ and Λ) have been shown to be activated by phospholipids (Gomperts et al. 2002).
Murine monocytic cells and cell lines have been the main model used to study the induction of iNOS and production of NO by cells (Xiu and Liu 1998; Szabo 2000). However, human monocytes and monocytic cell lines behave very differently from their murine counterparts in their ability to respond to activators such as endotoxin and proinflammatory cytokines. The ability of human monocytes to produce NO following induction of iNOS has had mixed success and, only under certain circumstances, have these cells readily shown this phenotype (Panaro et al. 2003). In many cases, researchers have been unable to induce iNOS in human monocytes and observe NO production (Scheemann et al. 1993).
A number of hypotheses have been proposed to explain this, one of which suggests that the lack of response is due to the absence of PKC-η in human monocytic cells (Pham et al. 2003a). The signaling pathway from endotoxin through the TLR-4 receptor leads to the transcription of iNOS. The role of PKC-η in this process has not yet been established, but we believe that it may be involved in the regulation of phenotypical development. In murine monocytic cells, PKC-η has been shown to be present but absent in human monocytic cells. Also, human monocytic cells have been reported to be resistant to lipopolysaccharide (LPS) induction of iNOS and NO. Transfection of PKC-η into a human monocytic cell line resulted in the subsequent sensitivity of these cells to LPS and production of NO (Pham et al. 2003a). Second, peripheral blood monocytes (PBM) from patients with inflammatory diseases such as RA, psoriatic arthritis, and anklyosing spondylitis were shown to be positive for both PKC-η and iNOS, whereas cells isolated from healthy controls were negative (Pham et al. 2003b). This study used RT-PCR to determine the presence or absence of PKC-η and iNOS and could not pinpoint the level of protein expression, frequency of expression, or cellular distribution of these two markers. These data were also unable to resolve if these markers were found individually in two different cell phenotypes or were concordantly expressed in a single cell phenotype.
The above-mentioned cell transfection studies and the clinical findings with PKC-η led to the hypothesis that there may be a possible direct correlation between the progression of the two markers, and that the expression of PKC-η may be essential for switching to the iNOS phenotype, thus influencing production of NO and the severity of the disease. This hypothesis appeared to be supported by the above clinical findings (Pham et al. 2003b).
The objectives of the present study were to determine the level of expression of the two markers (PKC-η and iNOS) and to determine the relative proportions of the different cell phenotype(s) expressing the two markers by using dual-labeling immunofluorescence and confocal laser scanning microscopy.
Materials and Methods
Patient Selection
Institutional Human Investigation Committee approval and patient consent were obtained prior to the initiation of this study. Blood samples were obtained from three groups: five healthy volunteers, five mild RA patients, and 10 severe RA patients. All RA patients satisfied the American College of Rheumatology criteria for this disease diagnosis (Arnett et al. 1988). The two RA groups were separated on the criteria that the mild RA group had less than five effused joints, whereas the severe RA group had more than 10 effused joints. Both RA groups had active disease, despite a variety of therapeutic interventions. Laboratory investigators were blinded with respect to disease status of the RA subjects until all laboratory work was completed.
Determination of Plasma NO (Nitrite + Nitrate)
Plasma NO was determined using a previously published method (Pham et al. 2003b). Briefly, plasma was treated using Escherichia coli nitrate reductase (Boehringer Mannheim, GmbH; Mannheim, Germany) to convert nitrate into nitrite after deproteination nitrite was determined using Griess reagent. Plasma nitrite levels were determined using a sodium nitrite standard curve. Results are shown in Figure 1. Statistical analysis was done using Graph Pad Instat software, and significance level was set at p=0.05.
Separation of PBM
All blood samples were collected in sodium EDTA anticoagulant collection tubes. Leukocyte separation was achieved using Ficoll-HyPaque (Amersham Biosciences AB; Uppsala, Sweden) with a modification to separate PBM. Leukocytes from the Ficoll-HyPaque separation were washed twice with PBS and resuspended in RPMI 1640 medium containing 1% fetal calf serum BRL (endotoxin screened). Cells (∼4 × 10⁵) suspended in 200 μl were pipetted into eight wells of a tissue culture chamber slide (Miles Laboratories; Etobicke, ON, Canada). Slides were incubated in a humidified 5% CO2 atmosphere at 37C overnight. Chambers were washed twice with PBS to remove non-adherent cells, leaving adherent cells that were 90% monocytes. Cells were fixed with ice-cold methanol for 15 min and stored at 4C.
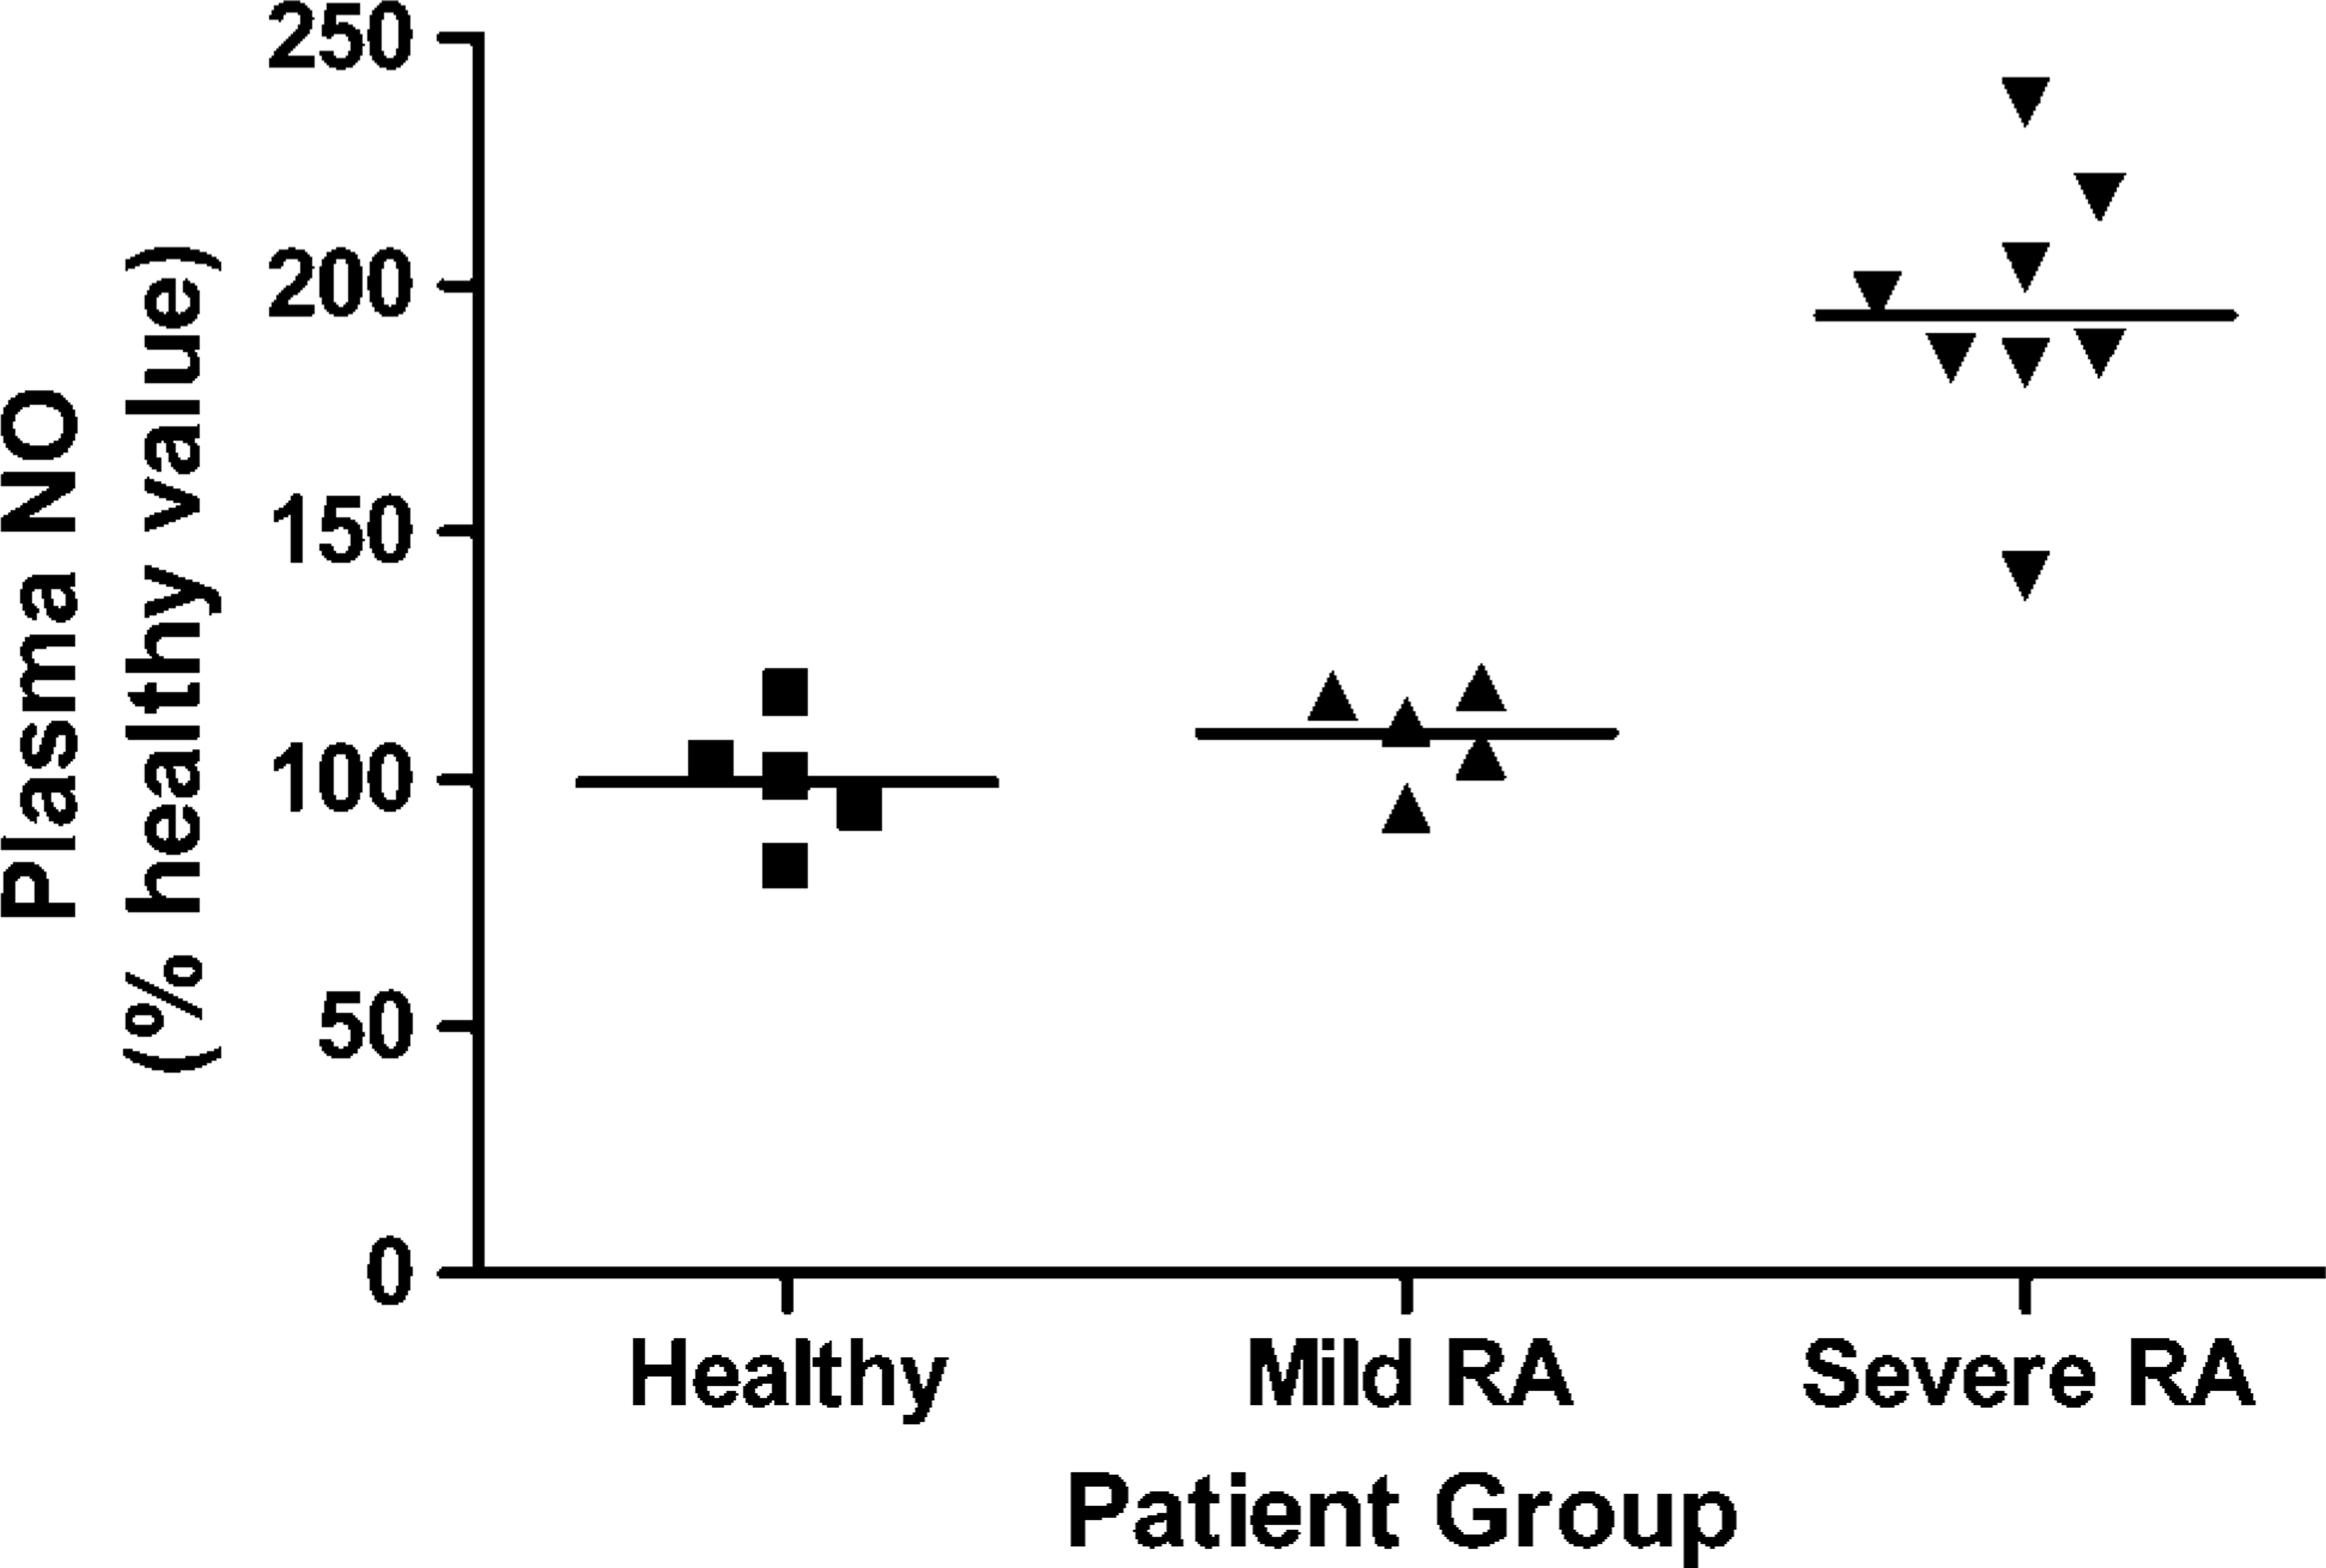
Plasma nitric oxide NO (nitrite + nitrate) levels in healthy, mild (RA), and severe RA groups. Statistical analysis is shown in the text.
Morphological Staining and Counting of Monocytes
Cells fixed as above were stained with a few drops of Wright's stain, allowed to stand for 2 min, and then followed by addition of two drops of resolving buffer (phosphate buffer, pH 6.8) and allowed to stand an additional 6 min to complete the staining process. Cells were then washed with tap water. One hundred cells were counted for each patient. These were observed at X400 magnification and grouped morphologically.
Immunofluorescent Staining Technique
An indirect dual-labeling immunofluorescent technique was used with two different primary antibodies and secondary antibodies labeled with two different fluorochromes. First, 200 μl of blocking buffer containing 5% mouse serum was added to each well and left overnight at 4C. Wells were washed twice with PBS, followed by addition of 200 μl of PBS containing a mixture of goat polyclonal anti-PKC-η (1:100) and rabbit polyclonal anti-iNOS (1:100). These were allowed to stand at room temperature for 6 hr. Both primary antibodies were obtained from Santa Cruz Biotechnology (Santa Cruz, CA; PKC-η cat. #sc-215-G, iNOS cat. #sc-650). Wells were washed three times with PBS and once with distilled water to remove unbound primary antibody. Then 200 μl of a mixture of secondary antibodies was added to each well. The mixture contained Cy2-conjugated donkey anti-rabbit (1:100) for the detection of iNOS and Texas Red-conjugated donkey anti-goat (1:100) for the detection of PKC-η. Both secondary antibodies were obtained from Jackson Immuno-Research Laboratories Inc. (West Grove, PA; cat. #711-225-152 and cat. #705-075-131, respectively). Chamber slides were left overnight at 4C. The following day, wells were washed five times with PBS to ensure removal of non-bound secondary antibody, and then slides were mounted using 9:1 glycerol/PBS mixture. To eliminate errors due to technical problems including autofluorescence, nonspecific antibody binding and possible cross-reactivity of antibodies, various methods, and specificity controls were performed. These controls included wells with no primary antibodies or no secondary antibodies, and also mixed antibodies to test for cross-reactivity of primary with secondary antibodies were done for both the specific antibodies and non-corresponding secondary antibody. All controls were done for healthy controls and each patient sample screened.
Confocal Laser Scanning Microscopy
Slides were examined using the blue argon laser (488 nm) and green HeNe laser (543 nm) of the Olympus Fluoview laser scanning equipment (FV300) connected to an Olympus upright microscope (BX50WI) at a total magnification of X400 and X600 (Olympus; Tokyo, Japan). All observations of the digital images at X400 were standardized with 100% laser intensity and PMT settings for Cy2 and Texas Red emissions at 517 and 679, respectively. Data from both laser images were obtained simultaneously. Estimation of phenotypes was done by randomly eye counting five fields of view. Double-negative cells were estimated from the same images that were adjusted for intensity to allow visualization of all cells.
Integrated Optical Density Measurement
To quantify the levels of expression of the two markers, integrated optical density (IOD) measurements were made from five separate random fields of view per patient sample. For each patient group there were 25 (healthy and mild RA) or 50 (severe RA) estimations of intensity for both markers. IOD scores were determined using Image Pro Plus software (Version 4.1; Media Cybernetics, Silver Spring, MD), and the comparative levels of PKC-η and iNOS expression were calculated per field of view. Mean and standard error of the mean values (n) of cell counts for each group were 250.5 ± 1.92 (25) 249.5 ± 1.40 (25), and 252.5 ± 1.04 (50) for healthy, mild RA, and severe RA, respectively. Cell counts were not significantly different, eliminating the necessity for corrections for variations in cell numbers.
Graphs were prepared using Graph Pad Prism 4.00 software, and statistical analyses were performed using InStat 3.05 software, using one-way ANOVA; p values 0.05 were considered significant.
Results
Details of Study Patients
Table 1 summarizes the clinical data. Healthy volunteers were not statistically aged matched with the two patient groups; however, none had any signs of inflammatory disease or were taking any anti-inflammatory medications. The normally accepted values for erythrocyte sedimentation (ESR) range from 0 to 9 mm/hr. All mild and severe RA patients, except patient 74, were well above this range, indicating the severity of the inflammatory disease in these two groups. As patients randomly volunteered in this study, they were all on a variety of medications including methotrexate (MTX), corticosteroids (prednisone), and various non-steroidal anti-inflammatory drugs (NSAIDs) or disease-modifying anti-rheumatoid drugs (DMARDs). Two mild RA patients (71 and 74) were being treated with anti-cytokine therapies.
Characteristics of study patients
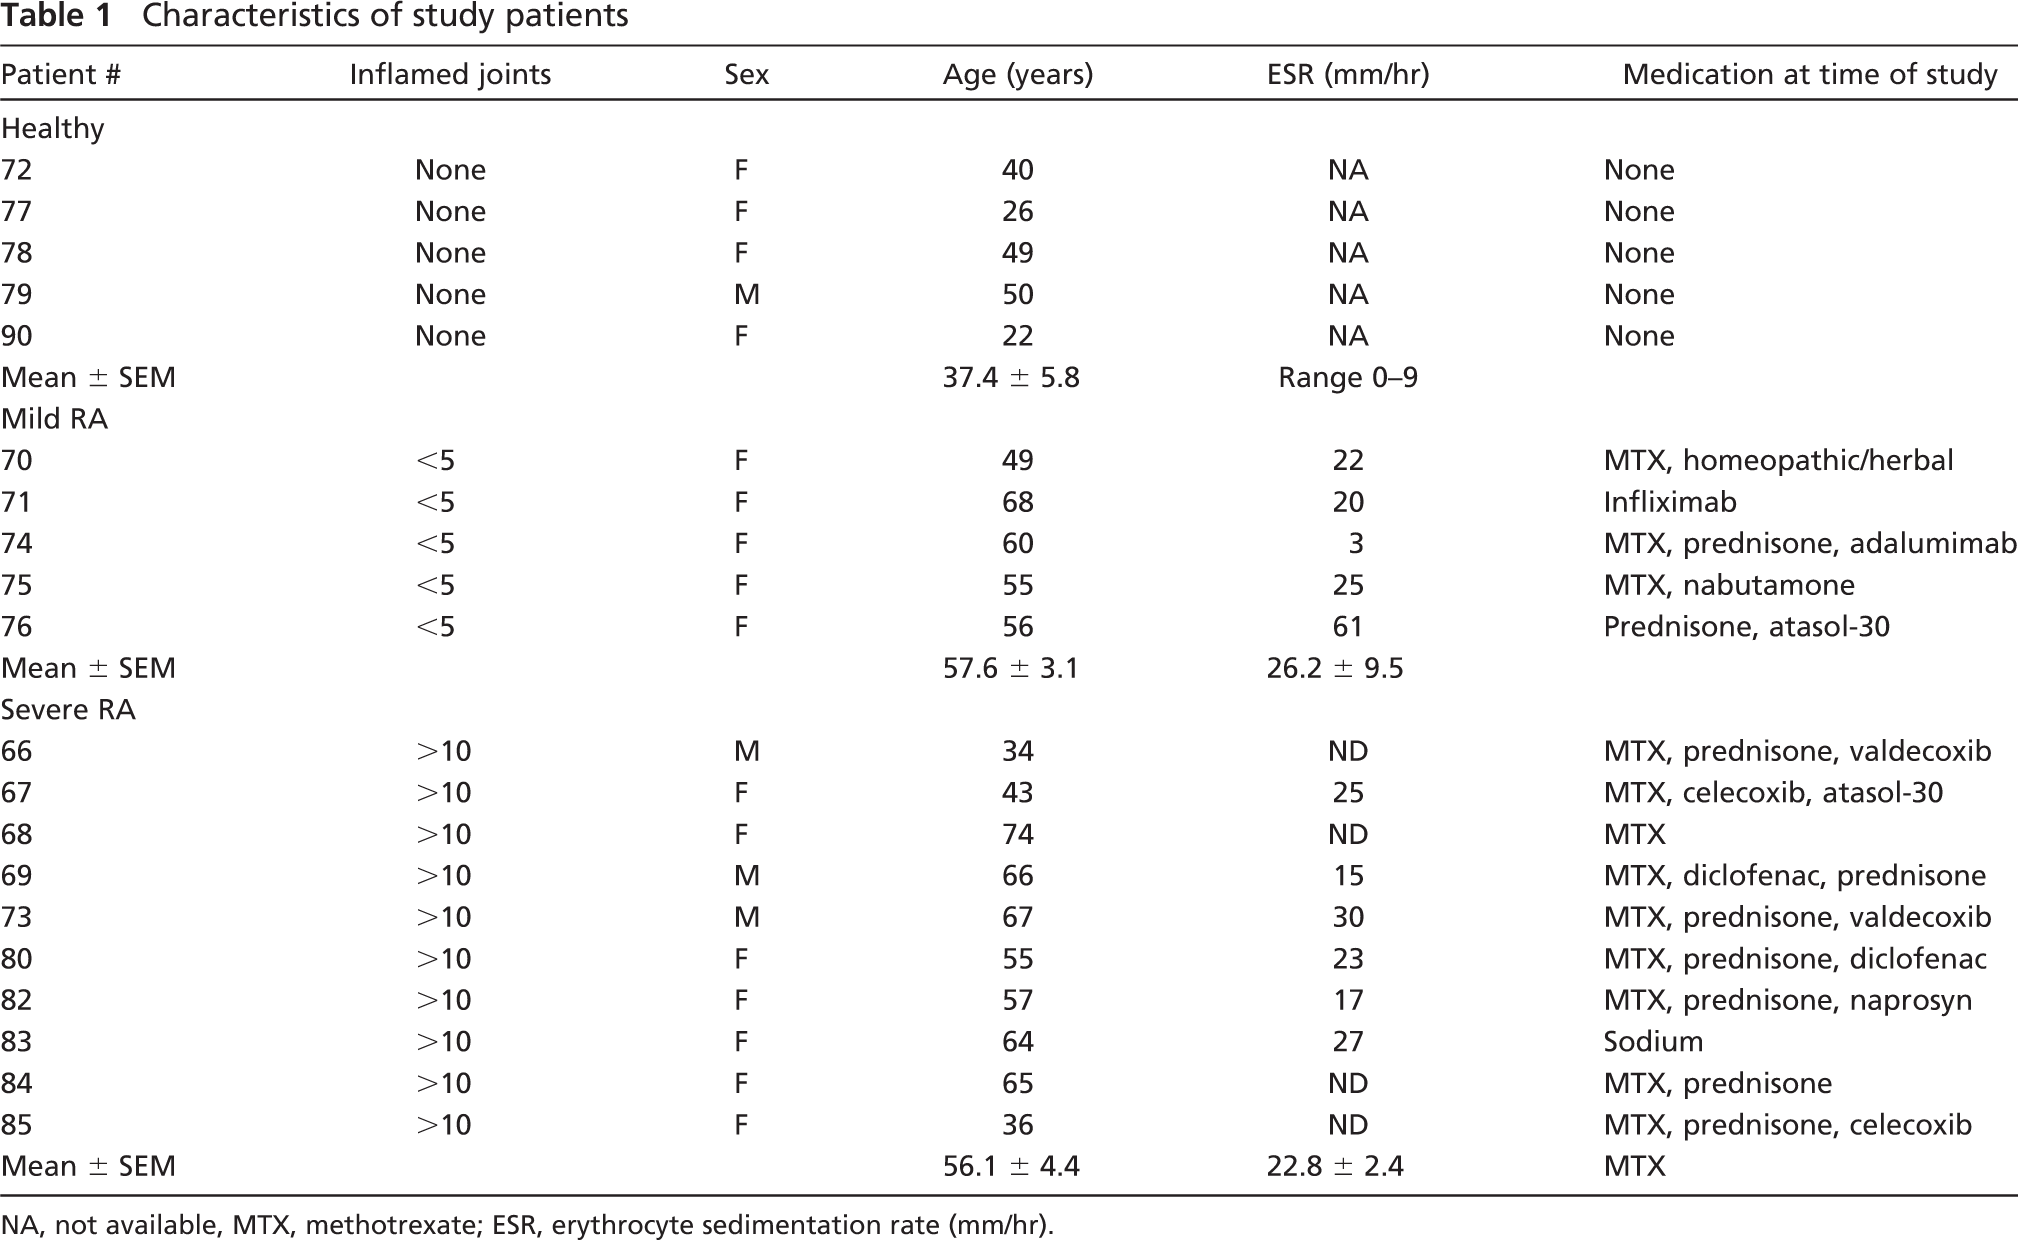
NA, not available, MTX, methotrexate; ESR, erythrocyte sedimentation rate (mm/hr).
Plasma NO Levels
Plasma NO (nitrite + nitrate) levels for healthy volunteers are shown in Figure 1. Mean and SEM values obtained were 128.34 ± 20.51, 135.44 ± 14.73, and 236.86 ± 34.35 for healthy, mild RA, and severe RA, respectively. These values were higher than previously published levels, but this may have been due to the fact that there was an unavoidable delay between collection and measurement of between 3 and 4 hr. One-way ANOVA of plasma NO levels gave the following p values: healthy vs mild RA, p>0.05 (not significant), healthy vs severe RA, p<0.001 (significant), and mild RA vs severe RA, p<0.001 (significant).
Monocyte Purity
Isolated leukocyte numbers were consistent for all samples tested with a mean ± SEM of 2.00 ± 0.44 × 10⁶ cells/ml. Percentages of adherent monocytes, as determined with Wright's stain, were also consistent with a mean ± SEM of 87.6 ± 3.0% of cells being monocytes and the remaining cells lymphocytes.
Immunofluorescence and Marker Expression
Results of the immunofluorescence studies showing the presence of the two markers, PKC-η and iNOS, are shown in Figure 2. Data confirmed that autofluorescence and background fluorescence were both within acceptable limits (Figures 2A and 2B). In addition, there was no cross-reactivity for either PKC-η or iNOS primary antibodies and their non-corresponding secondary antibody (Figures 2C and 2D, respectively). Emission wavelength interference was also within acceptable limits using Texas Red and Cy2 fluorochromes. Figures 2E-2G show the immunofluorescence staining of PBM from a representative healthy volunteer stained for PKC-η, iNOS, and an overlay of the two images, respectively, illustrating the cellular distribution and cellular phenotypes present. Figures 2H-2J show the immunofluorescence staining of PBM from a representative mild RA patient stained for PKC-η, iNOS, and an overlay of the two images, respectively. Figures 2K-2M show immunofluorescence staining of PBM from a representative severe RA patient stained for PKC-η, iNOS, and an overlay of the two images, respectively. It was easily determined, from image overlays, if cells contained either or both of the two markers by counting the cells stained red or green and, in the case of concordant expression, cells that appeared yellow. Results show the absence of staining for either of the two markers in the healthy volunteers, the presence of staining for PKC-η in the mild RA patient group, and staining for both markers in the severe RA patient group. Figures 2N-2P are higher magnification images of cells from a severe RA patient showing PKC-η, iNOS, and a combination of these two markers. They are not views of the same cell but do show the relative cellular distribution of the markers and, in Figure 2P, the variations in distribution between them. Both markers appeared to localize within the cellular cytoplasm (Figures 2N and 2O). In Figure 2P it appears that iNOS differs from PKC-η in that it concentrates much more in oval vesicle-like structures within the cell cytoplasm, and these appear more abundant close to the cell surface.
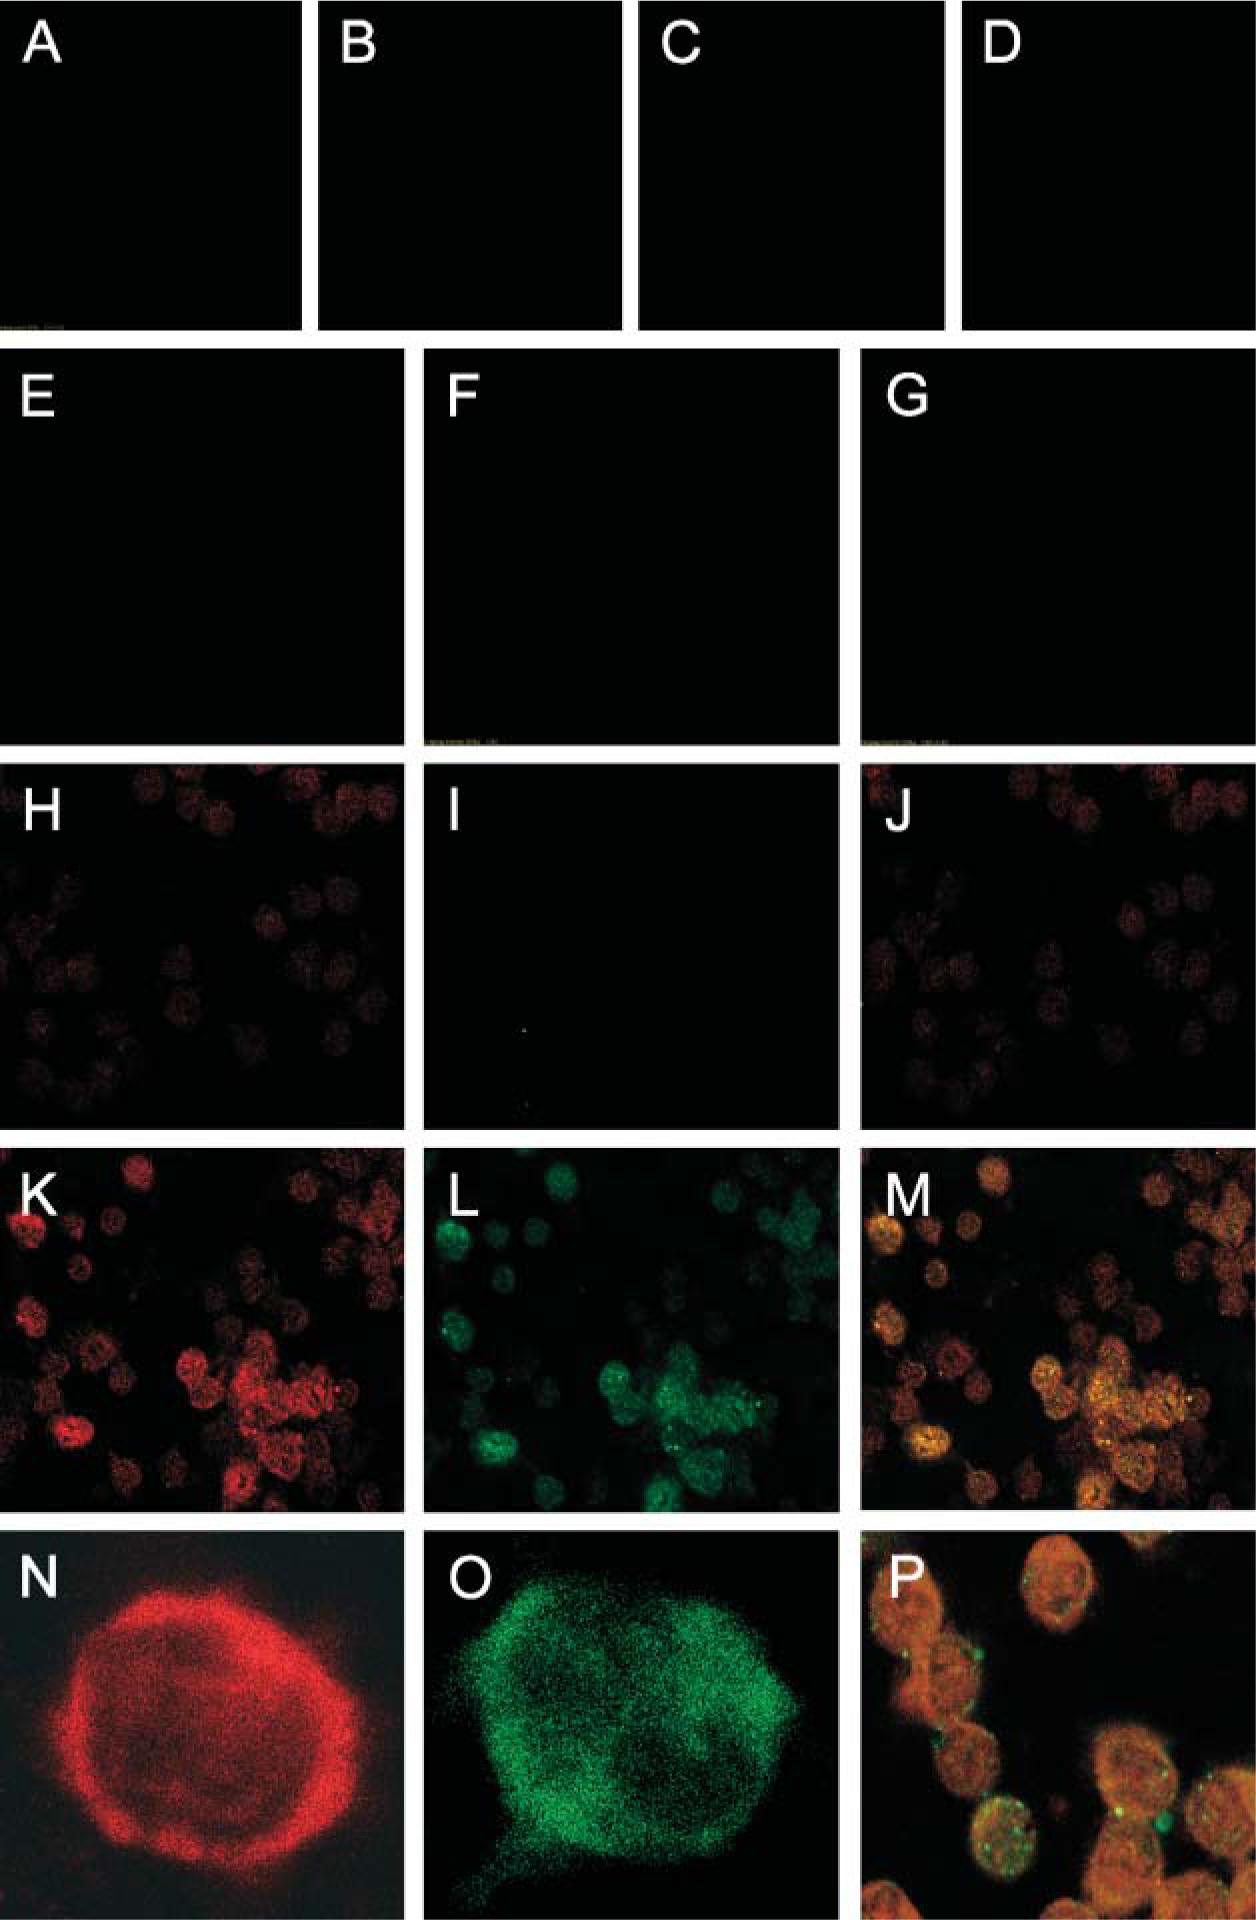
Representative fluorescence micrographs of peripheral blood monocytes (PBM). Method and specificity controls:
Monocyte Phenotype Expression
Figure 3 illustrates the relative proportions of the various cell phenotypes found in the three patient groups. The healthy group was found to contain cells with only one cell phenotype, being negative for both cell markers. The mild RA group, however, contained cells with three phenotypes consisting of 58% (patient-to-patient range, 29-71%) of cells that were negative for both markers; these were phenotypically PKCη-/iNOS-. The second most abundant cell phenotype in this group was PKCη+/iNOS-, which was found in 40.6% (patient-to-patient range, 29-70%) of cells. The least abundant cell phenotype was 2.5% (patient-to-patient range, 1-4%) of cells that were PKCη+/iNOS+. The severe RA group, by contrast, had only two cell phenotypes present, consisting of 62% (patient-to-patient range, 52-71%) of monocytes that were PKCη+/iNOS-, and 38% (patient-to-patient range, 29-48%) of monocytes that were PKCη+/iNOS+. Thus, in the severe RA group all monocytes were PKCη+. No cells in any of the three patient groups were observed to be of the phenotype PKCη-/iNOS+. One-way ANOVA for PKC-η gave the following values: healthy vs mild RA, p<0.001 (significant), healthy vs severe, p<0.001 (significant), mild RA vs severe RA, p<0.01 (significant). One way ANOVA for iNOS gave the following values: healthy vs mild RA, p>0.05 (not significant), healthy vs severe RA, p<0.001 (significant), mild RA vs severe RA, p<0.001 (significant).
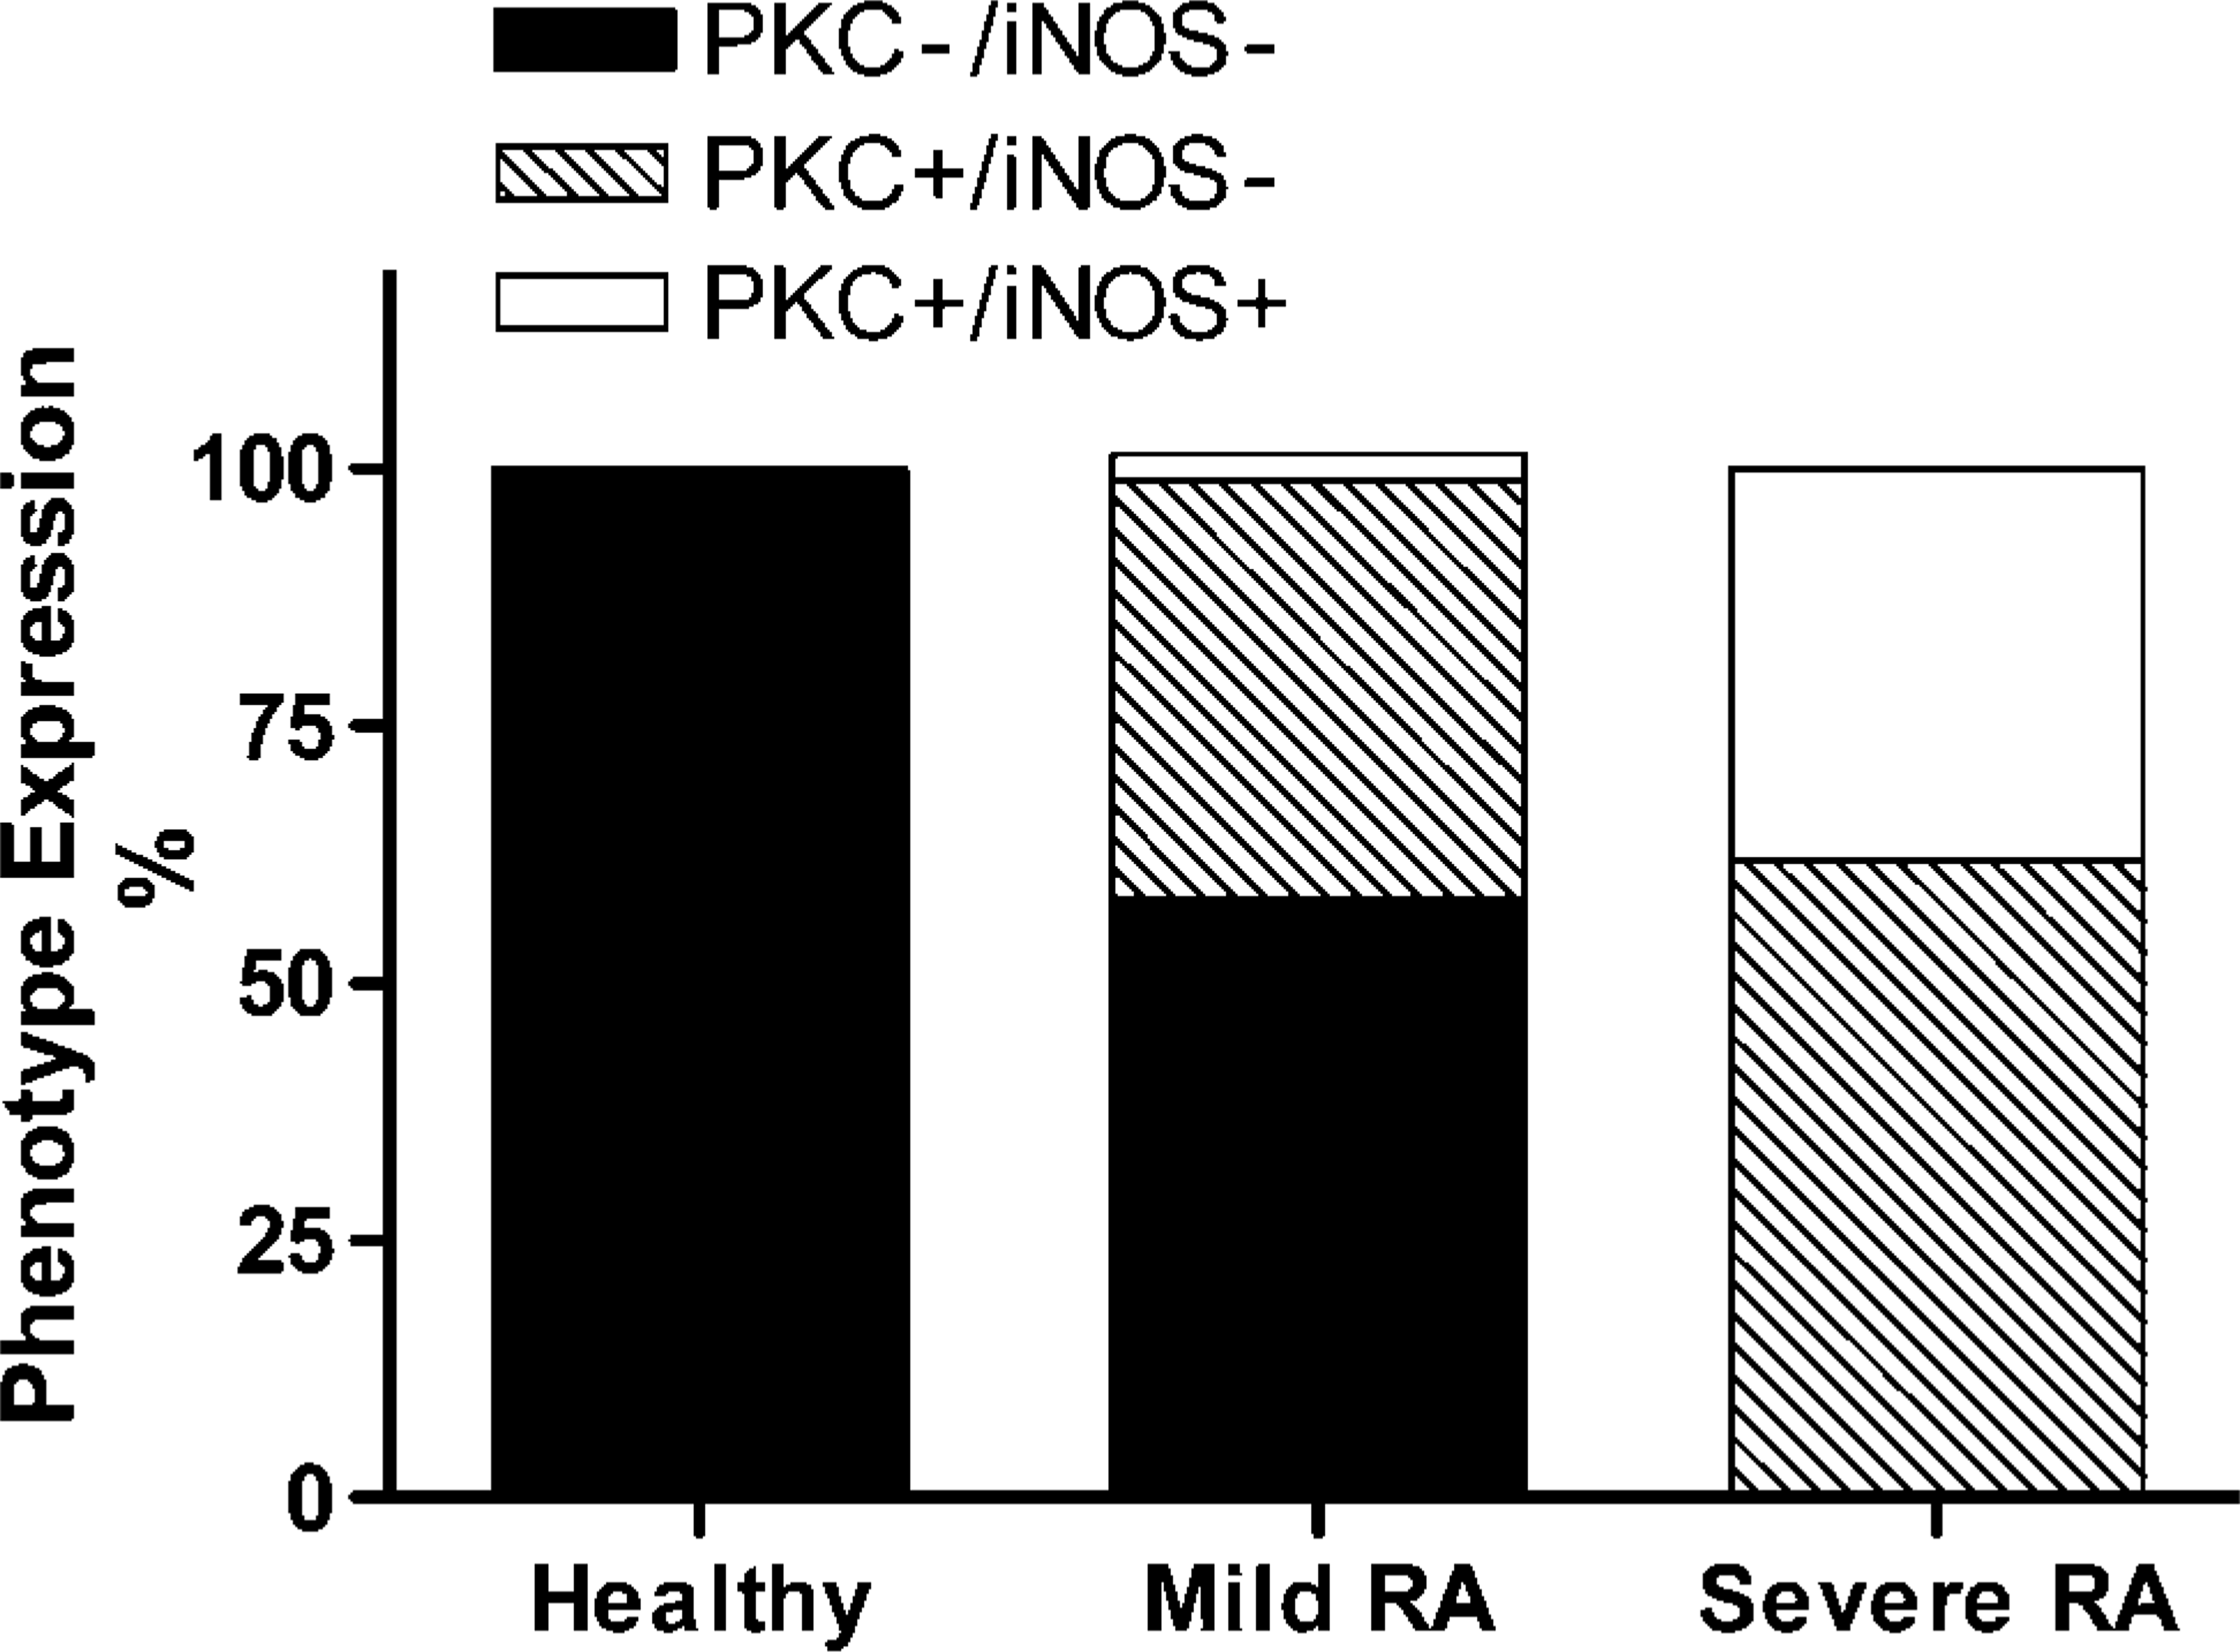
Proportions of PBM cell phenotypes in healthy, mild RA, and severe RA groups.
IOD
Results of the quantification of the levels of expression of the two markers using IOD measurements are demonstrated in Figure 4. Level of expression of the two markers was shown to increase significantly as the disease progressed from healthy to mild RA and then to severe RA (Figure 4). In the healthy controls, IOD readings for PKC-η and iNOS were low, with values of 593 ± 214 and 118 ± 41, respectively. This was taken to be the background level. As the disease progressed into mild RA and then into severe RA, PKC-η appeared to be the earliest marker to show enhanced expression and was also the most highly expressed marker with an IOD of 113,364 ± 6931 in mild RA, increasing to 161,603 ± 20,942 in severe RA. In contrast, iNOS was hardly detectable in mild RA patients, with an IOD of only 4530 ± 1060, but this level increased greatly to 89,886 ± 13,973 in severe RA patients. IOD measurements appeared to be more sensitive than visual examination of the cells. One-way ANOVA for PKC-η gave the following: healthy vs mild RA, p<0.01 (significant), healthy vs severe RA, p<0.001 (significant), mild RA vs severe RA, p<0.05 (significant). One-way ANOVA for iNOS gave the following: healthy vs mild RA, p>0.05 (not significant), healthy vs severe RA, p<0.001 (significant), mild RA vs severe RA, p<0.001 (significant).
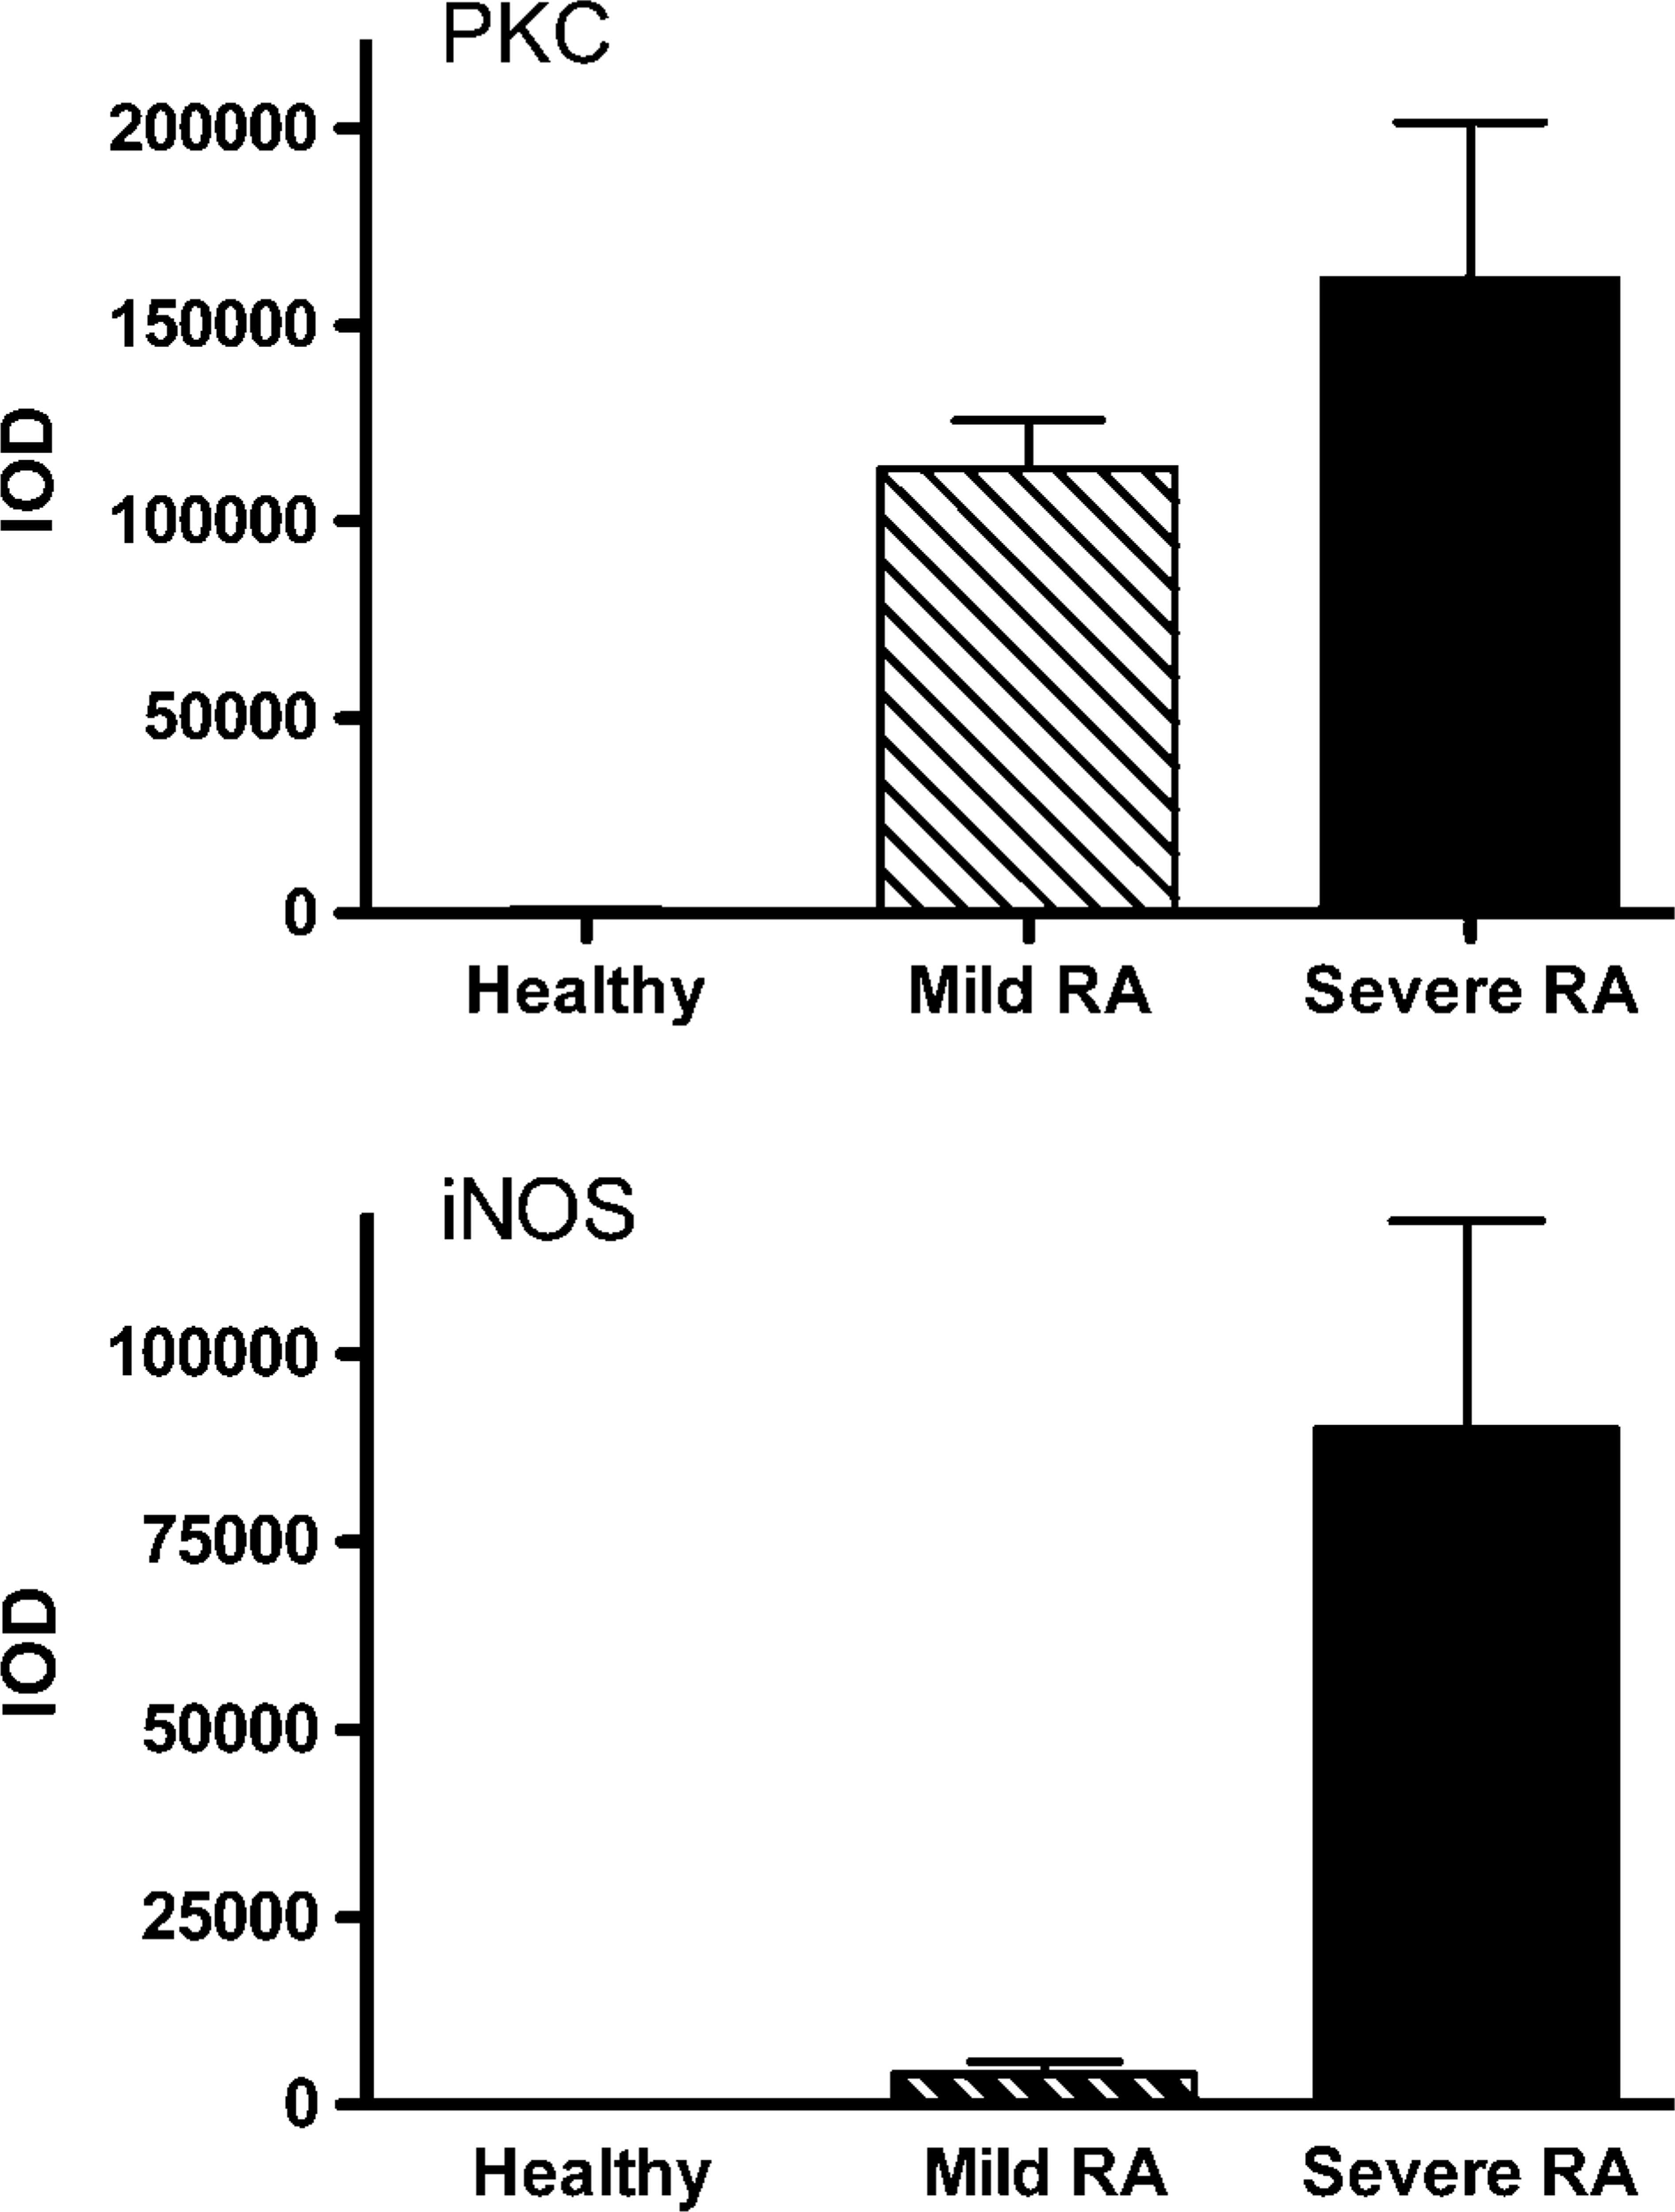
Mean integrated optical density (IOD) readings in healthy, mild RA, and severe RA groups. Expression of (top) PKC-η and (bottom) iNOS. Bars are means ± SEM, n=5 (healthy and mild RA), n=10 (severe RA). Statistical analysis is shown in the text.
Correlation of Expression of the Two Markers
Figure 5 shows the correlation between paired mean values for each of the 20 subjects studied. The log/log graph compares mean IOD values recorded and, thus, the level of marker expression by the PBM from the various patient groups. Linear analysis of the data revealed a Pearson r value of 0.8710 (r 2 = 0.7586) and a p value of 0.001 (significant).
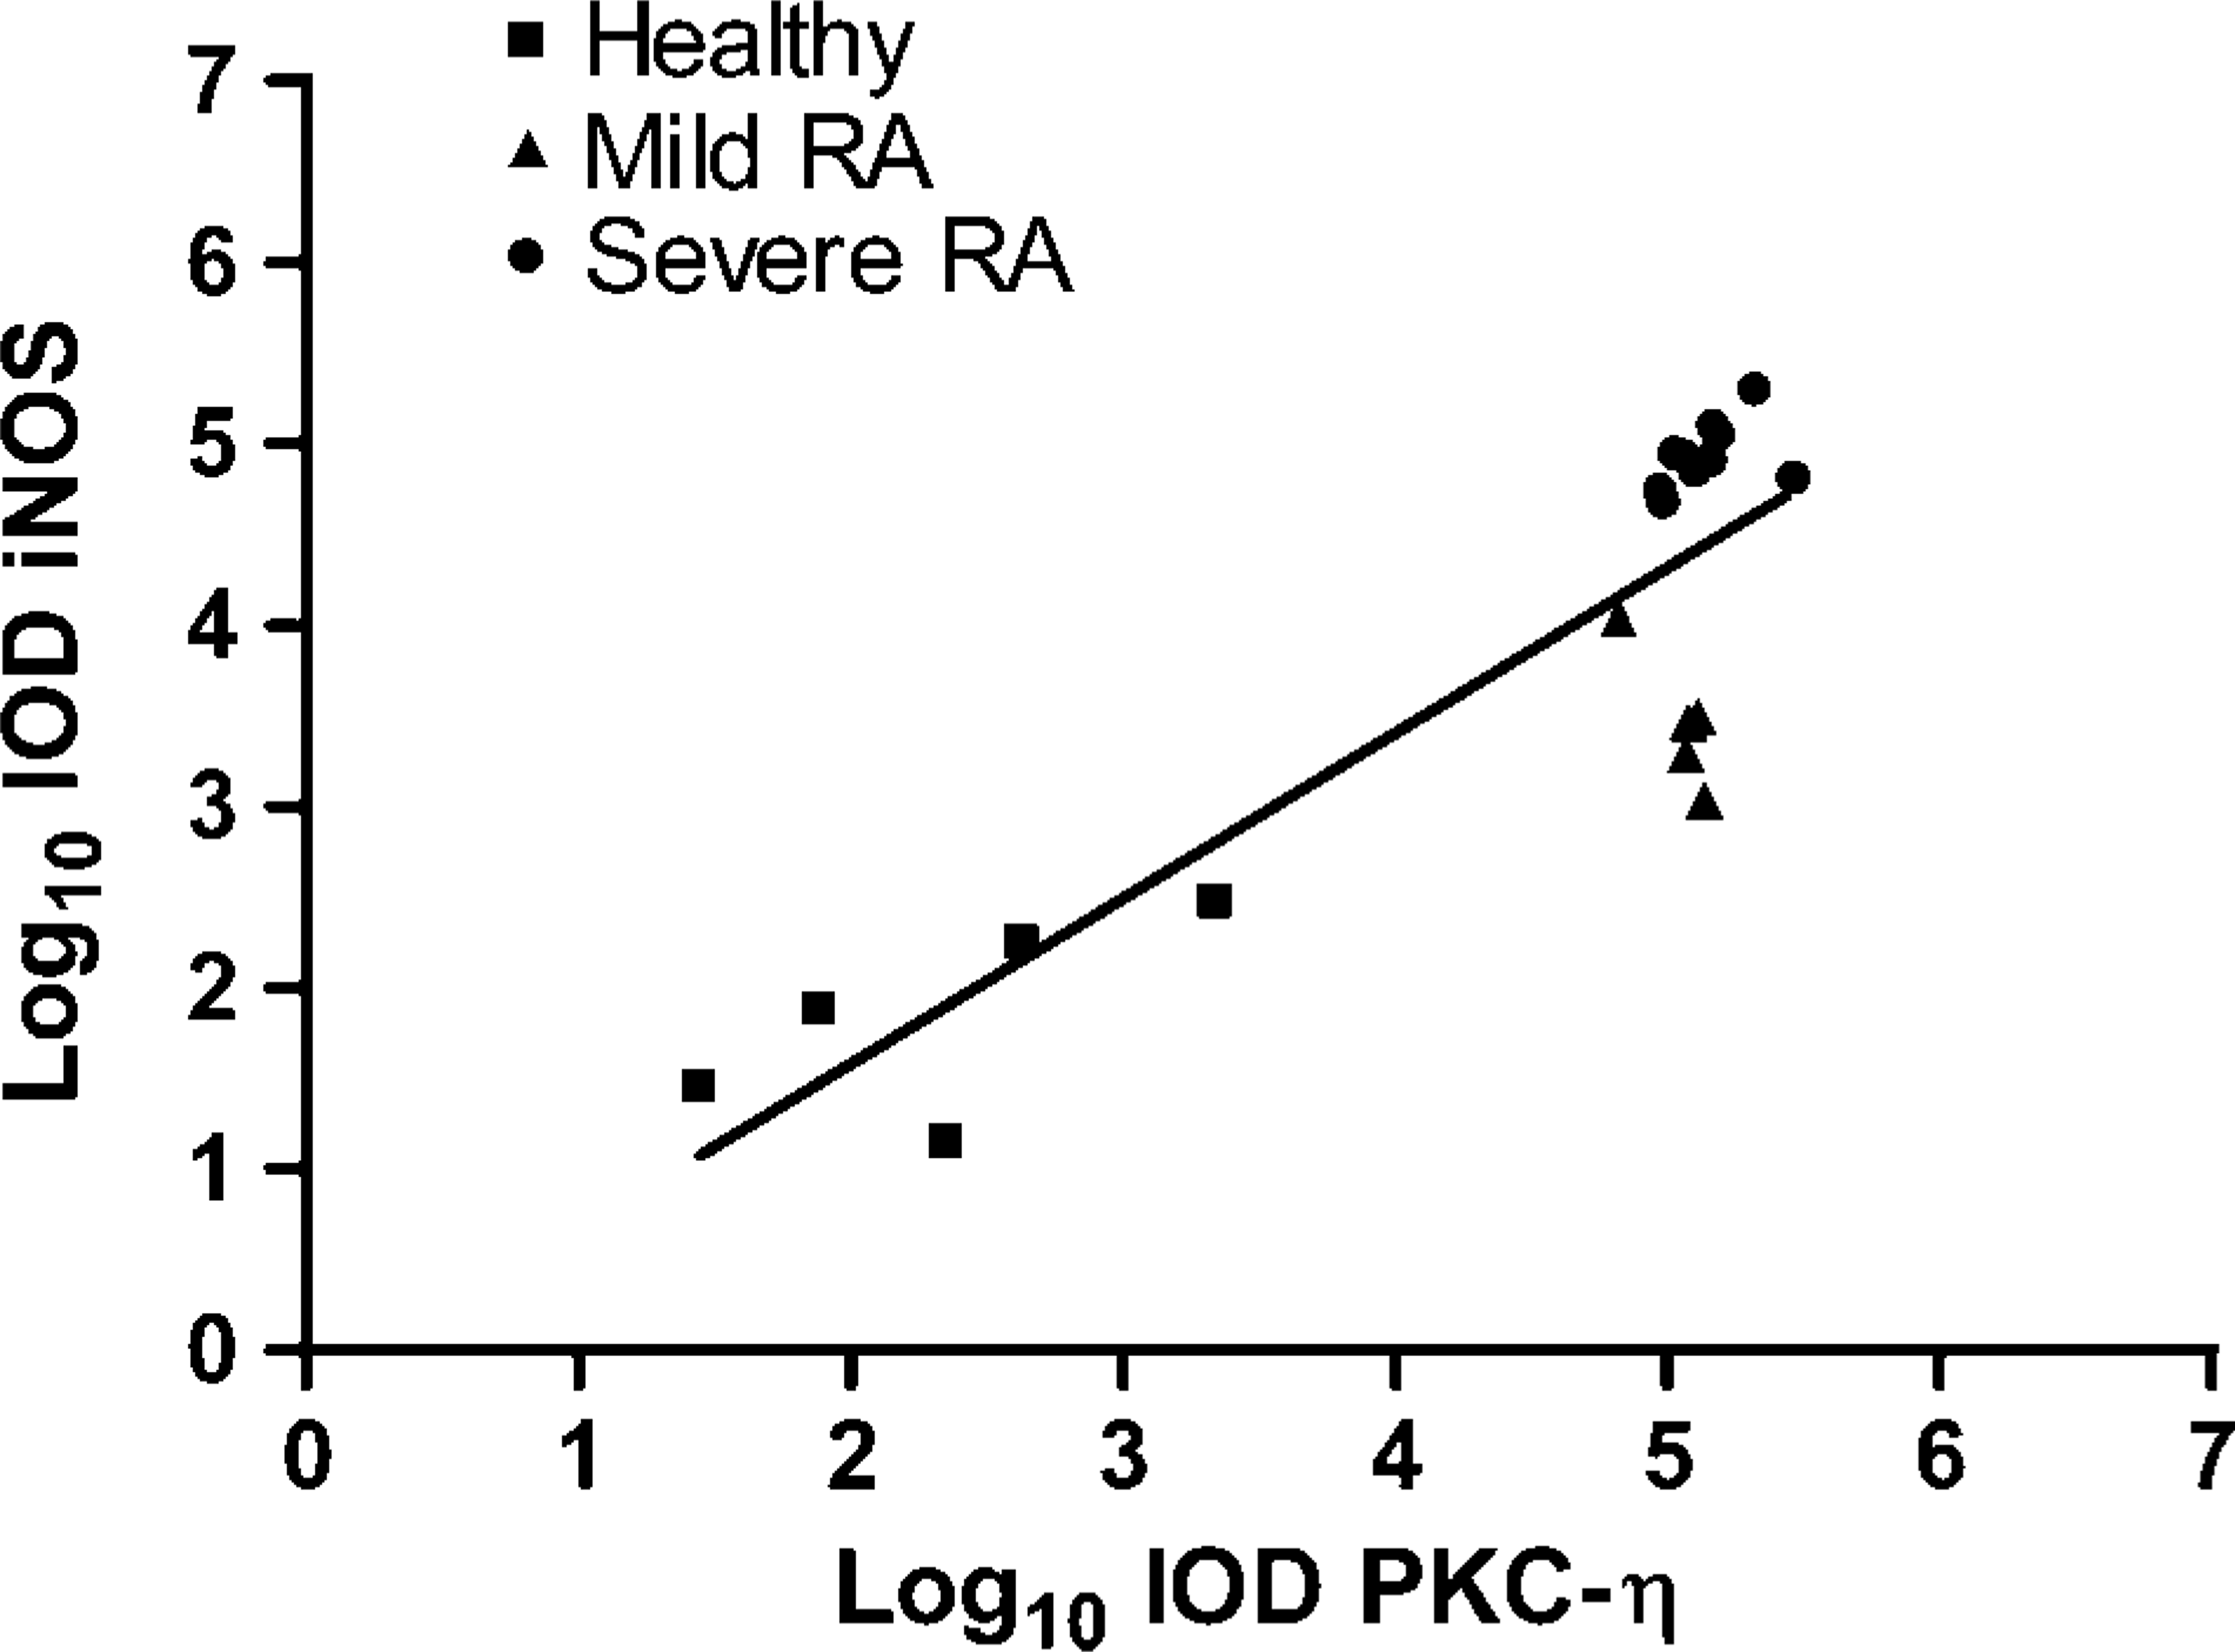
Correlation of PKC-η and iNOS expression by PBM. Log/log plot of 20 paired mean values for IOD of PKC-η vs IOD iNOS for individuals in the healthy, mild RA, and severe RA groups.
Discussion
Our data clearly show the early disease appearance and a progressive increase in numbers of cells expressing PKC-η from patients with RA when compared with healthy volunteers. This progressive increase in marker-positive cells was also significantly influenced by the severity of the disease, being highest in patients with severe RA. Data also show the later appearance of iNOS in RA patients with severe disease. The increase in both markers measured was also associated with an elevation in the density of expression of the two markers, as indicated by IOD measurements. PKC-η was highly expressed early in the disease progression, whereas iNOS was found in relatively low amounts until late in the disease progression. It would be of interest to know how early in the development of the disease PKC-η first appears in PBM, and if patients were PKC-η positive at first diagnosis. Early detection of PKC-η may indicate an early inflammatory state. Ideally, a sequential study following patients through their disease progression would be of interest to also confirm the sequential nature of these phenotypical changes.
The appearance of these markers in PBM has not yet been reported to have any link to prognosis or therapeutic effectiveness of any medications. However, we have reported expression of PKC-η also in patients with psoriatic arthritis and ankylosing spondylitis (Pham et al. 2003b), and it may also be that they are associated with a number of other inflammatory diseases. Elevated iNOS, associated with severe RA, was also accompanied by elevated levels of plasma NO. Although we have no direct evidence that iNOS was the only source of the NO produced, it obviously must have contributed to this.
PBM phenotypes shown in Figure 3 provide additional information to data from earlier studies using RT-PCR. We now see that there are a number of macrophage phenotypes present, their comparative proportions, and how these vary with disease severity. In severe RA, all cells were positive for PKC-η, and 38% of cells expressed iNOS. From both mild and severe RA data it may be seen that iNOS is found only in cells concordantly expressing PKC-η. Interestingly, there were no cells expressing the iNOS-only phenotype. These data further support the possible switching of PBM phenotype during the progression of the disease from mild to severe RA.
Level of expression of the two markers as shown by IOD measurements (Figure 4) shows a progressive increase in expression of both markers that is clearly associated with disease severity. Thus, it would appear that RA subjects with low iNOS all have mild RA, as compared with high iNOS producers who appear to have a severe RA phenotype. We do acknowledge, however, that a prospective rather than cross-sectional study is required to be absolutely confident regarding a cause and effect and the sequential or concomitant nature of these observations.
If we now look at the level of expression of the two markers, we can see in Figure 5 that there is a very strong correlation between them, suggesting that both are linked, and further supporting the possibility that PKC-η does possibly influence the development of the iNOS phenotype.
Figure 6 illustrates two possible routes to explain the phenotypical development of PBM in RA. Observations from our study indicate that expression of iNOS appeared to take place only in cells that were also positive for PKC-η, and that iNOS was never found alone in PBM isolated from any of the subjects studied. The appearance of the two markers was progressive and then concordant. All these observations support the hypothesis that PKC-η may be required for iNOS induction in human PBM. These observations, therefore, support the phenotypical development illustrated in Figure 6(Scheme 1) with the appearance first of a PKC-η-expressing phenotype followed a phenotype expressing both markers (PKCη+/iNOS+) in patients with severe RA. Figure 6(Scheme 2) would also require the presence of two distinct phenotypes: one expressing only PKC-η and the other expressing only iNOS. The latter was never clearly observed in any of the patients studied.
Changes in monocyte phenotype leading to the production of large quantities of NO are vitally important in protecting us from infectious diseases, particularly from those that are caused by intracellular microorganisms (Arias et al. 1997). The connection between this and inflammatory autoimmune diseases such as RA and psoriatic arthritis has not been established, but some of these infectious diseases do show similar cytokine profiles and sometimes rheumatoid-like disease symptoms (Guerau-de-Arellano and Huber 2002; Kerr et al. 2004; Veale et al. 2005).
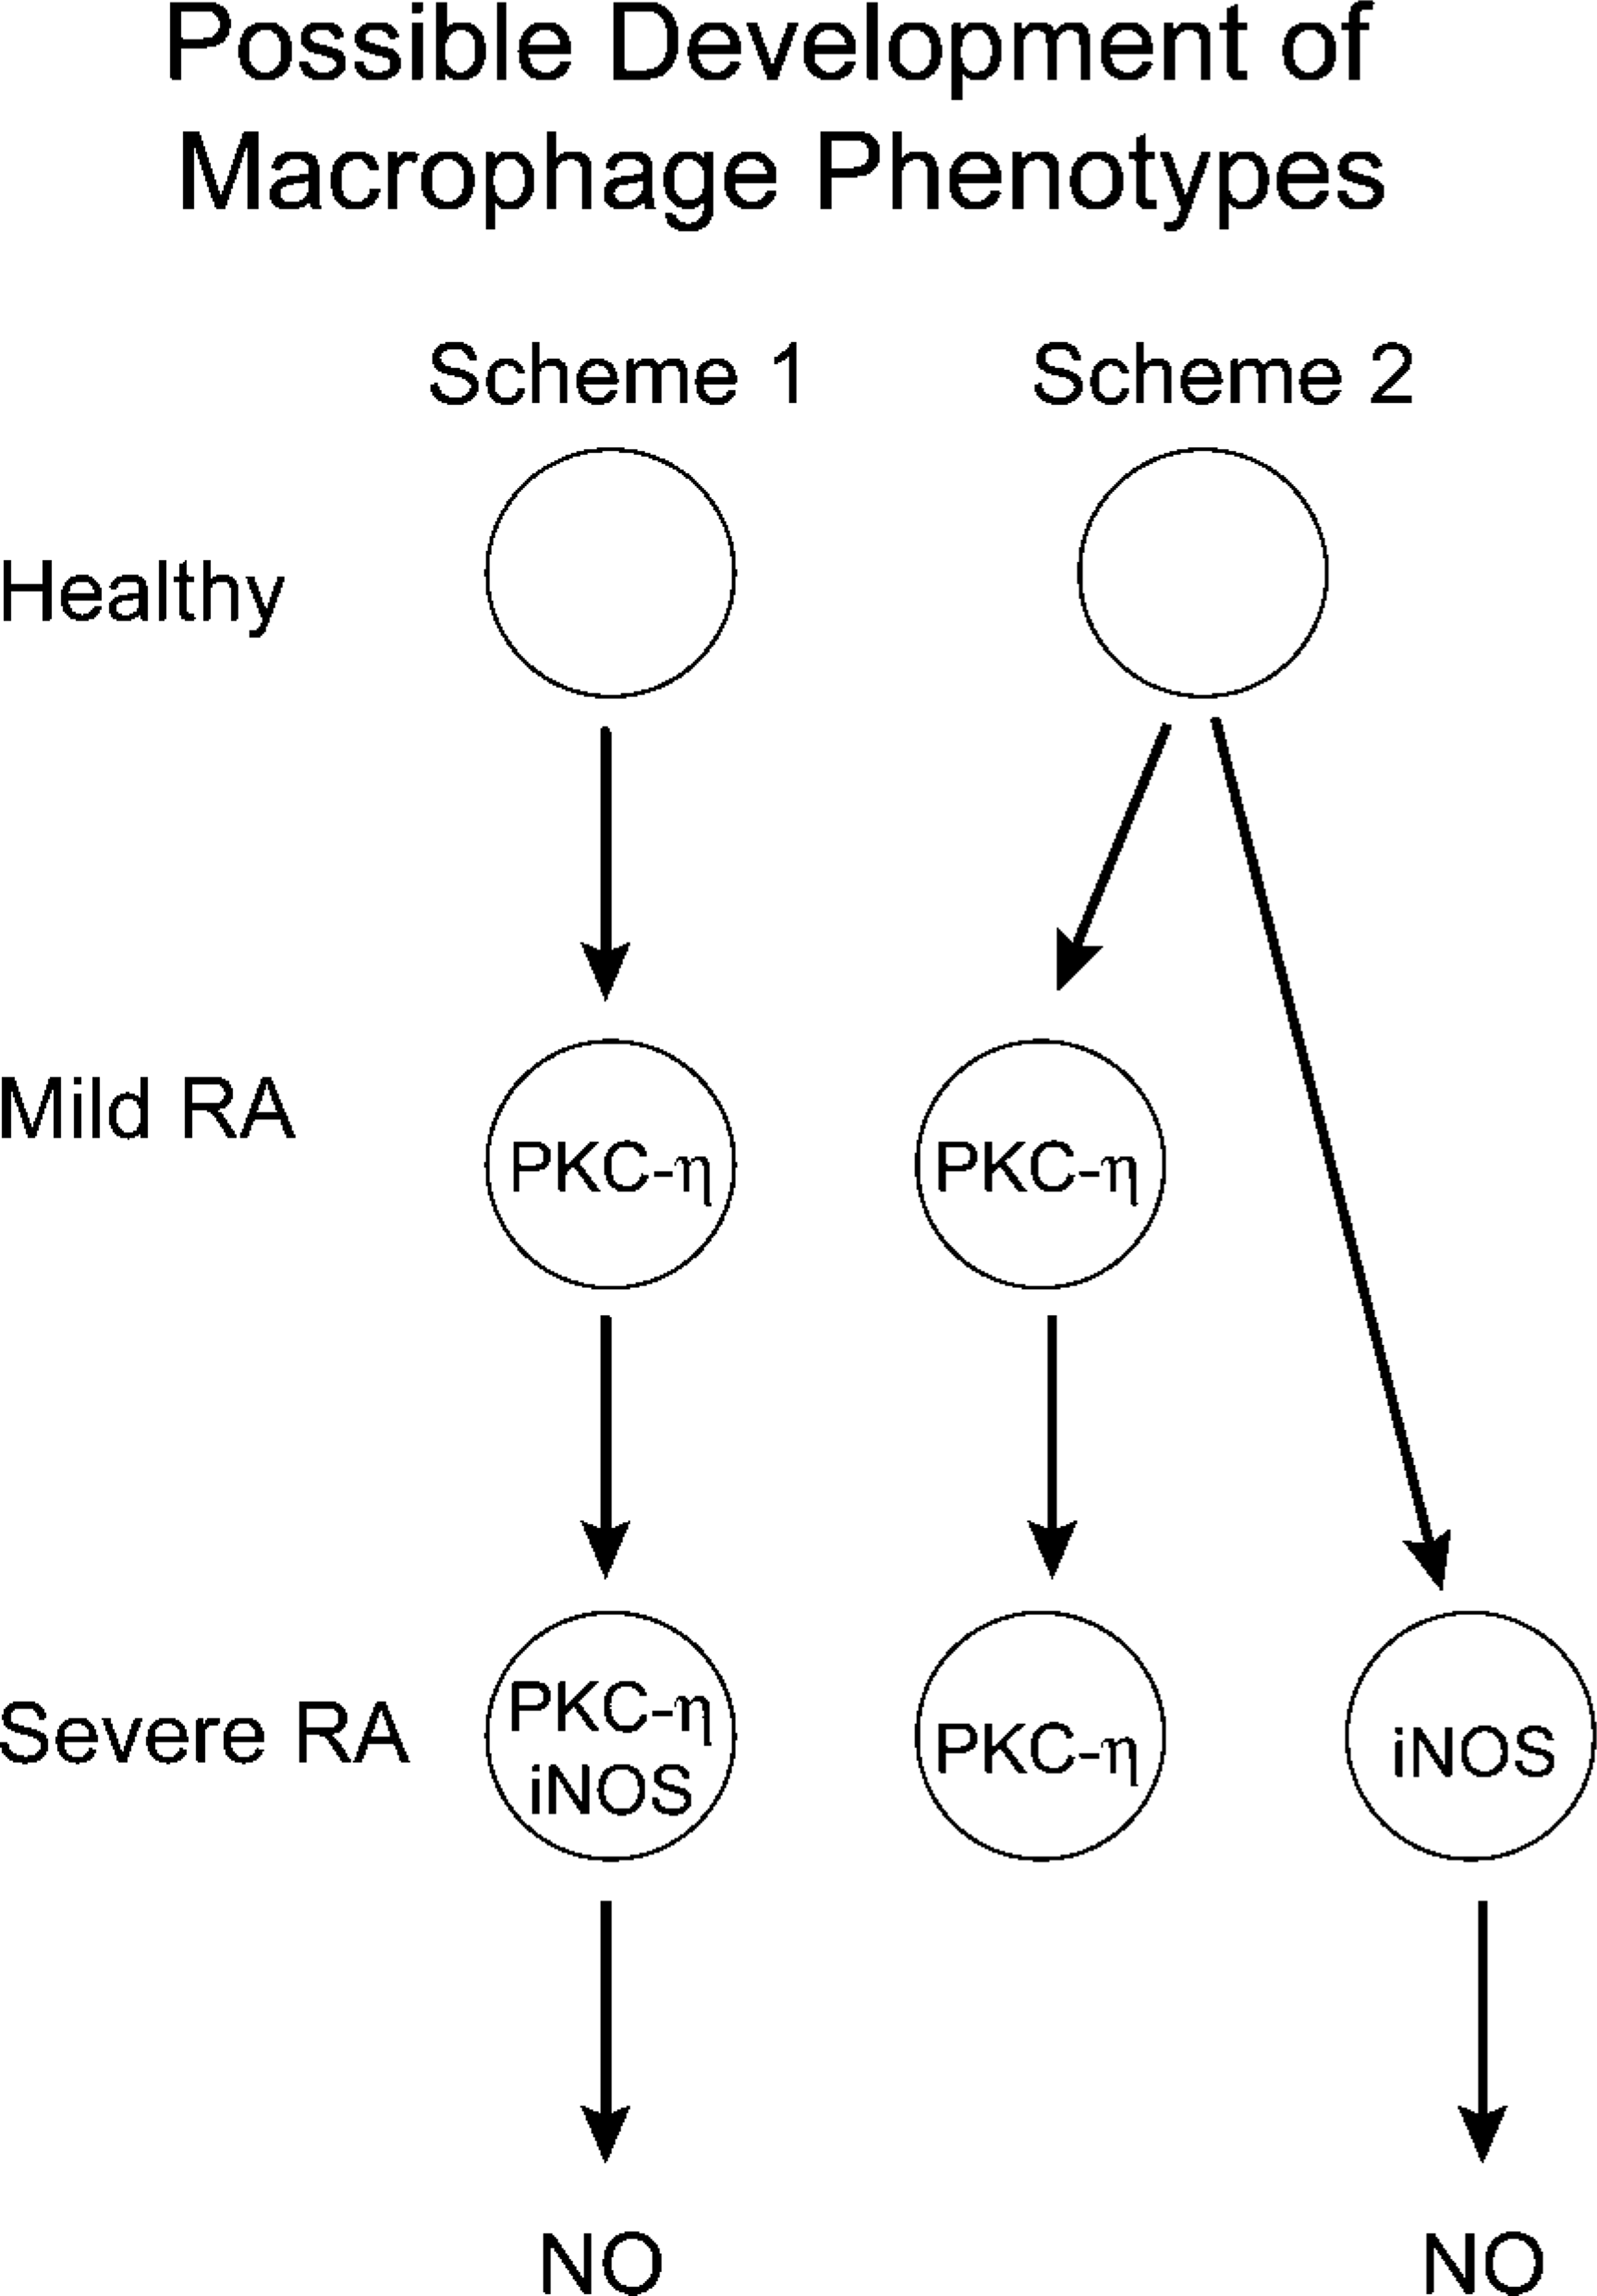
Hypothesized schemes for the development of macrophage phenotypes observed.
If our hypothesis is correct and there is a link between PKC-η expression and the appearance of iNOS in human monocytes, then it may be possible to delay or prevent the phenotypical changes taking place by using specific PKC-η inhibitors. This would be an interesting means of testing the hypothesis if only there were more highly specific inhibitors on the market to actually use clinically to test this.
Conventional therapies for the treatment of RA (prednisone, DMARDs, and NSAIDs) did not appear to have any effect on the monocyte phenotypical changes leading to iNOS expression and NO production in this study. Assuming that the stages hypothesized for the phenotypical differentiation of monocytes were distinct and clear, it may be possible to investigate the conditions under which the phenotypical changes might occur. Obviously there are systemic changes occurring during disease progression that lead to the appearance of iNOS and elevation of plasma NO. It is very probable that the phenotypical changes observed in PBM may be related to the type or levels of proinflammatory cytokines released by cells and tissues of the body during disease progression. It may therefore be possible to delay or even prevent the phenotypical switching by using anti-cytokine therapies. Work to this end has already been initiated in this laboratory. Preliminary results indicate that the above hypothesis may possibly be correct. It will be of great interest to observe the effects that various anti-cytokine therapies may have on the two markers and NO production in these patients, and if these reduce cardiovascular problems and prevent hypotension developing in these patients.
Footnotes
Acknowledgements
Funding was provided by the Faculty of Medicine, Memorial University of Newfoundland and Rheumatology Research, St Clare's Mercy Hospital, St John's, NL.
The authors thank Maureen Gallant, Karen Stapleton, and Michael Goldsworthy for technical assistance, and a special thanks to Yvonne Tobin for keeping track of patients and volunteers used in this study.