
Abstract
Carcinoma tissue consists of not only tumor cells but also fibroblasts, endothelial cells or vascular structures, and inflammatory cells forming the supportive tumor stroma. Therefore, the spatial distribution of proteins that promote growth and proliferation in these complex functional units is of high interest. Matrix-assisted laser desorption/ionization imaging mass spectrometry is a newly developed technique that generates spatially resolved profiles of protein signals directly from thin tissue sections. Surface-enhanced laser desorption/ionization mass spectrometry (MS)combined with tissue microdissection allows analysis of defined parts of the tissue with a higher sensitivity and a broader mass range. Nevertheless, both MS-based techniques have a limited spatial resolution. IHC is a technique that allows a resolution down to the subcellular level. However, the detection and measurement of a specific protein expression level is possible only by semiquantitative methods. Moreover, prior knowledge about the identity of the proteins of interest is necessary. In this study, we combined all three techniques to gain highest spatial resolution, sensitivity, and quantitative information. We used frozen tissue from head and neck tumors and chose two exemplary proteins (HNP1–3 and S100A8) to highlight the advantages and disadvantages of each technique. It could be shown that the combination of these three techniques results in congruent but also synergetic data.
T
The workhorse in the localization of proteins in tissue is the IHC that allows a subcellular spatial resolution. But here a prior knowledge of the identity of the proteins of interest is a prerequisite. Furthermore, a limiting fact is that proper antibodies are not available for all proteins. Matrix-assisted laser desorption/ionization (MALDI) imaging mass spectrometry (IMS) is a new technique that generates molecular profiles of proteins directly from thin tissue sections (Chaurand et al. 2004). Therefore, with IMS it is possible to determine the distribution of hundreds of unknown compounds with a single measurement while maintaining the cellular and molecular integrity within the tissue. Single mass spectra across the whole tissue can be generated now with a resolution of up to 10 μm. Each molecular signal can be displayed pseudo-colored according to the concentration, or combined signals can characterize different functional areas. Limitation of this technique is the sensitivity, which is drastically decreased for proteins with a molecular mass higher than 15 kDa (Melle et al. 2009). Low-abundant proteins that are expressed at a few hundred copies per cell will not be detectable (Seeley and Caprioli 2008).
Surface-enhanced laser desorption/ionization time of flight mass spectrometry (SELDI-TOF-MS) using affinity chromatographic surfaces offers the highest sensitivity, but with low mass resolution. It is a commonly used tool to investigate differentially expressed proteins in body fluids, cells, and tissue (Paradis et al. 2005; Escher et al. 2006; Ward et al. 2006; von Eggeling et al. 2007). In general, SELDI is useful to compare crude protein lysates with a high sensitivity. Therefore, SELDI was successfully combined with tissue microdissection in several studies. About 3000 cells are needed to receive an adequate proteomic profile (Melle et al. 2004,2008). In a recent study, we developed the technique of tissue on chip–based MS (toc-MS), in which microdissected tissue is directly transferred to protein arrays and analyzed by SELDI (Escher et al. 2010). Here, only a few hundred stromal cells result in adequate quantifiable spectra.
In the present study, we compared all three imaging attempts using tissue from head and neck tumors. Two exemplary proteins (HNP1–3 and S100A8) found by each technique were analyzed to highlight spatial resolution, sensitivity, and quantification.
Materials and Methods
Patients' Samples
All head and neck tumor samples were obtained after surgical resection at the Department of Otorhinolaryngology of the University Hospital Jena (Jena, Germany). They were collected fresh, snap-frozen in liquid nitrogen, and stored at −80C. Tumor specimens were categorized according to the WHO classification (Sobin et al. 2009). Ethical approval was obtained from the local Ethics Committee.
MALDI Imaging Analysis
Cryosections of 10 μm were prepared and transferred to a precooled conductive indium–tin-oxide–coated glass slide. The sections were briefly washed two times for 30 sec in 70% ethanol and one time for 20 sec in 100% ethanol and dried in a vacuum desiccator. The matrix [sinapinic acid at 10 mg/ml in 60% acetonitrile and 40% water with 0.2% trifluoroacetic acid (TEA)] was applied using the ImagePrep station (Bruker Daltonik GmbH; Bremen, Germany) following a standard protocol. Mass spectra were acquired on a MALDI–TOF/TOF (Ultraflex III TOF/TOF; Bruker Daltonik GmbH) equipped with a 200-Hz smartbeam laser. The MALDI measurements were performed in linear mode in a mass range of 1000–30,000 Da with a sampling rate of 0.10 GS/sec. The lateral resolution for the MALDI imaging was set to 50 μm. A total of 300 laser shots were summarized per position. The acquisition and evaluation were carried out using the flexImaging 2.1 software (Bruker Daltonik GmbH).
After the MALDI–IMS analysis, the matrix was washed off the slides with 70% ethanol and a conventional hematoxylin and eosin (HE) staining was performed. The stained sections, co-registered with the MALDI imaging results, were evaluated histologically by an experienced pathologist using a conventional microscope.
Laser Microdissection and SELDI Analyses
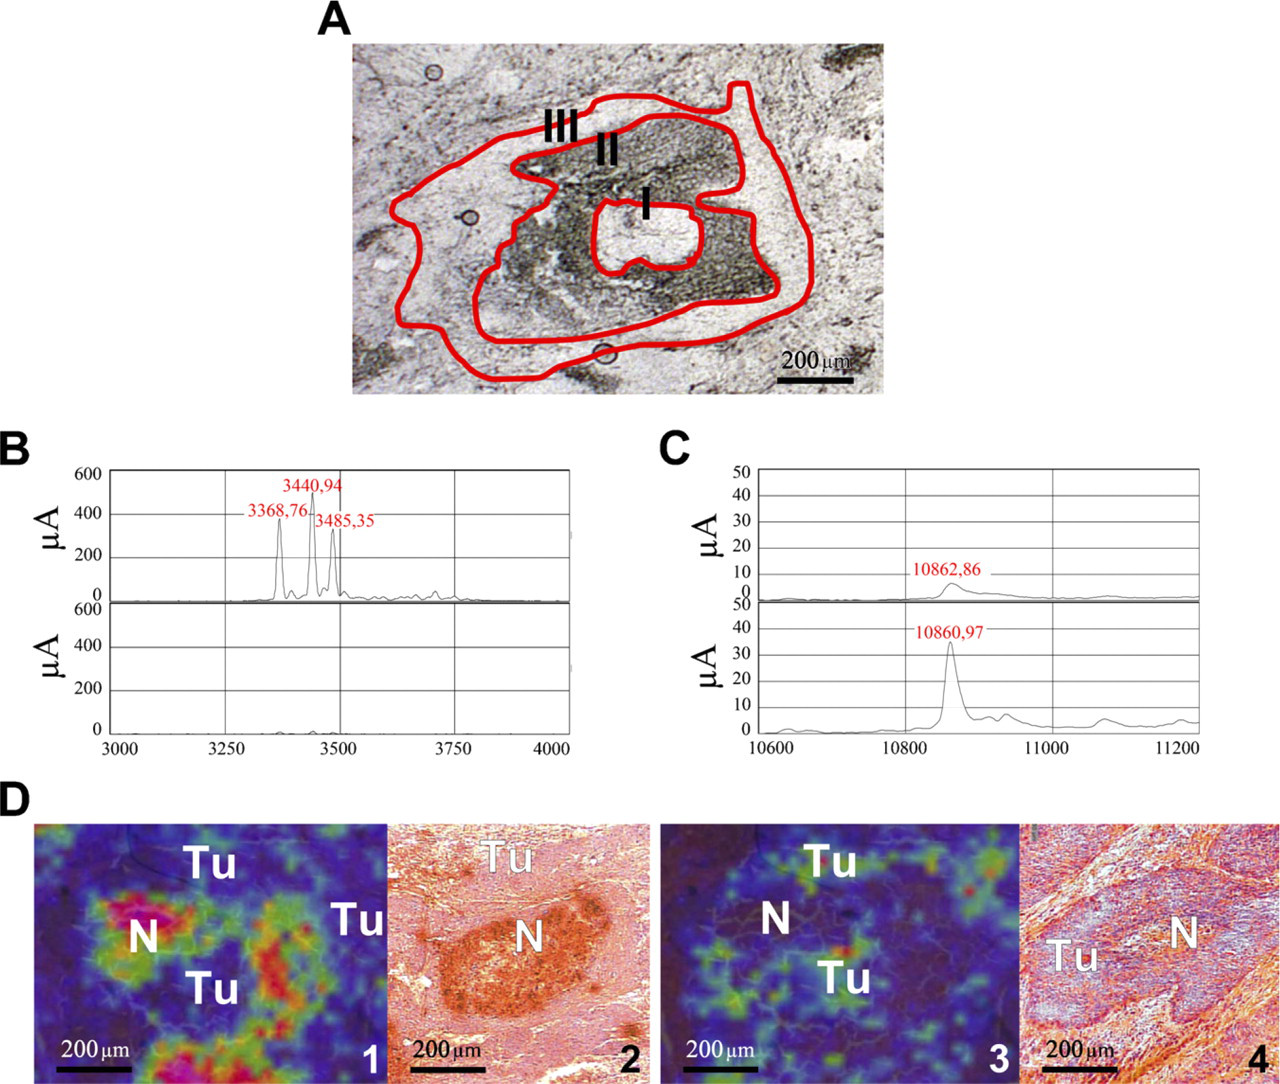
For the microdissection procedure, native cryostat tissue sections (10 μm) were transferred on microscope slides coated with a 1.35-μm membrane (polyethylene naphtalate; P.A.L.M. Microlaser Technologies, Bernried, Germany). Using a laser microdissection and pressure catapulting microscope (P.A.L.M. Microlaser Technologies), regions corresponding to the molecular masses 3372, 3444, 3488, and 10,827 Da were cut. The areas were located in comparison with an HE-stained serial section, marked, and cut out by a pathologist (Figure 1). For SELDI-analysis, the sections were transferred directly (toc–MS) (Escher et al. 2010) on an activated cationic exchanger array (CM10; Ciphergen Biosystems, Fremont, CA).
The spots on the cationic exchanger protein chip (CM10) were activated two times by applying 5 μl binding/washing buffer [0.1 M sodium acetate (pH 4.0)] for 5 min. After equilibration, the buffer was removed and 5 μl lysis buffer [0.1 M sodium phosphate (pH 7.5), 5 mM EDTA, 2 mM MgCl2, 3 mM 2-β-mercaptoethanol, 0.1% 3-[(3-cholamidopropyl)dimethylammonio]-1-propanesulfonate, 500 μm leupeptin, and 0.1 mM PMSF) was added to each spot. The microdissected tissue was transferred into the lysis buffer of each spot. The ProteinChip array was incubated in a humidity chamber for 90 min at room temperature.
The targets were then washed three times with 5 μl buffer and two times with 5 μl water to remove the unbound material and buffer salts. The array was subsequently air-dried. After application of 2 × 0.5 μl saturated sinapinic acid (dissolved in 0.5% TFA/50% acetonitrile), mass analysis was performed in a ProteinChip Reader (PSC 4000; Ciphergen Biosystems) using an automated data collection protocol.
Immunohistochemistry
Serial tissue sections (10 μm) were dried at 37C overnight. The sections were fixed in ice-cold acetone for 9 min and the avidin–biotin blocking was done according to the manufacturer's instructions (Invitrogen; Camarillo, CA). IHC staining was performed with Dako REAL Detections System (Dako; Glostrup, Denmark) following the manufacturer's instructions. Specific antibodies against the human defensins 1–3 (mouse, monoclonal, HNP1–3; BMA Biomedicals, Augst, Switzerland) and human S100A8 (rabbit, polyclonal, Calgranulin A; Santa Cruz Biotechnology, Santa Cruz, CA) were used as primary antibodies. After immunohistochemical staining, the nuclei were stained with hematoxylin and became blue under tap water.
(
Results
After histological examination, tissue sections of frozen head and neck tumor samples were submitted to MALDI–IMS, then microdissected and analyzed by SELDI and evaluated using IHC (Figures 1A–1D).
MALDI Imaging Results in a Characteristic Protein Pattern
MALDI imaging analysis of head and neck tumor tissue was performed using an Ultraflex III MALDI-TOF/TOF. Among others, characteristic peaks of 3372, 3444, and 3488 Da showed a high expression in the necrotic tissue parts and in connective tissue and stromal parts of the tumor tissue. The corresponding ion images are displayed in Figure 1D, and the detailed spectra are displayed in Figure 1B. A peak at 10,827 Da displayed a varying dissemination predominantly in the periphery of epithelial tumor areas next to stromal parts (Figures 1D 3 and 1D 4). Furthermore, this signal could be observed in the necrotic infiltrated tissue parts just as well as the signals of 3372, 3444, and 3488 Da. Figure 2 shows further the simultaneously expressed proteins in comparison with the HE-stained section.
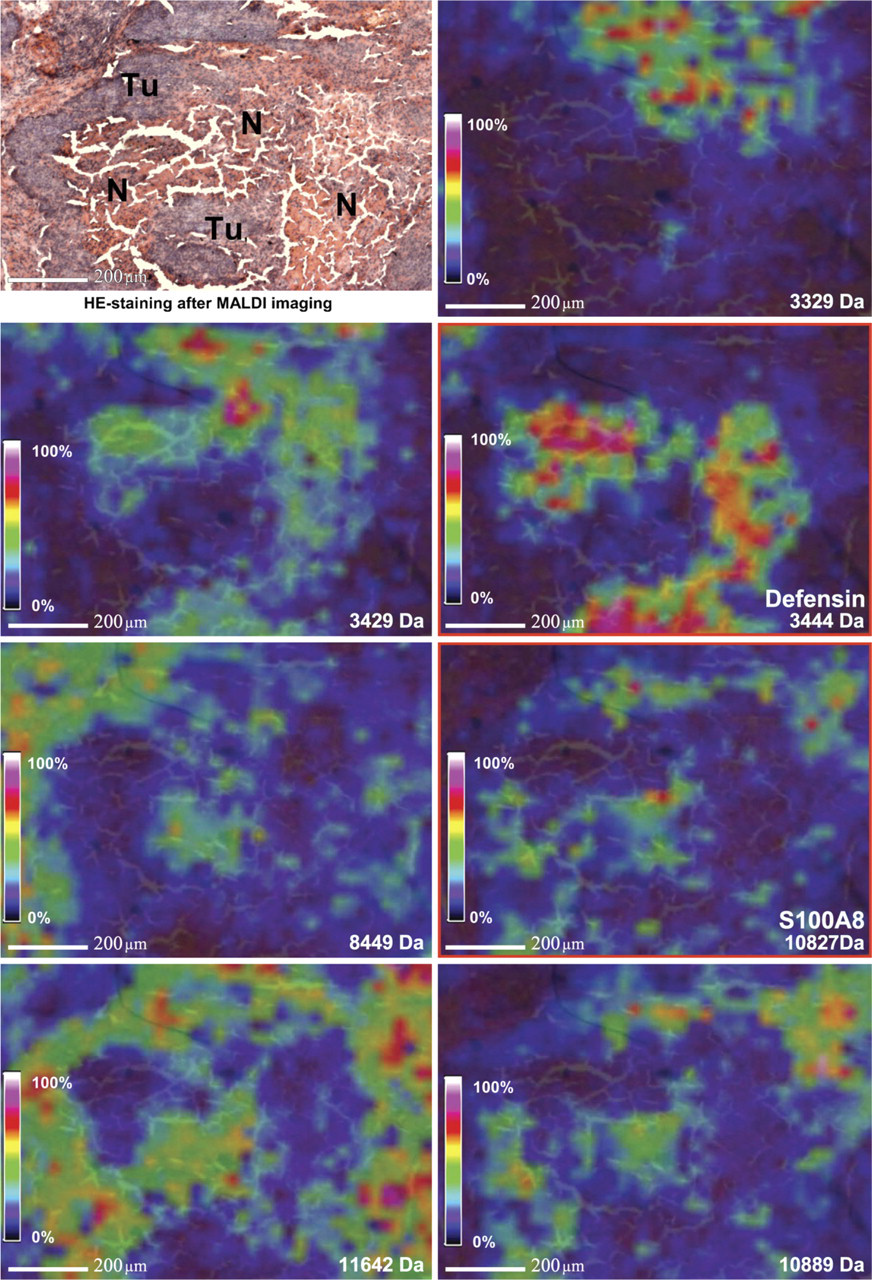
MALDI-imaging mass spectrometry (IMS): simultaneously expressed proteins of different
Microdissection and Following SELDI Analysis Showed the Same Protein Pattern of the Tumor Tissue
Areas positive and negative for the above described peaks were microdissected into consecutive unstained tissue sections (Figure 1A) and transferred to an activated cationic exchange array (CM10). The tissue was lysed directly on spot and analyzed in a ProteinChip Reader (PSC 4000). The resulting spectra contained or missed the expected signals (Figures 1B and 1C).
In former SELDI studies of our group, the peaks at 3371, 3442, and 3486 Da were identified as human α-defensins 1–3 (HNP1–3) (Melle et al. 2005). The peak at 10.8 kDa was identified as S100A8 (Melle et al. 2004).
IHC of HNP1–3 and S100A8 in Consecutive Tissue Sections
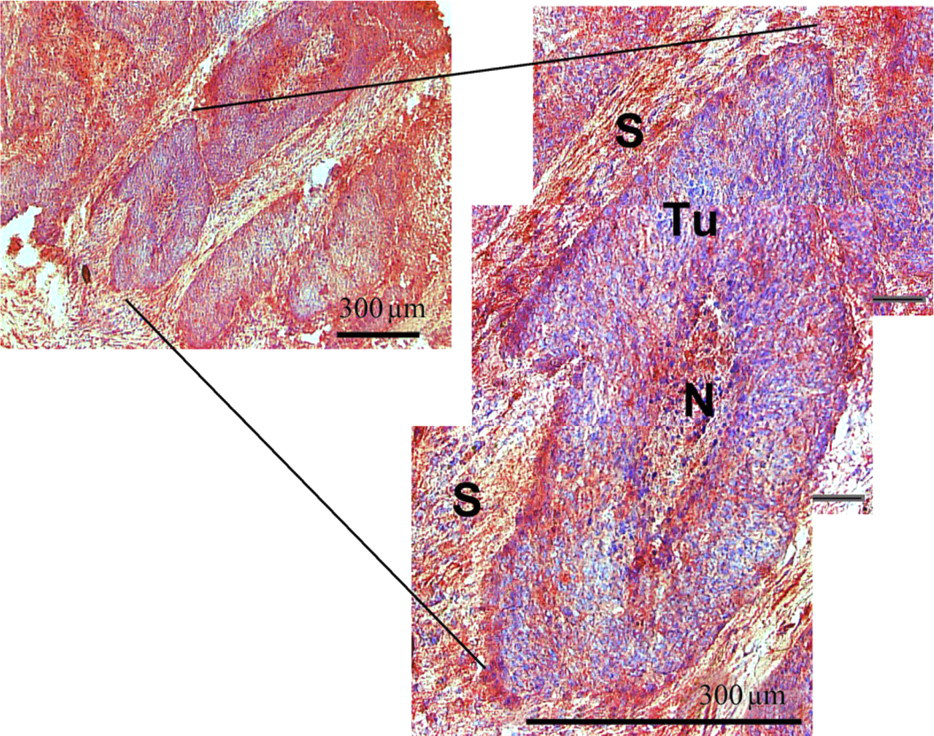
Antibodies for HNP1–3 and S100A8 were used to confirm and complement the results from IMS and SELDI. A consecutive section of the tissue stained with HNP1–3 showed a strong positive reaction in the necrotic tissue areas and the connective tissue and the stromal parts of the tumor (Figure 3). The IHC with S100A8 resulted in a strong positive reaction predominantly in the periphery of the epithelial tumor areas next to stromal parts. Also the necrotic tissue areas showed a strong positive deposition (Figure 3). Tumor cells near to stroma and stromal cells near to tumor are highlighted (Figure 4). As supposed, the localization of both proteins was more precise as with MALDI–IMS.
Discussion
In recent years, a number of protein-based techniques have been developed to characterize and to identify biomarkers for complex diseases (Chaurand et al. 2004; Melle et al. 2005). Besides two-dimensional gel electrophoresis, mass spectrometry with all its technical variations is a promising tool for the detection and characterization of proteins. These techniques have revolutionized the ability to analyze proteins from body fluids, cells, and tissues (Chaurand et al. 2004; von Eggeling et al. 2007). But none of them was able to analyze the spatial distribution of proteins in an organ or a tissue with different functional areas. However, this is essential to understand the biological function of proteins in a real-life environment.
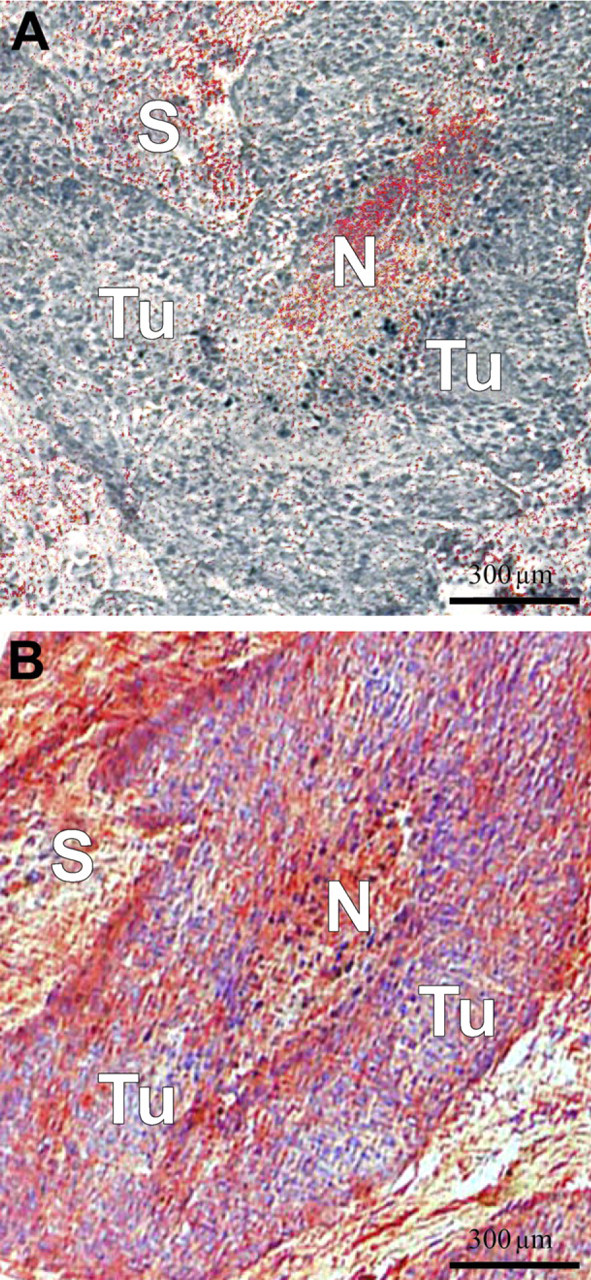
IHC for defensins (
IHC for S100A8.
One approach to elucidate the distribution of proteins is the laser-based tissue microdissection that enables the researcher to cut out defined areas and collect and move them to further analytical steps. This methodology was often combined with SELDI–MS that utilizes chips with affinity surface coatings. Thus, this technique shows a higher sensitivity of a broader mass range than comparable MALDI systems (Semmes et al. 2005). Several studies showed the potential of the combination of laser-capture microdissection with ProteinChip technology to analyze detailed regions of tissue sections and to identify several markers in diverse tumor entities (Jr et al. 1999; von Eggeling et al. 2000,2001; Cazares et al. 2002). The combination of ProteinChip arrays and laser-based microdissection, however, does not allow the analysis of the functional heterogeneity in a tissue in detail. The microdissection in tissue can only be orientated on microscopically visible borders (e.g., tumor to normal tissue) or on cells with specific morphology (Figure 1). Tissue areas that appear homogeneous and that might contain different protein composition cannot be resolved.
With MALDI–IMS, a recently developed technique, it is possible to generate molecular profiles of protein patterns directly from the tissue surface of thin sections (Seeley and Caprioli 2008). This technique analyzes intact tissue, avoiding homogenization and separation steps. For each measured spot within the tissue, it is possible to obtain a detailed spectrum of the expressed proteins. As a consequence, each molecular species in such a MALDI–IMS data set can be used to generate one image showing a close analogy to the histology (Figure 2). Such an image of the molecular masses can be attached to histoanatomical structures like tumor cells or tumor stroma and can demonstrate the heterogeneity of such tissue samples. With such a data set, it is possible to determine the localization of the proteins and to point out the proteins in direct proximity. Therefore, it is feasible to show functional connections of proteins within particular tissue areas. Nevertheless, the interpretation of such experiments is complex because of the hundreds of molecular images that have to be analyzed. Furthermore, it requires a strong cooperation between proteomic, clinical, and bioinformatics researchers, who can evaluate the results in the background of the underlying histology and in the clinical background (Deininger et al. 2008).
The traditional technique to localize proteins in a tissue is the IHC. This technique offers the highest resolution. Here, it is clear whether the protein is located in the nucleus, cytoplasm, or outside the cell. But with this technique only known proteins can be localized.
All three mentioned techniques visualizing proteins in tissue directly or indirectly have advantages and disadvantages (Table 1). In this study, we want to oppose them and analyze the synergistic effects of the applied techniques. We used consecutive tissue sections from head and neck tumor and HNP1–3 and S100A8 as exemplary proteins. Head and neck cancer tissue has been chosen because it represents a heterogeneous tissue containing many different cell types and interactions between the effective tumor cells and the related non-tumorous tissue compartments.
Overview of the advantages and disadvantages of MALDI-IMS, SELDI–MS, and immunohistochemistry
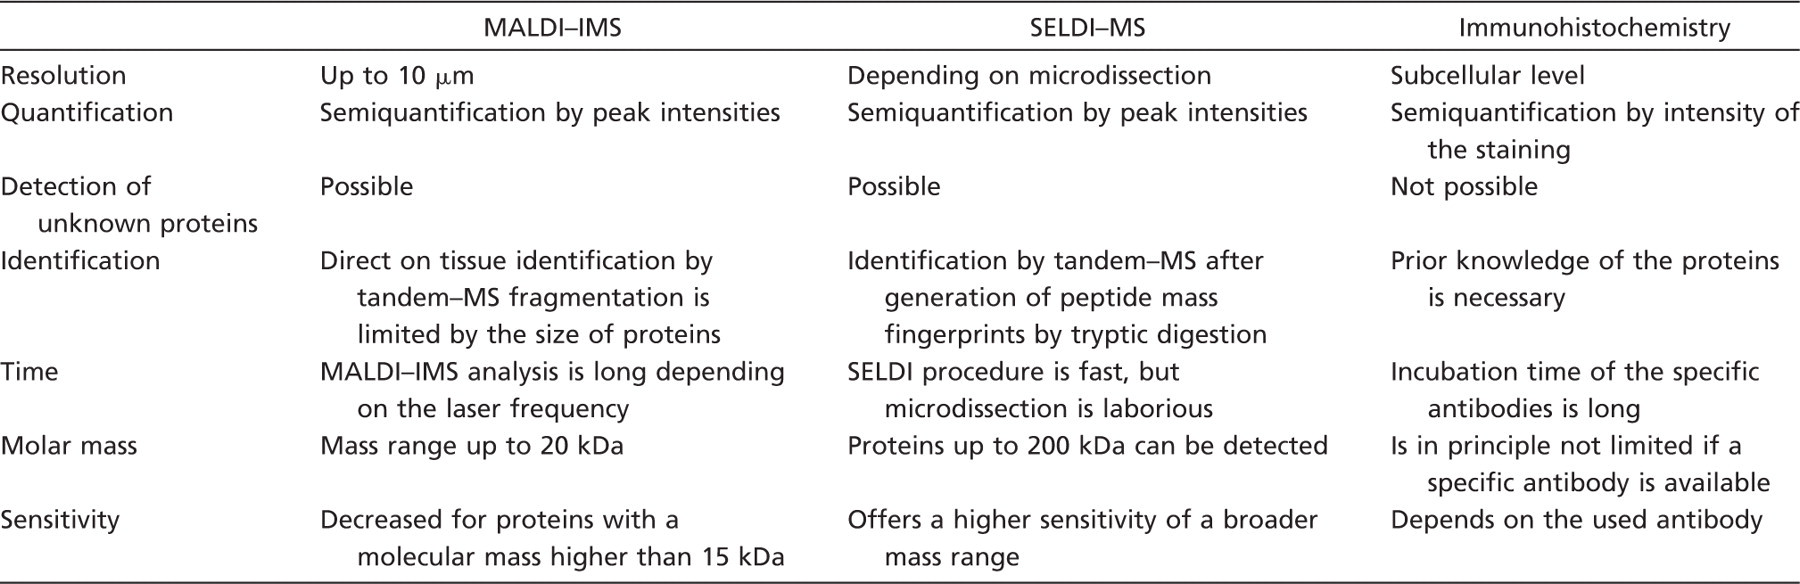
MALDI–IMS, matrix-assisted laser desorption/ionization imaging mass spectrometry; SELDI–MS, surface-enhanced laser desorption/ionization mass spectrometry.
HNP1–3 are parts of the α-defensin family of peptides. They are normally synthesized in neutrophil precursor cells and are released by mature circulating neutrophils at inflammatory sites (Albrethsen et al. 2005,2006; Melle et al. 2005). In cancers like renal cell carcinoma (Müller et al. 2002), colorectal cancer, or oral squamous cell carcinoma (Lundy et al. 2004), HNP1–3 were also found to be upregulated.
S100A8, also known as migration inhibitory factor-related proteins (MRP)-8 or calgranulin A, can form a heterodimer complex with S100A9 (MRP-14, calgranulin B) (Vogl et al. 2007). Both, but especially S100A8, are involved in the regulation of cell proliferation (Hermani et al. 2006) and acute inflammation and were found to be up- and downregulated in many cancers including gastric cancer (Yong and Moon 2007), prostate cancer (Hermani et al. 2005), head and neck cancer (Melle et al. 2004), breast carcinoma (Moog-Lutz et al. 1995), and colorectal cancer (Stulík et al. 1999). S100A8 is also involved in the metastatic process, acts as chemoattractant for the homing of tumor cells to premetastatic sites, and increases the motility of circulating cancer cells. In two of our previous studies with microdissected cancer tissue (Melle et al. 2004) and brush biopsies from oral cancer (Driemel et al. 2007) analyzed by SELDI, we showed an explicit and significant stepwise loss of expression of S100A8 during the progression from normal to proliferative/inflammatory and finally to cancer cells. A reason might be the observation that S100A8 and S100A9 have partly antagonistic functions depending on whether they act alone or in a Ca2+-dependent heterocomplex. Because of these different and sometimes inconsistently described functions, we chose HNP1–3 and S100A8 for the present study and analyzed the spatial distribution with microdissection, SELDI, MALDI–IMS, and IHC.
We found that the human defensins are usually expressed only in the necrotic/inflammatory infiltrated tissue area and in the connective and stromal parts of the head and neck cancer tissue. S100A8 was found to be predominantly located in the periphery of the epithelial tumor areas and in necrotic/inflammatory infiltrated tissue areas (Figures 3 and 4). The assumption that these signals correspond to the human α-defensins 1–3 (HNP1–3; 3377, 3448, and 3492 Da) and S100A8 (10,827 Da) was confirmed using IHC.
With all three techniques, the proteins HNP1–3 and S100A8 could be detected and localized to nearly identical regions (Figure 1). With SELDI, however, the localization can only be assigned to the microdissected area. The spatial resolution is the highest for IHC. Here, the resolution is limited only by the resolution of the microscope. When IMS can localize a protein with a 5- to 10-cell resolution, IHC can localize proteins to the subcellular level. For HNP1–3, we could show that it is an antimicrobial peptide located outside the cell membrane (Melle et al. 2005). Neither MALDI–IMS nor the combination of microdissection and SELDI–MS reach a satisfactory resolution. But MALDI–IMS has the potential to overcome this limitation in future.
The sensitivity of techniques resolving the spatial distribution of proteins is an important feature because in most cases, the highly abundant “house-keeping” proteins are not responsible for the progression of diseases. The MS-based techniques show a very high sensitivity in the low-molecular range. SELDI can detect proteins down to the high attomolar range. But sensitivity goes drastically down for the higher molecular range and for low concentrations of regulating proteins. IHC, in particular when a fluorescence detection system is used, exhibits a high sensitivity over the whole mass range.
If proteomic images were generated, it would be crucial to detect and to identify peaks of interest. Utilizing SELDI, we have demonstrated that it is possible to detect and to identify unknown proteins due to generation of peptide mass fingerprints by tryptic digestion, immunoprecipitation, IHC, and re-microdissection of positive areas (Melle et al. 2004).
MALDI–IMS offers, in principle, the possibility to directly identify peaks of interest by tandem–MS fragmentation. Nevertheless, this is limited by the low amount of proteins in a thin tissue section and the size of protein that has to be smaller than 4 kDa. Proteins with higher masses have to be digested before identification (Cazares et al. 2009; Franck et al. 2009).
Besides the detection and identification, the quantification of proteins is also an important feature. All techniques claim that they are at least semiquantitative. They have in common that the intensity of expression can display significant changes over a tissue section. In IHC, a score from 0 to 3 is used for the intensity of staining. The percentage of the stained areas could also be implemented in this score.
SELDI has shown a good ability for quantification of proteins. This is due to the chromatographic array surface. It allows only a distinct amount of the whole protein to bind. In MALDI or MALDI–IMS, the protein lysates or tissue, respectively, is placed on a steel plate or glass without surface modification. Therefore, quantification of a specific protein might be less accurate.
Time duration for analysis is another important point. All three techniques are at the moment low-throughput techniques because the required overall time for measurement is extended and evaluation of images or spectra is tedious. In routine diagnostic in IHC, the processing is highly automated, but has to be evaluated by an experienced pathologist. The SELDI procedure itself is very fast, but microdissection is laborious. IMS is up to now hampered by the long read; however, laser beams with higher frequency (currently up to 1000 Hz) and faster processing of data will improve the time of analysis.
The third important point for proteomic analysis is that the analyzing technique can detect protein over a broad mass range. IHC is in principle not limited, if a specific antibody for the exact detection of the protein is available. Then protocols have to be adapted considering protein size and localization in or outside the cell. In contrast, SELDI displays only a reduced sensitivity for masses greater than 30 kDa. According to the technical specification, proteins up to 330 kDa can be detected, but here the required elevated analyte concentrations make it incompatible with microdissection. MALDI–IMS has an even higher restriction in mass range (up to 20 kDa) because instruments are adapted to a high mass resolution in peptides.
Here, we reported a comparison of two MS-based techniques and IHC to depict the spatial distribution of significant proteins. With MALDI–IMS, the technique with the highest potential in future, we could show the arrangement of several proteins directly on the tissue. These results were confirmed by using a combination of laser microdissection and SELDI–MS. With IHC, we could render the localization more precisely.
In future, the existing technique of MALDI–IMS will be improved for sensitivity, resolution, quantifiability, and time and will be combined with further imaging techniques like positron emission tomography or coherent anti-Stokes Raman spectroscopy.
Footnotes
Acknowledgements
The Core Unit Chip Application (CUCA) is supported by the German Federal Ministry of Education and Research (BMBF) and the Interdisciplinary Center of Clinical Research (IZKF), Jena. A.C.C and U.S.S. acknowledge the Dutch Polymer Institute (DPI, technology area high-throughput experimentation) and the Thüringer Kultusministerium (B515–07008) for financial support of this study.