
Abstract
The protein kinase C-interacting cousin of thioredoxin (PICOT; also termed glutaredoxin 3) protein was discovered a decade ago as a protein kinase C θ (PKCθ)-binding protein in human T lymphocytes. PICOT possesses an amino-terminal monothiol thioredoxin-like domain and a carboxy-terminal tandem repeat of a monothiol glutaredoxin-like domain. Nevertheless, the enzymatic activities of PICOT and its potential substrates have not yet been characterized and its biological importance is unknown. Earlier studies reported the presence of PICOT in several different cell lines and tissues, but its expression pattern has not been thoroughly investigated. We performed Northern blot analysis of 19 different human organs and tissues and found the expression of PICOT mRNA in all organs and tissues tested. Western blot analysis confirmed the expression of PICOT at the protein level in all organs and tissues tested and showed, in addition, that PICOT and PKCθ expression in different tissues only partially overlap. These findings support the involvement of PICOT in biological functions that are independent of PKCθ. To analyze the in vivo expression pattern of PICOT within cells of different human organs, we performed immunohistochemical staining using PICOT-specific antibodies. Analysis of breast, pituitary, adrenal, pancreas, and kidney sections demonstrated a differential expression of PICOT in various cell types, with a predominant cytosolic staining of epithelial cells and low or undetectable levels of PICOT in the Stroma.
T
The PICOT protein possesses three highly conserved protein domains (Isakov et al. 2000; Babichev et al. 2001), one of which resembles a thioredoxin, whereas the other two resemble a glutaredoxin, both in amino acid sequence and in overall topology (Herrero and de la Torre-Ruiz 2007; Meyer et al. 2009). Although members of each of the two families of enzymes possess a conserved catalytic domain that includes two essential cysteine residues, all three domains within PICOT possess just a single cysteine, which most probably prevents PICOT from exhibiting a classical thioredoxin and/or glutaredoxin-like enzymatic activity. Initial studies indicated that PICOT undergoes tyrosine phosphorylation (Babichev et al. 2000) and nuclear translocation (Babichev and Isakov 2001) following Jurkat T cell treatment with hydrogen peroxide, suggesting the involvement of PICOT in cellular responses to oxidative stress. It should be mentioned that reactive oxygen species, including hydrogen peroxide, are produced in vivo in response to certain physiological signals and serve as regulators of cell activation (Meier et al. 1989; Ohba et al. 1994; Reth 2002). Although it is possible that PICOT operates in a fashion reminiscent of a monothiol glutaredoxin (Herrero and de la Torre-Ruiz 2007), the enzymatic activity of PICOT and the identity of its potential substrates have not yet been identified.
Recent studies have indicated that PICOT is critical for mouse development by demonstrating that ablation of the PICOT gene results in embryonic mortality between days 12.5 and 14.5 of embryogenesis (Cha et al. 2008).
In a different line of study, Park and colleagues attempted to identify negative regulators of cardiac hypertrophy and found that PICOT is among the genes that responded to cardiac hypertrophy by strong activation (Jeong et al. 2006). These studies indicated that PICOT is a critical regulator of cardiomyocyte contractility and an inhibitor of pressure overload-induced cardiac hypertrophy. Dissection of the mechanism by which PICOT induces its effect on cardiomyocytes led to the discovery that PICOT directly interacts with the muscle LIM protein (MLP; the LIM domain is a structural domain named after the proteins Lin11, Isl-1, and Mec-3). Thus, by competing with the calcineurin binding to MLP, PICOT inhibits the calcineurin-mediated dephosphorylation and activation of nuclear factor of activated T cells, thereby disrupting a critical signaling pathway that regulates cardiomyocyte contractility and attenuates cardiac hypertrophy (Jeong et al. 2008).
The fact that the expressions of both MLP and PKCθ are restricted to a small number of cell types and/or organs (Dawid et al. 1998; Meller et al. 1999; Bauer et al. 2000; Duan et al. 2003) suggests that PICOT is likely to have additional biological functions, independent of the MLP and the PKCθ. Indeed, analyses of PICOT expression in different cell lines indicated relatively high expression levels of PICOT in transformed cells, including PKCθ-negative cells (Ohayon et al. 2010). A relatively high expression level of PICOT in tumor cells was also shown by immunohistochemical analyses, where Hodgkin's lymphoma and Reed Sternberg cells were found to express significantly higher levels of PICOT compared with their normal counterparts in the human lymph node biopsies (Ohayon et al. 2010). In addition, RT-PCR analyses of human colon and lung carcinoma showed up to 50-fold increase in PICOT expression in the tumor cells (Cha and Kim 2009).
To analyze the expression patterns of PICOT in more detail, we combined Northern blot, Western blot, and immunohistochemical staining methods, all of which demonstrated a wide range of distribution of PICOT in all organs tested. Nevertheless, expression patterns of PICOT in different cell types demonstrated significant variations, with consistent high expression levels of PICOT in epithelial cells of many organs, predominantly in the cytosol.
Materials and Methods
Reagents
Reagents used in this study were the following: aprotinin, leupeptin, β-mercaptoethanol (β-ME), and Triton X-100 (Sigma; St Louis, MO), 4-(2-Aminoethyl) benzenesulfonyl fluoride hydrochloride (AEBSF) (ICN Biomedicals; Aurora, OH), nitrocellulose membranes (Schleicher & Schuell; Keene, NH), enhanced chemiluminescence (ECL) reagent (Amersham Pharmacia Biotech; Uppsala, Sweden), and bicinchoninic acid (BCA) protein assay kit (Pierce; Rockford, IL).
Antibodies and Expression Vectors
Three different anti-PICOT antibodies were used in this study. A peptide comprising aa 90–108 of the deduced human PICOT sequence was coupled to keyhole limpet hemocyanin and used for immunization of rabbits (Witte et al. 2000). This peptide includes a unique sequence that is shared by the human and mouse PICOT proteins. This rabbit antiserum was affinity-purified on a Sepharose bead-coupled synthetic peptide column (Pharmacia; Uppsala, Sweden) and was used for immunoblotting and immunostaining. Additional antisera against glutathione S-transferase–human PICOT were raised in rabbits and mice.
Additional antibodies used in this study were the following: mouse anti-PKCθ antibodies (Transduction Laboratories; Lexington, KY), mouse anti-β-actin monoclonal antibodies (Clone C4; ICN Biochemicals, Bucks, United Kingdom), mouse anti-hemagglutinin (HA) monoclonal antibody [12CA5; Berkeley Antibody Company (BAbCO), Richmond, CA], and horseradish peroxidase (HRP)-conjugated sheep anti-mouse and goat anti-rabbit immunoglobulin antibodies (Amersham Pharmacia Biotech).
A full-length human PICOT in a pEF-HA expression vector was previously described (Witte et al. 2000).
Cell Culture and Transient Transfection
The human hepatocarcinoma cell line, HepG2, and the transformed African green monkey kidney fibroblast, COS-7, were maintained in culture at a logarithmic growth phase in an atmosphere of 7.5% CO2 at 37C. HepG2 and COS-7 cells were grown in complete RPMI (cRPMI) and in complete DMEM (cDMEM), respectively, which include the following supplements: 10% heat-inactivated fetal calf serum, 2 mM
Transient transfection of COS-7 cells was performed on ∼70% of confluent cultures by the addition of pEFHA-PICOT expression vector or an empty pEF vector, as a control (0.8 μg DNA/group), using the Lipofectamine 2000 reagent (Invitrogen; Carlsbad, CA) according to the manufacturer's instruction for adherent cells.
Lysate Preparation From Mouse Organs
BALB/c mice were obtained from Harlan Laboratories (Rehovot). Organs from three individual 3-month-old BALB/c mice were removed and pooled, rinsed in cold PBS (pH 7.2), resuspended in buffer A [25 mM Tris–HCl (pH 7.5), 150 mM NaCl, 1% Triton X-100, 10 μg/ml each of leupeptin and aprotinin, 2 mM AEBSF, 1 mM Na3VO4, and 50 mM NaF], homogenized with 30 strokes of a Dounce homogenizer, and incubated for 30 min on ice. Lysates were centrifuged at 13,000 × g for 30 min at 4C, and supernatants were collected and stored. Protein concentration was determined using the BCA protein assay (Pierce). Protein samples (2 mg/ml) in buffer A were supplemented with 25% (v/v) 5X SDS sample buffer, boiled for 5 min, and analyzed by SDS-PAGE.
Electrophoresis and Immunoblotting
Protein lysates from mouse organs were resolved by electrophoresis on 10% acrylamide gels using Mini-PROTEAN II Cell (Bio-Rad; Hercules; CA). Proteins were blotted onto a nitrocellulose membrane at 100 V for 60 min, using a Mini Trans-Blot transfer cell (Bio-Rad). After blocking for 1 h with 3% BSA in PBS, the nitro-cellulose membranes were incubated with the indicated primary antibodies and followed by incubation with HRP-conjugated sheep anti-mouse or goat anti-rabbit IgG. Immunoreactive protein bands were visualized using an ECL reagent by autoradiography. Sequential re-immunoblotting of the nitrocellulose membrane with additional antibodies was performed by membrane incubation in stripping buffer [100 mM β-ME, 2% SDS, and 62.5 mM Tris (pH 6.8)] for 30 min at 50C, washing three times in TBS Tween-20, blocking for 1 h in 3% BSA in TBS, and incubation with the appropriate antibody.
Northern Blotting
Hybond Northern blot filters containing multiple poly A+ mRNA samples from human tissues and organs were obtained from Amersham Pharmacia Biotech (7 lane “Human b” filter, number RPN 4802 and 12 lane “Human d” filter, number RPN 4800). Hybridization of filters was performed using RapidHyb solution (Amersham Pharmacia Biotech) according to the manufacturer's guide. The PICOT and β-actin cDNAs were used for the generation of 32P-labeled probes using a commercial kit (Rediprime II; Amersham Pharmacia Biotech). Overnight hybridization was performed with 32P-labeled cDNA probe (10 6 cpm/ml) at 65C in 10% dextran sulfate, 4X saline-sodium citrate (SSC), 7 mM Tris (pH 7.6), 0.8X Denhardt's solution, 0.02 mg/ml salmon sperm DNA, and 10% SDS. Blots were first washed twice in 2X SSC and 0.1% SDS for 20 min at room temperature and washed again in 0.2X SSC and 0.1% SDS at 65C. Membranes were developed by exposure to BioMax X-ray films (Eastman Kodak; Rochester, NY) in the presence of an intensifying screen at −80C.
Immunohistochemistry
Immunohistochemical analysis of PICOT expression was performed on HepG2 cells, paraffin-embedded human whole tissue sections, and commercially available tissue microarray (TMA; Thermo Fisher Scientific, Fremont, CA). HepG2 cells (1 × 10 4 cells/ml) were seeded on Superfrost Plus microscope slides (Thermo Fisher Scientific), placed in a 14-cm diameter × 1.5-cm deep plastic petri dish, in cDMEM, to promote cell attachment. On reaching ∼30% confluency, the slides were placed in a Coplin staining jar, rinsed twice with PBS and fixed in freshly prepared 4% formaldehyde/PBS for 20 min, and washed three times in PBS. After gentle washing, the cells were quenched of endogenous peroxidase activity by immersion in 3% hydrogen peroxide-containing methanol (20 min), followed by rinsing with de-ionized water. The slides were then blocked by 30 min incubation with normal goat serum (Vectastain elite ABC kit; Vector Laboratories, Burlingame, CA), overlaid with affinity-purified rabbit anti-PICOT antibodies, and incubated for additional 16 hr in a humidified chamber at 4C. Slides were then incubated (30 min) with biotinylated goat anti-rabbit IgG antibodies (1:1000 dilution), followed by incubation (30 min) with avidin-biotinylated enzyme complex (Vectastain elite ABC kit). PICOT was ultimately visualized by incubation with 3-amino-9-ethyl carbazole (Vector Laboratories) reagent as a chromogenic substrate (red color), and nuclei were counterstained in blue by hematoxylin.
Tissue samples were fixed with 10% formalin/phosphate-buffered solution for 18 hr, embedded in paraffin, and cut into 4-μm-thick sections. The sections were mounted onto positively charged glass slides and dried overnight at 60C. After deparaffinization with xylene and rehydration in decreasing concentrations of ethanol, samples were quenched of endogenous peroxidase activity by immersion in 3% hydrogen peroxide-containing methanol (20 min), followed by rinsing with deionized water. The slides underwent a step of antigen retrieval in 10 mM EDTA buffer in a pressure cooker, followed by gradual cooling at room temperature. After blocking of the sections by incubation with normal goat serum, samples were stained as described earlier.
TMA slides were quenched of endogenous peroxidase activity and stained as described earlier.
Results
Northern Blot Analysis of PICOT mRNA Expression in Human Organs
The PICOT protein was discovered a decade ago, but its biological role is yet largely unknown. However, determination of the expression patterns of PICOT may potentially provide valuable information relevant to its involvement in tissue- and/or organ-specific physiological processes. We, therefore, performed expression analysis of PICOT using several different approaches. In the first study, we used commercially available multiple-tissue Northern blot filters (Amersham Pharmacia Biotech), representing 19 different human organs and tissues. Usage of PICOT cDNA as a probe revealed that a hybridizing mRNA of ∼1.5 kb is found in all 19 tissues and organs tested (Figure 1). PICOT expression levels appear to be more abundant in the thymus, heart, skeletal muscle, liver, and placenta, whereas lower expression levels were found in peripheral blood leukocytes, stomach, and lymph nodes. Membrane striping and reblotting with a β-actin–specific probe demonstrated that similar amounts of mRNA were loaded in most tissue and organ samples analyzed, with a few exceptions. A comparison of PICOT mRNA expression levels revealed a maximal difference of ∼4-fold between samples of the 19 different organs and tissue samples tested.
Analysis of the Specificity of Mouse and Rabbit Anti-PICOT Antibodies
Specificity of the polyclonal mouse and rabbit anti-PICOT antibodies was tested by immunoblot and IHC. In the first assay, lysates of COS-7 cells were used, which were transiently transfected with pEF-HA-PICOT or an empty vector as a control. Cell lysates were subjected to SDS-PAGE under reducing conditions, and proteins were then electroblotted onto a nitrocellulose membrane. Membrane incubation with HA-specific antibodies revealed a single band corresponding to a protein with a molecular mass of ∼38 kDa, representing the expected molecular mass of HA-PICOT (Figure 2). This protein band was observed in the lysate of cells transfected with HA-PICOT but not in the lysate of cells transfected with an empty vector, indicating that the ∼38 kDa protein corresponds to PICOT. Incubation of three additional membranes, which were prepared in parallel, with three different anti-PICOT antibodies demonstrated that all three antibody preparations reacted with a single immunoreactive protein band that corresponds in size to PICOT (Figure 2). The signal observed in the lysate of HA-PICOT-transfected cells was stronger than that in control cells, providing an additional support for the antibody specificity.
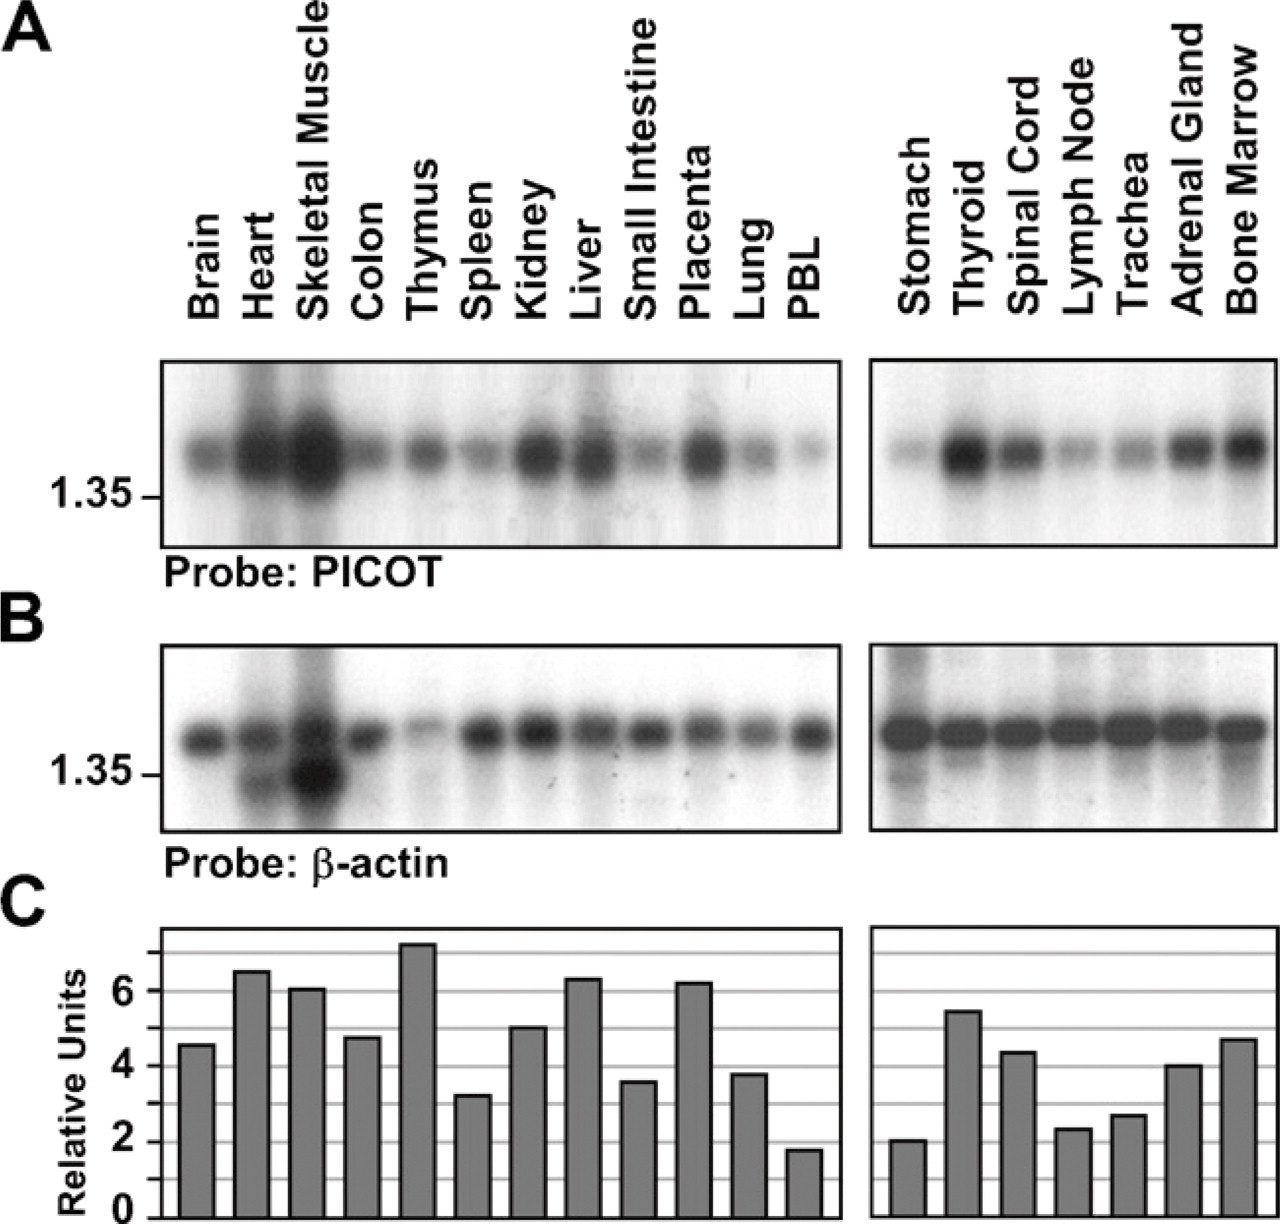
Northern blot analysis of PKC-interacting cousin of thioredoxin (PICOT) mRNA expression in human tissues and organs. Northern blot was performed on pre-made commercially available membranes blotted with mRNA samples (5 μg/lane) from different human organs. (
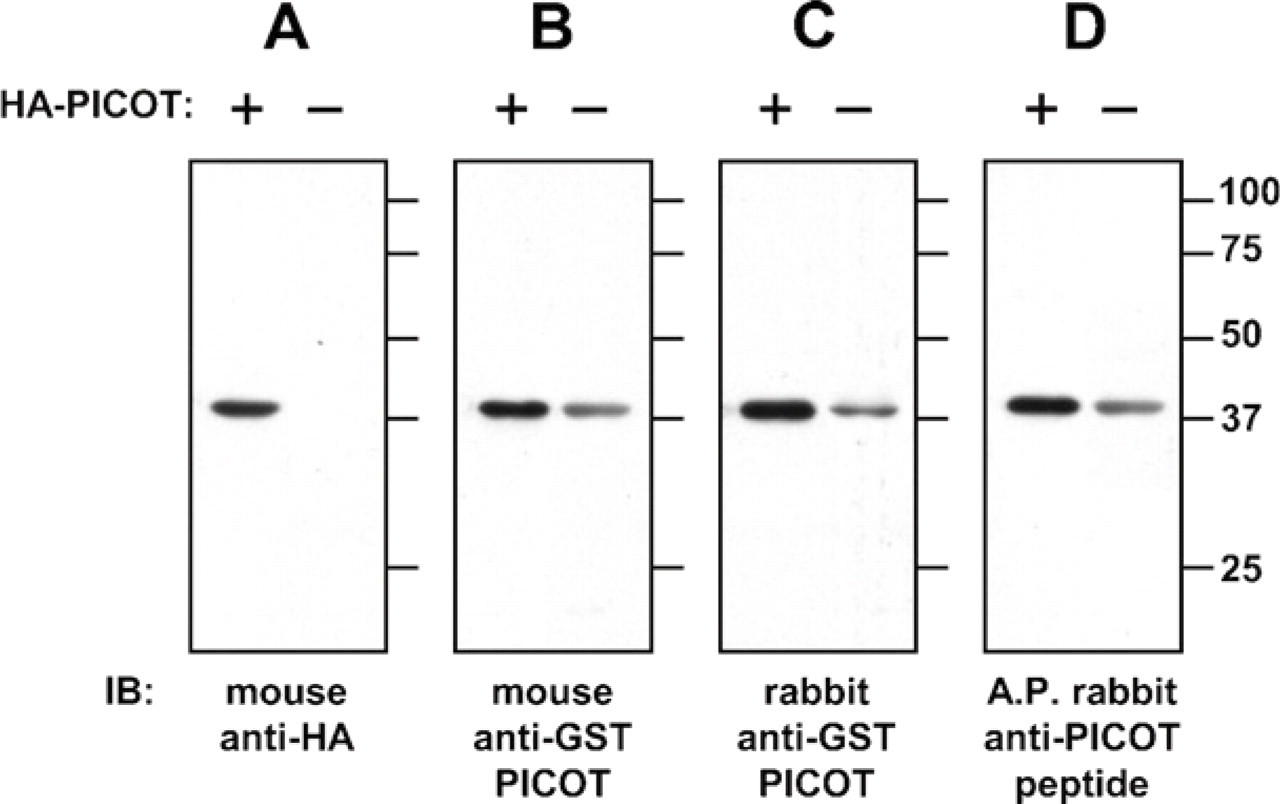
Western blot specificity analysis of the mouse and rabbit anti-PICOT antibodies. COS-7 cells were transfected with a pEF-HA-PICOT or an empty pEF vector, using the Lipofectamine 2000 Reagent, in accordance with the manufacturer's instructions for adherent cells. Four replicates of samples equivalent to 3 × 10
4
cells/lane were subjected to SDS-PAGE under reducing conditions, and proteins were then electroblotted onto a nitrocellulose membrane that was cut into four pieces, each containing samples of transfected and control cells. Each of the four membranes was incubated with one of the four different primary antibodies used. Immunoreactive protein bands were visualized by reaction with an HRP-conjugated secondary antibody and development with an immunoperoxidase enhanced chemiluminescence (ECL) detection system, followed by autoradiography. Primary antibodies used for the immunoblot were mouse anti-hemagglutinin (ascites, 1:5000 dilution;
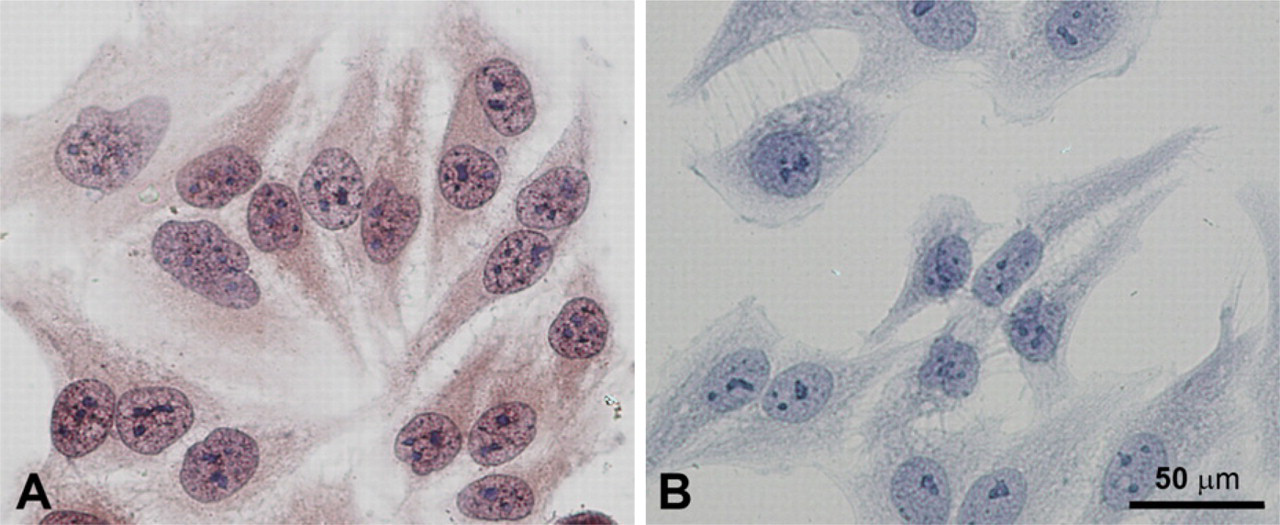
Immunohistochemical staining of hepatocarcinoma (HepG2) cells with affinity-purified rabbit anti-PICOT antibodies. The human hepatocarcinoma cell lines, HepG2, were seeded on Superfrost Plus microscope slides (1 × 10
4
cells/ml) placed in large petri dish to promote cell attachment. After reaching ∼50% confluency, the cells were washed and fixed in freshly prepared formaldehyde solution. The cells were quenched of endogenous peroxidase activity and blocked by incubation with normal goat serum. The cells were then stained by incubation with affinity-purified rabbit anti-PICOT antibodies (
To select one of the above tested anti-PICOT antibodies for immunostaining, we next tested their specificity by immunohistochemical staining of cultured HepG2 cells, a human hepatocellular liver carcinoma cell line. A preliminary assay in which lysates of HepG2 cells were tested by immunoblot demonstrated a single protein band that corresponds in size to PICOT. Immunohistochemical staining using each of the three different antibodies tested yielded a similar pattern of staining of HepG2 cells. Staining results obtained with the affinity-purified rabbit anti-PICOT antibodies are presented in Figure 3. No staining was observed when the secondary antibody alone was used. In addition, co-incubation of the affinity-purified rabbit anti-PICOT antibodies with excess amount of soluble peptide, which was used as the immunogen, completely blocked cell staining (not shown).
Western Blot Analysis of PICOT Expression in Mouse Organs and Comparison With Expression of PKCθ
PICOT was discovered in a search for molecules that interact with and potentially regulate PKCθ in activated human T lymphocytes (Witte et al. 2000). RT-PCR and Western blot analyses demonstrated that PICOT is expressed in several different organs and tissues (Witte et al. 2000; Ohayon et al. 2010). To perform a thorough analysis of PICOT expression in mouse organs and to compare it with that of PKCθ, we performed a Western blot analysis of 16 different mouse organs, using PICOT- and PKCθ-specific antibodies. We found that PICOT is an abundant protein expressed at a relatively high level in most organs tested. In contrast, expression of PKCθ was restricted to selected organs, with high levels in secondary (lymph node and spleen) and some primary (thymus but not bone marrow) lymphoid organs and low or undetectable levels in intestine, testis, liver, and kidney (Figure 4).
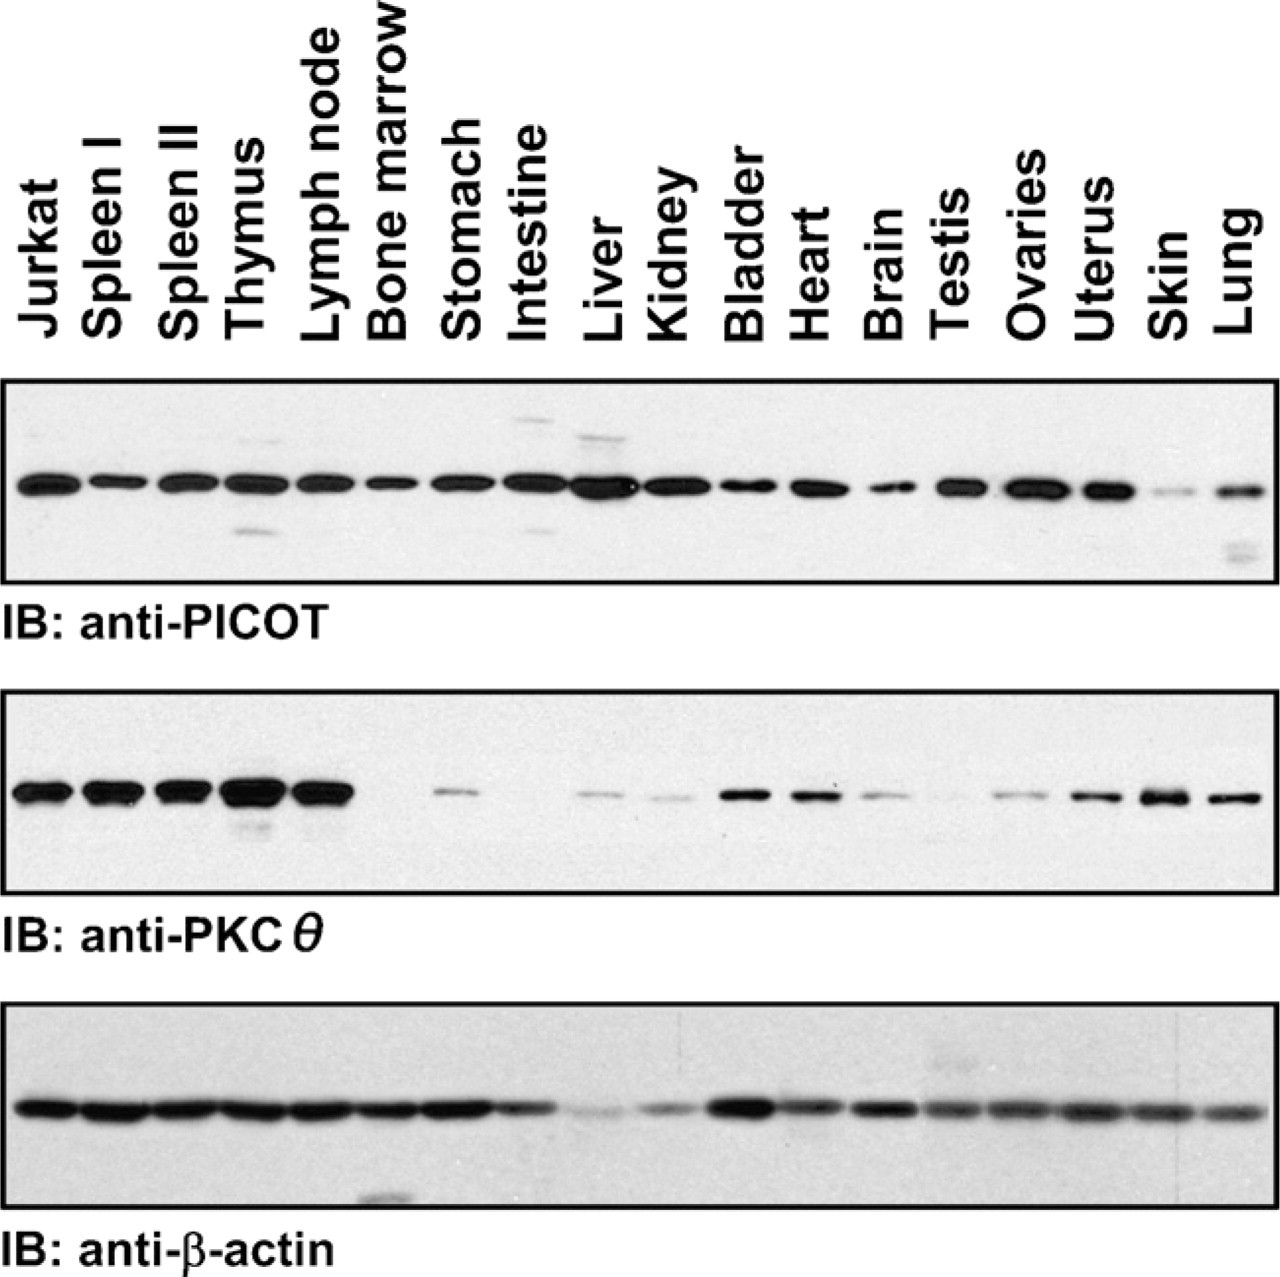
Comparative Western blot analysis of PICOT and protein kinase C θ (PKCθ) expression in mouse organs. Organs from three individual BALB/c male mice and ovaries and uteri from three individual BALB/c female mice were pooled and resuspended in lysis buffer (buffer A). Organ cell lysates were prepared using a Dounce homogenizer and centrifuged at 13,000 × g, and the supernatants were collected. Lysates of Jurkat T cells and spleen cell suspension (Spleen I) were also prepared in lysis buffer. Protein concentration was determined using the Pierce bicinchoninic acid protein assay and followed by sample resuspension in SDS sample buffer and boiling. Samples were fractionated by electrophoresis on 10% acrylamide gels and blotted onto nitrocellulose membranes. After blocking with BSA, the nitrocellulose membranes were sequentially incubated with affinity-purified rabbit anti-PICOT antibodies, HRP-conjugated goat anti-rabbit IgG antibodies, and an ECL reagent and followed by autoradiography. Sequential re-immunoblotting of stripped membranes was performed with mouse anti-PKCθ and mouse anti-β-actin antibodies. Similar results were obtained in four individual experiments.
Immunohistochemical Analyses of PICOT Expression in Normal Breast and Breast Cancer Tissue
The results thus far suggest that PICOT is a ubiquitous protein expressed in a wide range of organs and tissues. To distinguish between the possibilities that PICOT is a critical protein for all cells, such as the actin molecule, or is perhaps expressed in selected cell types, which are found in most or all organs, we further examined its expression in human organs by immunohistochemical staining of either paraffin-embedded tissue sections or commercially available TMA.
Staining analysis of normal breast tissue showed relatively high expression levels of PICOT in mammary epithelial cells within the ducts and lobules and low or no expression levels of PICOT in stromal cells and endothelial cells (Figure 5). High expression levels of PICOT were predominantly cytosolic. Epithelia surrounding the ducts and lobules in ductal and lobular carcinoma, respectively, showed increased PICOT expression compared to normal mammary tissue.
Immunohistochemical Analysis of PICOT Expression in Secretory Epithelial Cells and Reabsorptive Epithelial Cells of the Kidney
To substantiate the findings that PICOT is expressed at relatively high levels in epithelial cells, we further analyzed PICOT expression in human organs that are rich in secretive and/or reabsorptive epithelial cells. Immunohistochemical staining revealed high expression levels of PICOT in the cuboidal epithelial cells encircling the lumens within the pituitary gland (Figure 6). Staining pattern was homogenous and predominated in the cytoplasm of the cells. Positive staining was also observed in the adrenal epithelia, where staining showed a punctuated cytoplasmic pattern. In the pancreas, which represents an exocrine gland, PICOT was found to be expressed predominantly in the secretory epithelia. Finally, staining of the kidney tissue demonstrated a predominant PICOT expression in the reabsorptive renal epithelial cells lining the proximal tubules, with a somewhat weaker expression in the epithelium of the collecting ducts. The kidney's stromal cells exhibited a negative or very weak staining of PICOT.
Discussion
Although PICOT protein was discovered a decade ago, its precise expression patterns and cellular localization have not been thoroughly investigated. In the present work, we combined Northern blot, Western blot, and immunohistochemical staining methods to analyze the expression patterns of PICOT. Northern and Western blot analyses demonstrated that PICOT is an abundant protein in most organs and tissues, with some variations showing higher expression levels in the heart, kidney, and liver and somewhat lower expression levels in the lung and brain. However, in contrast to the general assumption that PICOT is a ubiquitous protein, immunohistochemical staining of human organs demonstrated significant variations in PICOT expression in different cell types. Thus, high levels of PICOT were observed in epithelial cells of all organs, predominantly in the cytosol, with undetectable or low levels of PICOT in stromal cells of most organs tested. The results, therefore, suggest a differential expression of PICOT in distinct cell types.
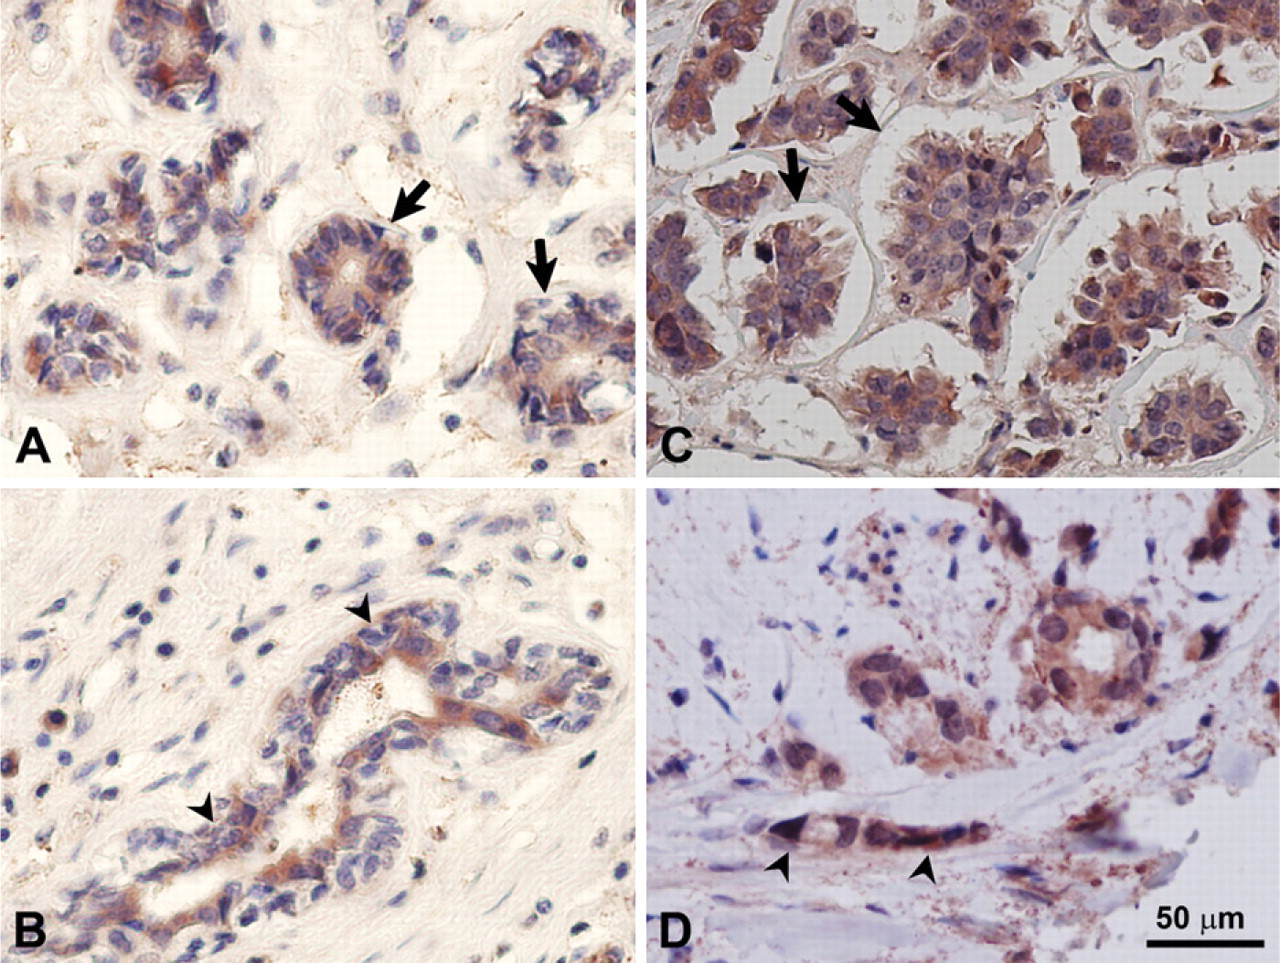
Immunohistochemical staining of normal breast and breast cancer tissues with anti-PICOT antibodies. Immunohistochemical staining of normal breast tissues (
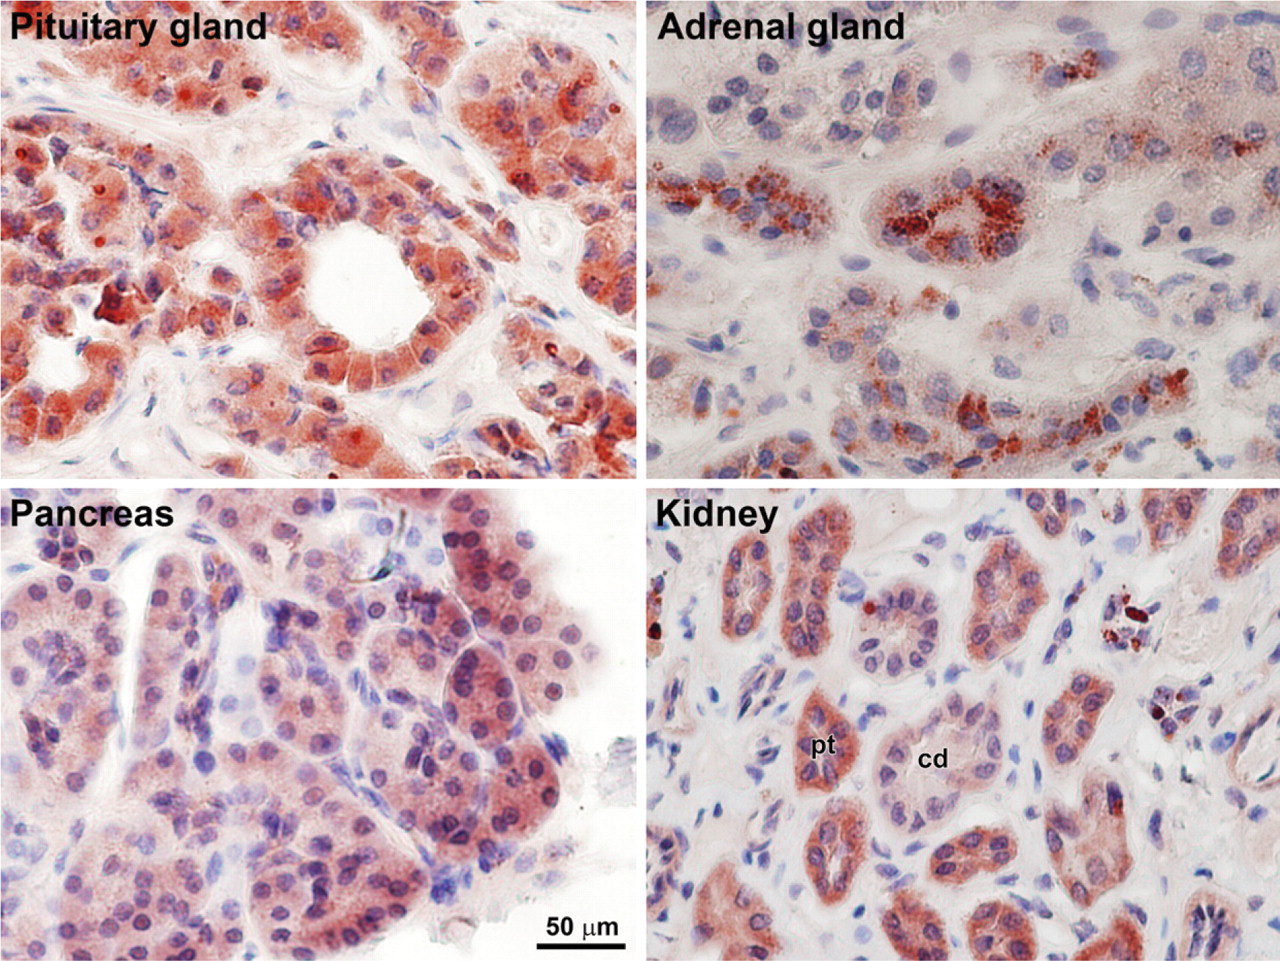
Immunohistochemical staining of human pituitary and adrenal glands, pancreas, and kidney tissues with anti-PICOT antibodies. Tissue sections of normal human pituitary and adrenal glands, pancreas, and kidney were stained with affinity-purified rabbit anti-PICOT antibodies. Relatively high expression levels of PICOT were observed in the secretory epithelium of the endocrine glands, the pituitary glands, and the adrenal glands. High expression of PICOT was also observed in the cuboidal epithelium of the pancreas, a secretive exocrine gland, and in the cuboidal epithelium lining the kidney tubules and ducts. The latter cells exhibit absorptive or waste excretion functions depending on their location along the kidney's nephron. Pt, proximal tubule; cd, collecting duct.
The PICOT gene undergoes upregulation during mouse embryogenesis, where it was initially detected on day 9.5 of embryogenesis (E9.5) (Greene et al. 2002). These results indicated that upregulation of PICOT correlates with the onset of PKCθ expression (Wilda et al. 2001). However, comparative expressions of PICOT and PKCθ in mouse organs demonstrated an incomplete overlap between the two proteins, where PICOT, but not PKCθ, was expressed in organs and tissues such as bone marrow, intestine, and testis (Figure 4). These results suggest that PICOT may be involved in developmental processes and exhibit functional activities, which are independent of PKCθ. This assumption is further supported by the observation that total ablation of PKCθ from T cells did not alter the expression level of PICOT (Witte et al. 2000; Ohayon et al. 2010).
The two C-terminal domains of PICOT [also termed PICOT-homology domains; PICOT-HD (Isakov et al. 2000)] display a significant sequence and structure homology to glutaredoxins, on the basis of which PICOT was attributed to the glutaredoxin family. Nevertheless, the enzymatic activity of PICOT has not yet been characterized. The major function of glutaredoxins is to reduce disulfide bridges in target proteins, a reaction catalyzed by an active site (Cys-Pro-Tyr-Cys) possessing two conserved cysteine residues, which are critical for the enzymatic activity. In contrast, the homologous sequences in the two PICOT-HDs of human, mouse, and rat PICOT possess only a single cysteine (Cys-Gly-Phe-Ser), suggesting that PICOT represents a distinct group of multidomain monothiol glutaredoxins, based on which it was termed GRX3 or GLRX3 (Lillig et al. 2008).
An attempt to compare the potential involvement of different glutaredoxins in malignant vs normal cells was performed by RT-PCR, using pairs of primers corresponding to the four known families of glutaredoxins (Cha and Kim 2009). Surprisingly, an increase of ∼50-fold in the expression levels of PICOT (GLRX3) was observed in colon and lung carcinoma, in comparison with the PICOT expression levels in non-transformed cells of the same histological origin. Despite this significant increase in PICOT expression, the levels of other glutaredoxins, including GLRX1, GLRX2, and GLRX4, were almost unaltered (Cha and Kim 2009). Furthermore, expression levels of other redox regulating enzymes, including all thioredoxins and peroxiredoxins, were roughly the same in transformed cells and their normal counterparts. These results, and the observation that PICOT expression increases in Hodgkin's lymphoma/Reed Sternberg cells (Ohayon et al. 2010), suggest that PICOT has a positive role in supporting/promoting tumor cell growth and/or survival. Previous studies have shown that normal mouse lymphocytes responded to T cell mitogens by an increase in cell proliferation and a simultaneous increase in PICOT expression (Ohayon et al. 2010), suggesting a positive role for PICOT in promoting the multiplication of transformed and normal cells. However, it is not clear yet whether PICOT serves as a cell growth promoting molecule or whether the increase in its expression in proliferating cells reflects a result rather than a cause.
Footnotes
Acknowledgements
Research in our laboratory is supported in part by the Israel Science Foundation, USA–Israel Binational Science Foundation, Israeli–Taiwanese Scientific Research Cooperation, Israel Cancer Research Fund, Chief Scientist's office, Israel Ministry of Health, Israel Cancer Association through a donation by Ida and Harry Shooster and a donation by Linda Osofsky. N.I. holds the Joseph H. Krupp Chair in Cancer Immunobiology.