
Abstract
Acrolein is a potent fixative that provides both excellent preservation of ultra-structural morphology and retention of antigenicity, thus it is frequently used for immunocytochemical detection of antigens at the electron microscopic level. However, acrolein is not commonly used for fluorescence microscopy because of concerns about possible autofluorescence and destruction of the luminosity of fluorescent dyes. Here we describe a simple protocol that allows fine visualization of two fluorescent markers in 40-μm sections from acrolein-perfused rat brain. Autofluorescence was removed by pretreatment with 1% sodium borohydride for 30 min, and subsequent incubation in a 50% ethanol solution containing 0.3% hydrogen peroxide enhanced fluorescence labeling. Thus, fluorescence labeling can be used for high-quality detection of markers in tissue perfused with acrolein. Furthermore, adjacent acrolein-fixed sections from a single experiment can be processed to produce high-quality results for electron microscopy or fluorescence labeling.
Keywords
A
However, highly reactive aldehyde fixatives like glutaraldehyde or acrolein are not often used for fluorescence studies. While there are some reports of fluorescence labeling after glutaraldehyde fixation, to our knowledge, acrolein has been seldom used because of concerns about possible high-background autofluorescence levels, as described for glutaraldehyde (Cande et al. 1977; Weber et al. 1978; Clancy and Cauller 1998) and fluorophore degradation (Herzog and Kummel 2000). Nevertheless, we sought to extract connectional and neurochemical information from valuable tissue samples that had been labeled in vivo with an anterograde tracer and subsequently fixed with acrolein with the original intent of analysis with EM but where the number of labeled axons of interest were too sparse for EM detection.
Several treatments have been used to remove tissue fluorescence caused by other fixatives, mostly glutaraldehyde, but only partial reductions have been achieved (Weber et al. 1978; Beisker et al. 1987; Clancy and Cauller 1998; Haraguchi and Yokota 2002; Ngwenya et al. 2005). For example, a 30% reduction of background autofluorescence was reported for paraformaldehyde-fixed sections after immersion in sodium borohydride (NaBH4), an aldehydic reducing agent (Abdel-Akher et al. 1952), and somewhat lower in glutaraldehyde-fixed tissue (Clancy and Cauller 1998), whereas lower reductions have been achieved with treatments involving glycine, ammonium chloride, or Sudan black B (Ngwenya et al. 2005). In addition, in situ hybridization visualized with fluorescence labeling has been shown to benefit, in some cases, from incubation in an alcohol-containing quenching solution (Barroso-Chinea et al. 2007).
We report here that pretreatment with NaBH4 and subsequent incubation in 50% ethanol allows successful two-color fluorescence labeling of acrolein-fixed tissue and that the quality of detection is similar to that obtained for EM studies. Thus, fluorescence labeling can be used for high-quality detection of markers in tissue perfused with acrolein. Furthermore, fluorescence techniques and ultrastructural studies can be carried out with adjacent acrolein-fixed sections from the same tissue block.
Materials and Methods
Surgical Procedure and Perfusion of Animals
All experiments were conducted using adult male Wistar rats (250–300 g; Harlan, San Pietro al Natisone, Italy) in accordance with the national and European regulations for animal care (Spanish Royal Decree 223/1988 and European Council Directive 86/609/EEC) and were approved by the institutional animal care and use committee of the University of Navarra. Prior to surgery, rats were deeply anesthetized with a mixture of ketamine [(Imalgène 500) 75 mg/kg; Merial, Barcelona, Spain], xylacine [(Rompún 2%) 10 mg/kg; Bayer, Leverkusen, Germany), and atropine (0.05 mg/kg; B. Braun Medical, Barcelona, Spain) intraperitoneally and placed in a stereotaxic frame (model 1730; David Kopf Instruments, Tujunga, CA). A local anesthetic [(Xilonibsa) 2% lidocaine; Inibsa, Barcelona, Spain] was also administered in the external acoustic meati and scalp. After the craniotomy, 2% biotinylated dextran amine (BDA-10.000; Molecular Probes Europe, Leiden, The Netherlands) in phosphate buffer (PB), 0.01 M (pH 7.4), was iontophoretically administered in the ventral pallidum through glass micropipettes (inner tip diameter, 30–60 μm), using a 5-μA positive-pulsed direct current (7 sec on/7 sec off) over 10–20 min.
After a survival period of 12–15 days, the animals were deeply anesthetized with 10% chloral hydrate (10 ml/kg, intraperitoneally) and perfused through the aortic arch with (1) 5–10 ml of heparin-saline, (2) 50 ml of 3.75% acrolein (catalog ref. 01680; Fluka, Steinheim, Germany) in 2% paraformaldehyde, and (3) 200 ml of 2% paraformaldehyde. The fixative solutions were prepared in 0.1 M PB (pH 7.4). Brains were removed from the cranium, blocked into 2–4-mm coronal slices of tissue and postfixed in a 2% paraformaldehyde solution for 30 min at 4C. Subsequently, brains were immersed in PB and sectioned rostrocaudally at a thickness of 40 μm on a vibratome (VT 1000S; Leica Microsystems, Nussloch, Germany). Sections were serially collected in cryoprotective solution (30% ethylene glycol, 30% glycerol in 0.05 M PB) and stored at 220C.
Sodium Borohydride Pretreatment
In a first set of experiments, we analyzed the effect of pretreatment with sodium borohydride (NaBH4) on acrolein-fixed tissue. Two serial brainstem sections from five animals that had undergone surgery and subsequent acrolein fixation were selected and rinsed thoroughly in PB at room temperature to remove all cryoprotectant solution. One series of sections was subsequently incubated in a freshly prepared 1% solution of NaBH4 in PB for 30 min under agitation at room temperature and thoroughly rinsed in PB to eliminate all bubbles, until the sections laid flat at the bottom of the crucible (Leranth and Pickel 1989; Mengual and Pickel 2002). The other series of sections were kept in PB under agitation at room temperature for the equivalent time of treatment and rinses. Finally, both sets of sections were mounted onto subbed slides, air-dried, dehydrated, and defatted in toluene (12 min), and cover-slipped with mounting medium (DPX; VWR International Ltd., Poole, England).
All sections were examined with a confocal laser scanning microscope (LSM 510 META model; Zeiss, Göttingen, Germany) using a 40x oil immersion lens with differential interference contrast. Green Alexa 488 fluorescence (Molecular Probes) was excited using a 488-nm argon laser, and emitted fluorescence was detected with a 505–530-nm-band-pass filter. Red Alexa 568 was excited with a 543-nm helium/neon laser, and emission was detected with a 560-nm-band-pass filter. Two images were taken at random from each section; all images were captured with the same acquisition settings so that comparisons could be made between the two groups. The background intensity was measured both in the red and green channels with Zeiss LSM software and was calculated from three areas per section with the formula S (intensity × absolute frequency)/&Sgrave; absolute frequency. Mean values from treated sections were compared to those from non-treated sections, using the Wilcoxon non-parametric test for two dependent samples (SPSS software, version 15.0; Chicago, IL).
Incubation in a Quenching Solution and Two-color Fluorescence Labeling
After sections were pretreated with NaBH4, a series of sections were rinsed three times in PB and three times in PBS (0.1 M; pH 7.4) and incubated for 30 min at room temperature in a 50% ethanol solution containing 0.3% H2O2 (Prensa and Parent 2001). Treated and non-treated sections were subsequently rinsed three times in PBS and processed for two-color fluorescence labeling as follows. All incubations were carried out in the dark at room temperature and under agitation, unless otherwise specified. Sections were incubated in streptavidin-Alexa 488 (1:250 dilution; Molecular Probes) in PBS for 2 hr, followed by three washes in PBS and incubation for 40 min in a solution containing 4% normal rabbit serum, 0.05% Triton X-100, and 4% BSA. Subsequently, sections were incubated overnight at 4C in the same solution containing a goat polyclonal antibody against choline acetyltransferase [(ChAT] 1:150 dilution; Chemicon International Inc., Temecula, CA). After sections were washed three times in PBS, they were incubated for 2 hr in a solution containing 0.5% normal rabbit serum, 2% BSA, and Alexa Fluor 568 rabbit anti-goat IgG (1:200 dilution; Invitrogen). After another three washes in PBS, sections were mounted on gelatin-coated slides, air dried, dehydrated in toluene, and coverslipped. Slides were examined with a confocal microscope (LSM 510 META; Zeiss).
In a second series of experiments, the contribution of each component of the quenching solution to the fluorescent labeling was analyzed. Thus, four serial brainstem sections from the same five animals used previously were treated with NaBH4, and after three washes in PB followed by an additional three washes in PBS, the sections were sorted into four groups, each of which was incubated in one of the following solutions: (1) PBS only (negative control); (2) 50% ethanol; (3) 0.3% H2O2 in deionized water; and (4) 50% ethanol plus 0.3% H2O2. After incubation, all sections were again rinsed three times in PBS and then processed for two-color fluorescence labeling. Once sections were mounted as described above, slides were analyzed with confocal microscopy. One image of the cholinergic mesopontine tegumentum was captured per section, with the same acquisition settings in all cases. Since neurons displayed different degrees of intensity, three to four neurons that showed higher luminosity were selected; their intensities were calculated with the formula S (intensity × absolute frequency)/S absolute frequency, and the mean value for the image was obtained. Likewise, three to four neurons with a lighter labeling were randomly selected and the same calculations were made. Statistical comparisons of the mean values were carried out among the four different groups, using the Friedman non-parametric k-dependent samples test, followed by a Wilcoxon test with Bonferroni's correction (SPSS software, version 15.0).
The neuropil intensity was also measured, both in the red and the green channels. Three to four areas devoid of neurons, consisting of only fiber-containing neuropil, were chosen and delineated in the same images previously acquired from the mesopontine tegmentum, and the intensities were obtained with the same software and formula as described above. Mean values from each section were then calculated, and statistical comparisons were carried out among the four different groups using the Friedman test and followed by the Wilcoxon test with Bonferroni's correction (SPSS software, version 15.0).
The possible effect of the components of the quenching solution after NaBH4 treatment was also tested with unlabeled tissue. Thus, four serial brainstem sections from the same five rats were selected, treated with NaBH4 and rinsed, sorted into four groups, and incubated for 30 min at room temperature in one of the four solutions mentioned above. After incubation, all sections were rinsed three times in PBS and mounted as described above. Slides were analyzed using a regular epifluorescence microscope (Eclipse E800M model; Nikon, Tokyo, Japan).
Results
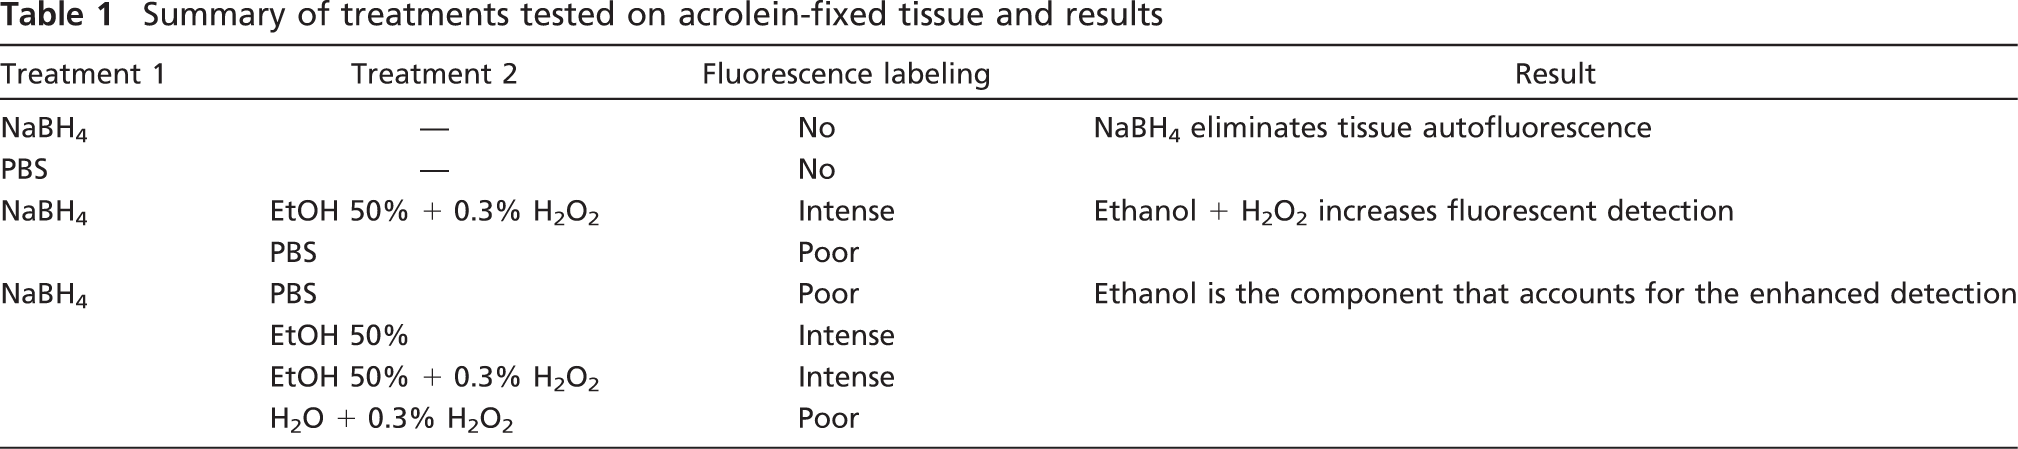
To determine whether double-labeling fluorescence techniques could be successfully performed on acrolein-fixed tissue, we first tested the effect of pretreatment with NaBH4 on both unlabeled and fluorescence-labeled sections. In subsequent experiments, the effect of a quenching solution was analyzed after two-color fluorescence labeling. A summary of the different trials and their results is shown in Table 1.
Summary of treatments tested on acrolein-fixed tissue and results
Effect of Pretreatment With NaBH4 on Tissue Fluorescence After Acrolein Fixation
Qualitative observation of acrolein-fixed sections with a fluorescence microscope revealed a strong tissue fluorescence, consistent with previous reports showing autofluorescence produced by other strong fixatives like glutaraldehyde (Figures 1A and 1C). In contrast NaBH4-treated sections displayed little or no auto-fluorescence (Figures 1B and 1D). In a quantitative analysis, the mean values of fluorescence intensity in NaBH4-treated sections were, in all cases, much lower than those in non-treated sections, both in the green and the red channels (Figures 2A and 2B). The statistical comparison between the two groups showed that fluorescence in non-treated sections was significantly higher than in the treated ones (Wilcoxon test, p=0.043 for both channels). These results show that pretreatment with NaBH4 efficiently reduces tissue fluorescence due to acrolein fixation. However, sporadic cells exhibiting strong autofluorescence were occasionally observed in close relationship to blood vessels (Figures 1A–1D, arrows and arrowheads).
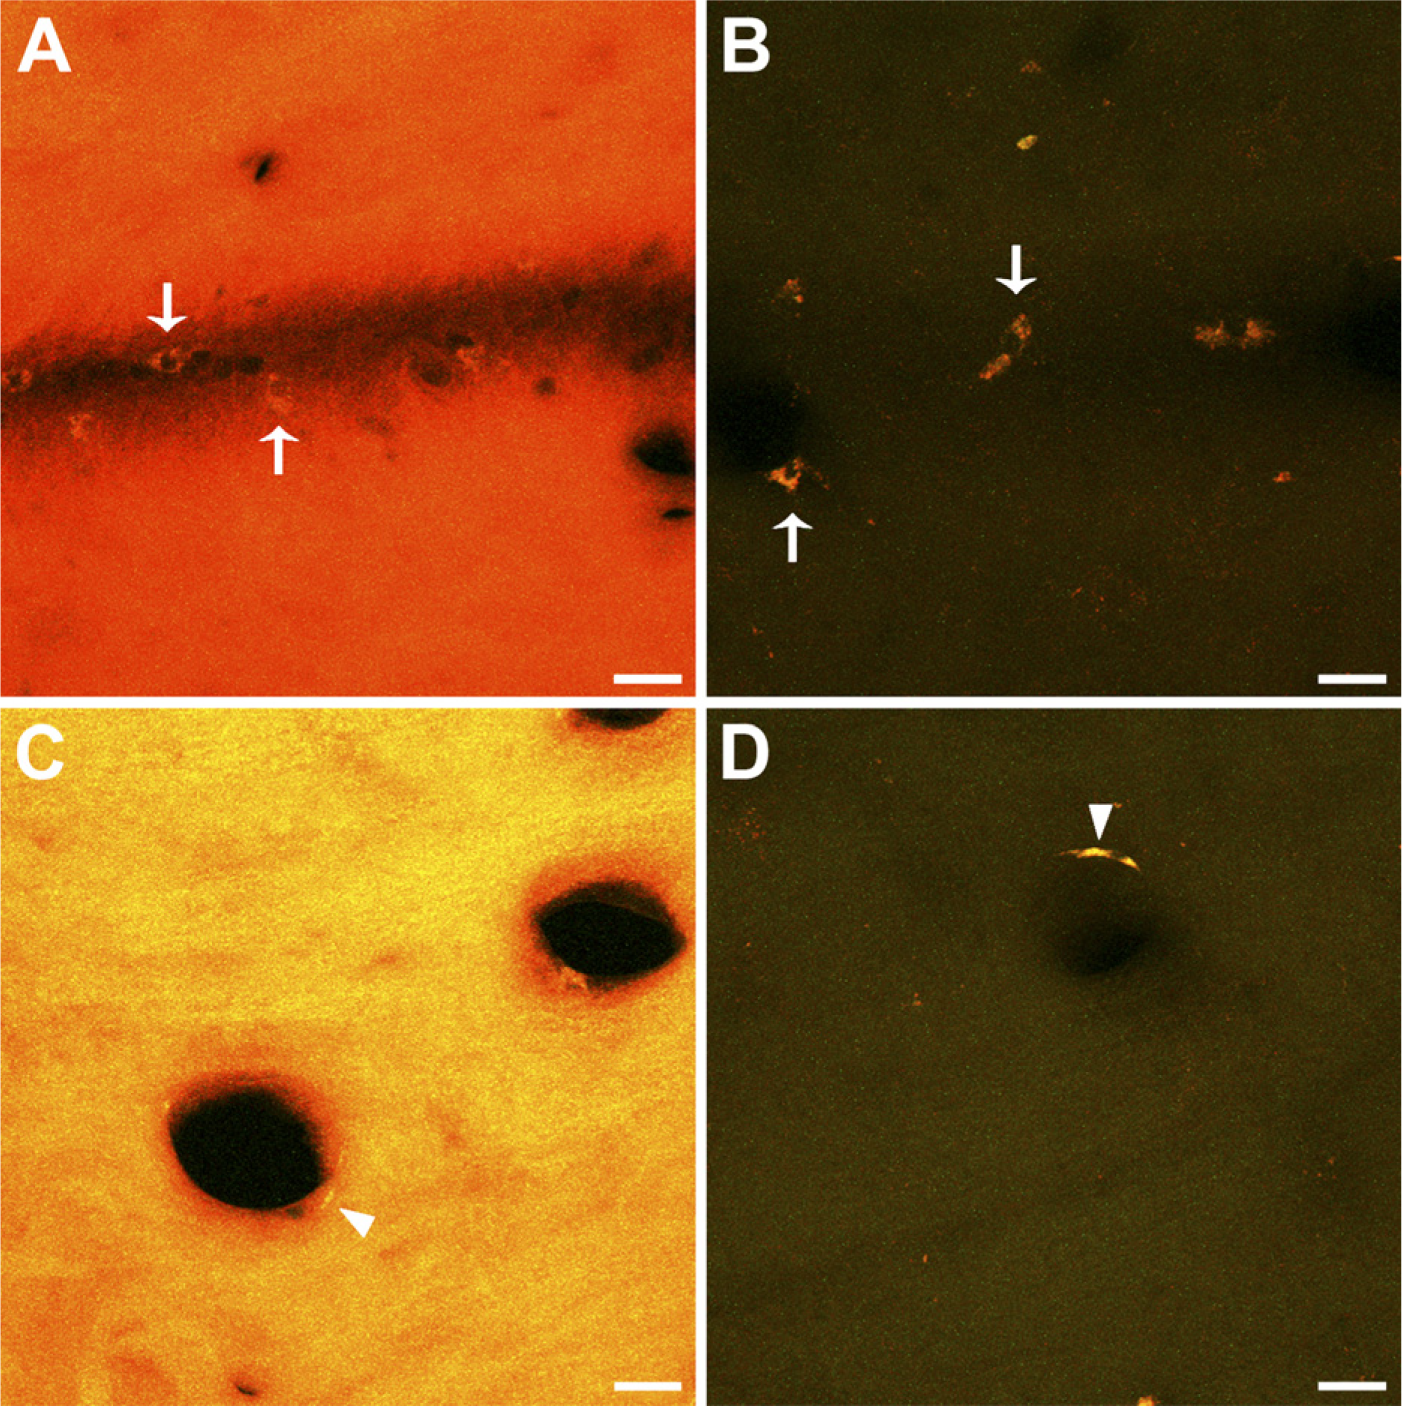
Effect of sodium borohydride pretreatment on unlabeled acrolein-fixed sections. Representative confocal microscopy stacks from pairs of adjacent sections from different animals, obtained with the same scanning settings, are shown. (
Effect of Incubation in an H2O2 Solution on Fluorescence Labeling
Two-color fluorescence labeling was then carried out with another set of sections previously treated with NaBH4. ChAT-labeled neurons were visible in the red channel and BDA-containing fibers were observed in the green channel. Since immunofluorescence detection of in situ hybridization is enhanced by prior incubation in a quenching solution (Barroso-Chinea et al. 2007), we determined whether the two-color fluorescence labeling would benefit from incubation in a 50% ethanol solution plus H2O2. Indeed, qualitative observations showed that incubation in the ethanol/H2O2 solution enhanced the fluorescence detection of labeled neurons and fibers (Figures 3A and 3B). In further experiments designed to quantitatively determine the improved detection, and also whether a single component of the incubation solution was causing it, the intensity of both neurons and neuropil was estimated, analyzing intensely labeled and lightly labeled neurons separately. Comparisons of mean values among groups showed statistically significant differences within both populations (Friedman test, p=0.014 and p=0.021, intensely labeled and lightly labeled neurons, respectively). Comparisons between groups revealed no differences, either between PBS and H2O2 in water or between ethanol only and ethanol plus H2O2 (Wilcoxon test, p=0.345, and p=0.138, intensely labeled neurons, respectively; p=0.50, p=0.56, lightly labeled neurons, respectively), suggesting that H2O2 is not the cause of the enhanced detection of neurons. In contrast, a trend toward a statistically significant difference was found between PBS and ethanol plus H2O2 and also between ethanol plus H2O2 and H2O2 in water, in both intensely labeled and lightly labeled neurons (Wilcoxon test, p=0.043, and p=0.043, intensely labeled neurons; p=0.08, and p=0.043, lightly labeled neurons, respectively), indicating that the presence of ethanol is likely to account for the enhanced neuronal labeling.
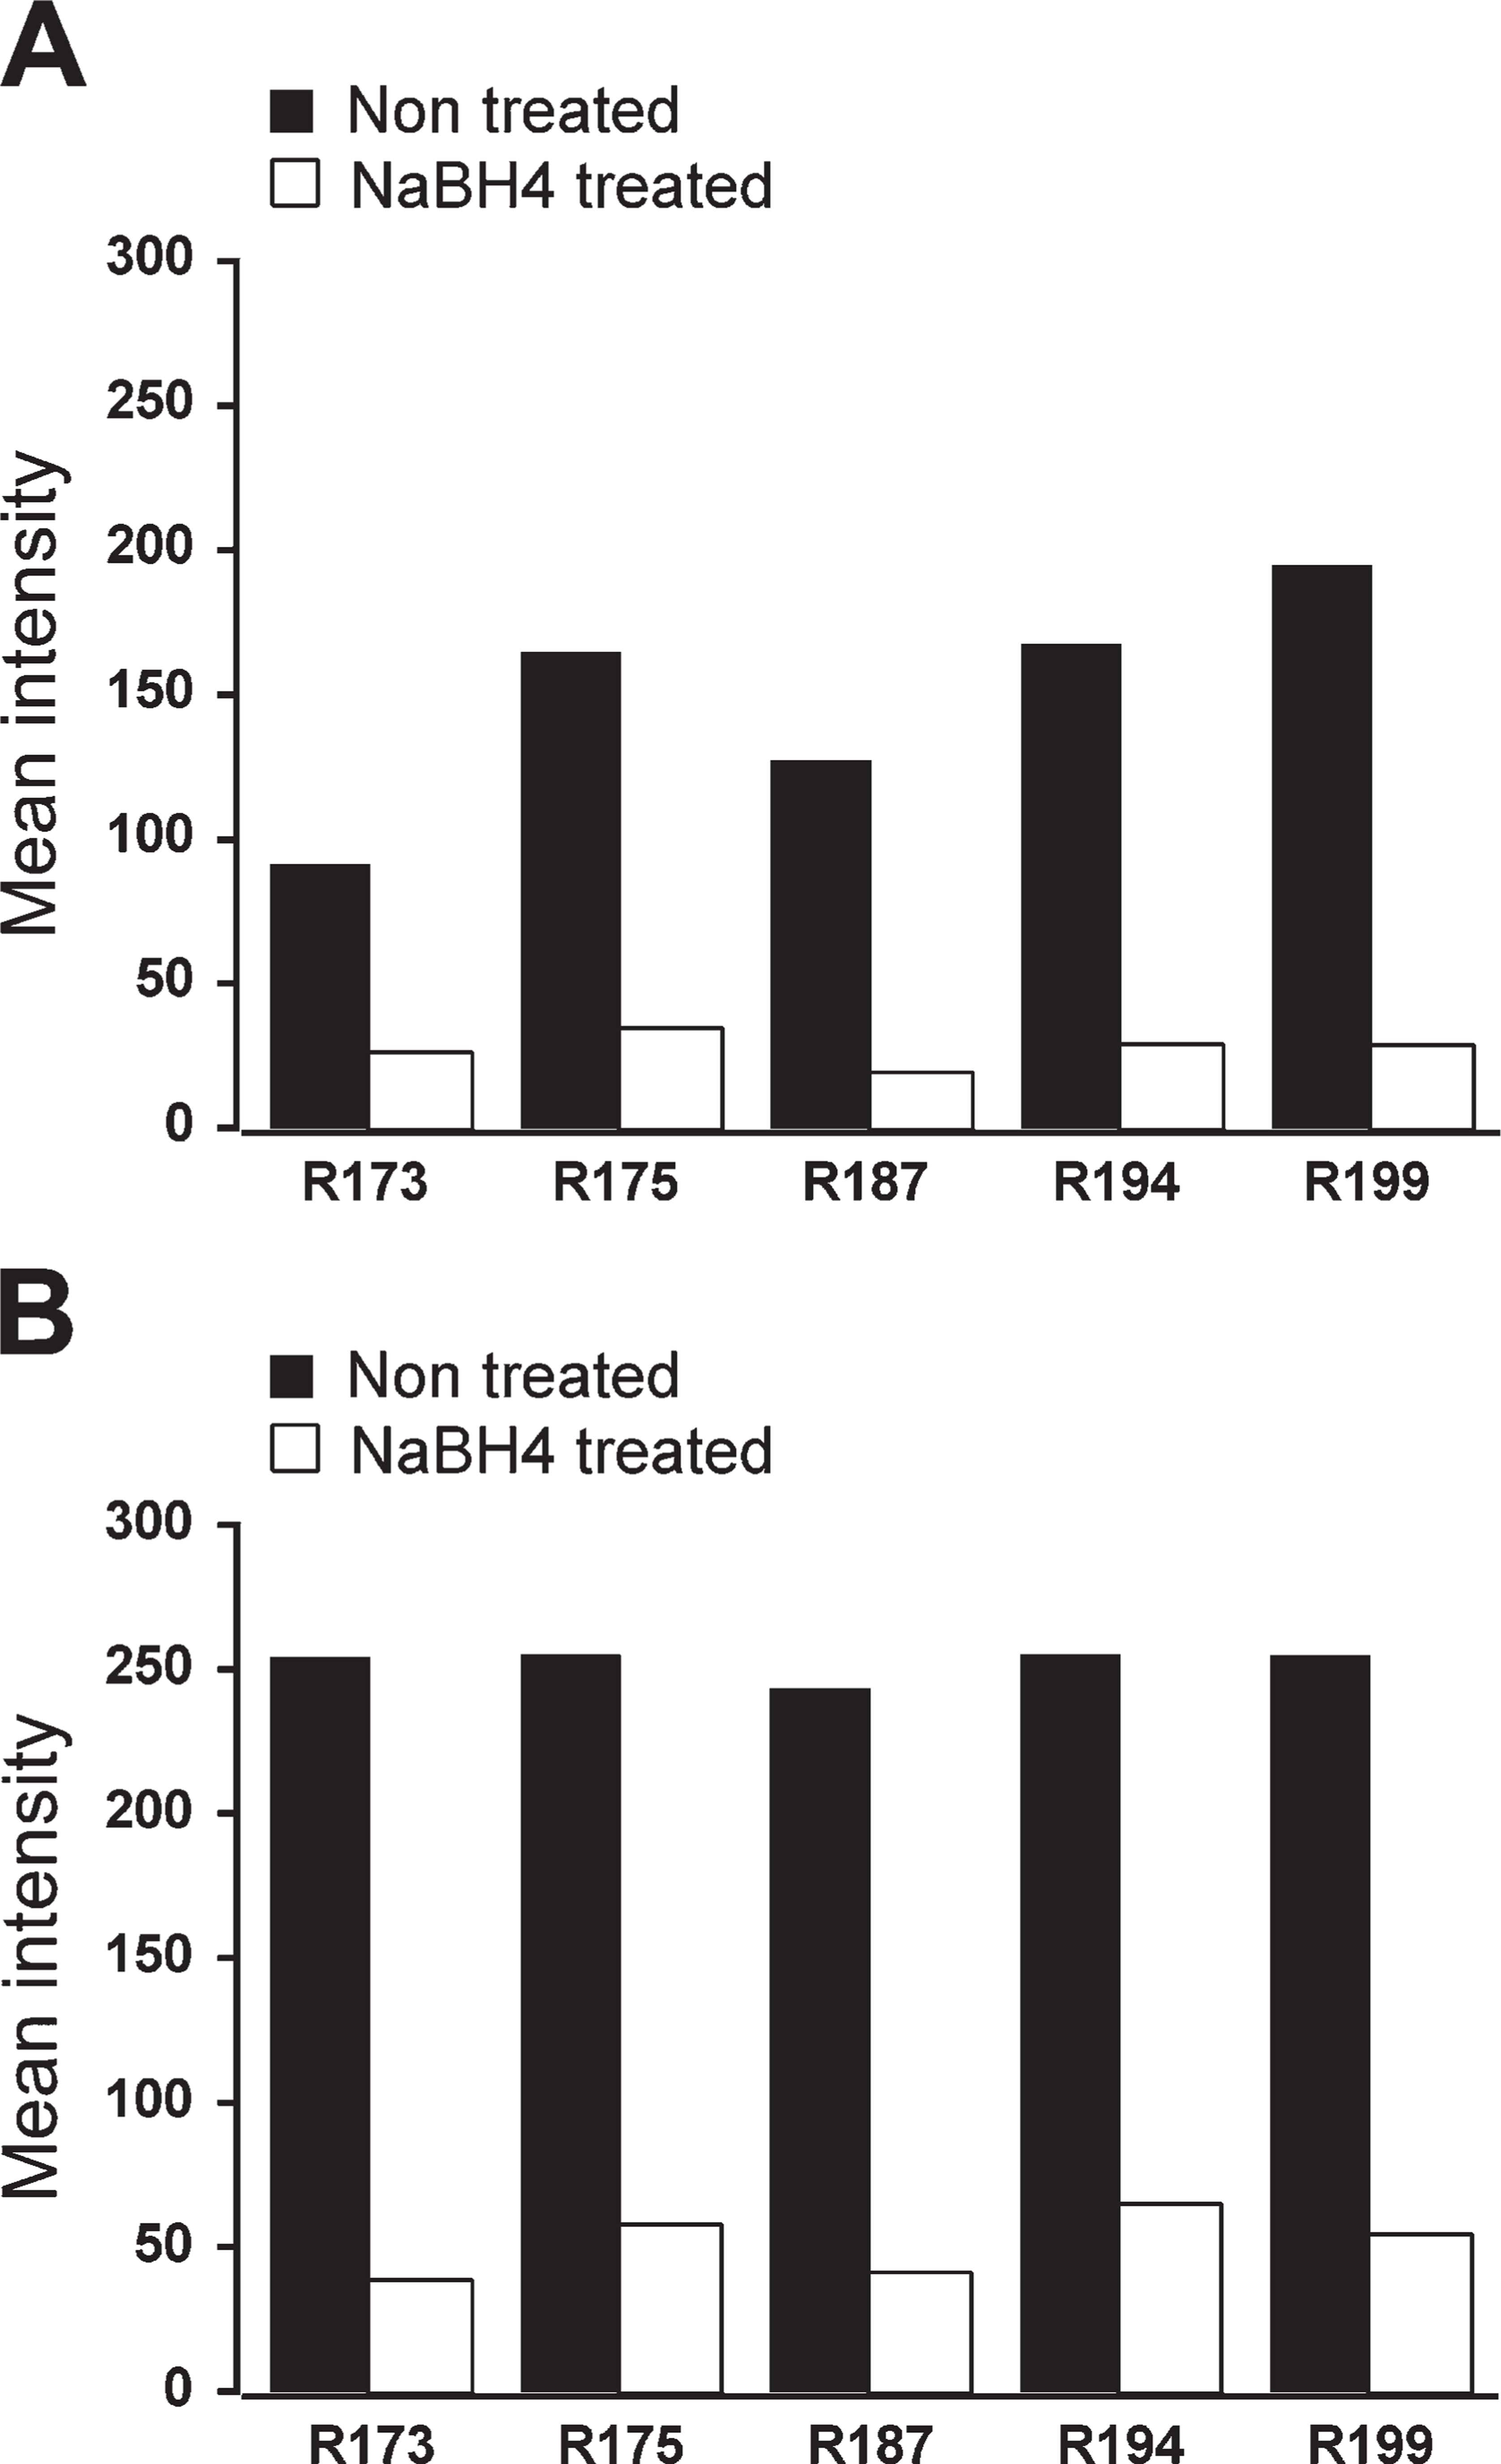
Graphs show mean intensity values in NaBH4-treated (gray) vs non-treated (black) unlabeled sections from five animals. Mean intensity values ranged from 0 (black) to 255 (maximum intensity). (
In relation to the neuropil, mean values were also obtained in the green and the red channels. Comparisons of mean values showed no differences among the four groups in the red channel (Friedman test, p=0.266), although a statistically significant difference was observed in the green channel (Friedman test, p=0.006), consistent with the qualitative observation of enhanced detection of green BDA-labeled fibers. Comparisons between groups showed no differences, either between PBS and H2O2 in water or between ethanol only and ethanol plus H2O2, as previously observed for labeled neurons. In contrast, a trend toward a statistically significant difference was found again in PBS vs ethanol plus H2O2 and between ethanol plus H2O2 and H2O2 in water (Wilcoxon test, p=0.043 and p=0.043, respectively). Thus, ethanol seems to be contributing significantly to the enhanced fiber labeling in the green channel.
Effect of the H2O2 Solution on Unlabeled Tissue
As noted above, sporadic autofluorescent cells continued to be present after NaBH4 treatment, which were in sharp contrast to the dark background. Some cells resembled blood cells and appeared mainly along longitudinally sectioned blood vessels, adhered to remnants of blood vessel wall (Figure 1B, arrows). Other cells had an elongated cell body that lined the blood vessel lumen, suggesting an endothelial cell phenotype (Figure 1D, arrowhead). Subsequent incubation of NaBH4-treated sections in the quenching solution or each of its components showed no effect of either ethanol or H2O2 or both on removal of cell auto-fluorescence (Figure 4). However, blood vessels were scarce within individual sections and only occasionally fell within the area of interest. Moreover, the morphology and location of the autofluorescent cells were obviously distinguishable from the labeled neurons and fibers and did not interfere with them.
Discussion
In the present study we report a simple procedure that allows fine visualization of two fluorescent markers in acrolein-fixed brain tissue. Antigenicity was preserved despite the potency of the fixative; the background fluorescence produced by the fixative was virtually eliminated; and the fluorescent signal was enhanced, providing clear detection of thin fibers and neurons.
Preservation of Antigenicity After Acrolein Fixation
To our knowledge, few studies have used acrolein as a fixative for fluorescence labeling. One of the few studies reported that fixation of cell cultures with 0.1% acrolein for 1 h at room temperature eliminated antigenicity (van den Eijnden-van Raaij et al. 1988). However, much faster acrolein fixation achieved by perfusion preserves antigenicity in brain tissue subsequently analyzed by EM (Leranth and Pickel 1989; Mengual and Pickel 2002). We now report a procedure for obtaining excellent fluorescence labeling with anti-ChAT antibodies after a similarly fast perfusion with acrolein, which differs from the procedure described in a previous report (Leranth and Pickel 1989) for unknown reasons.
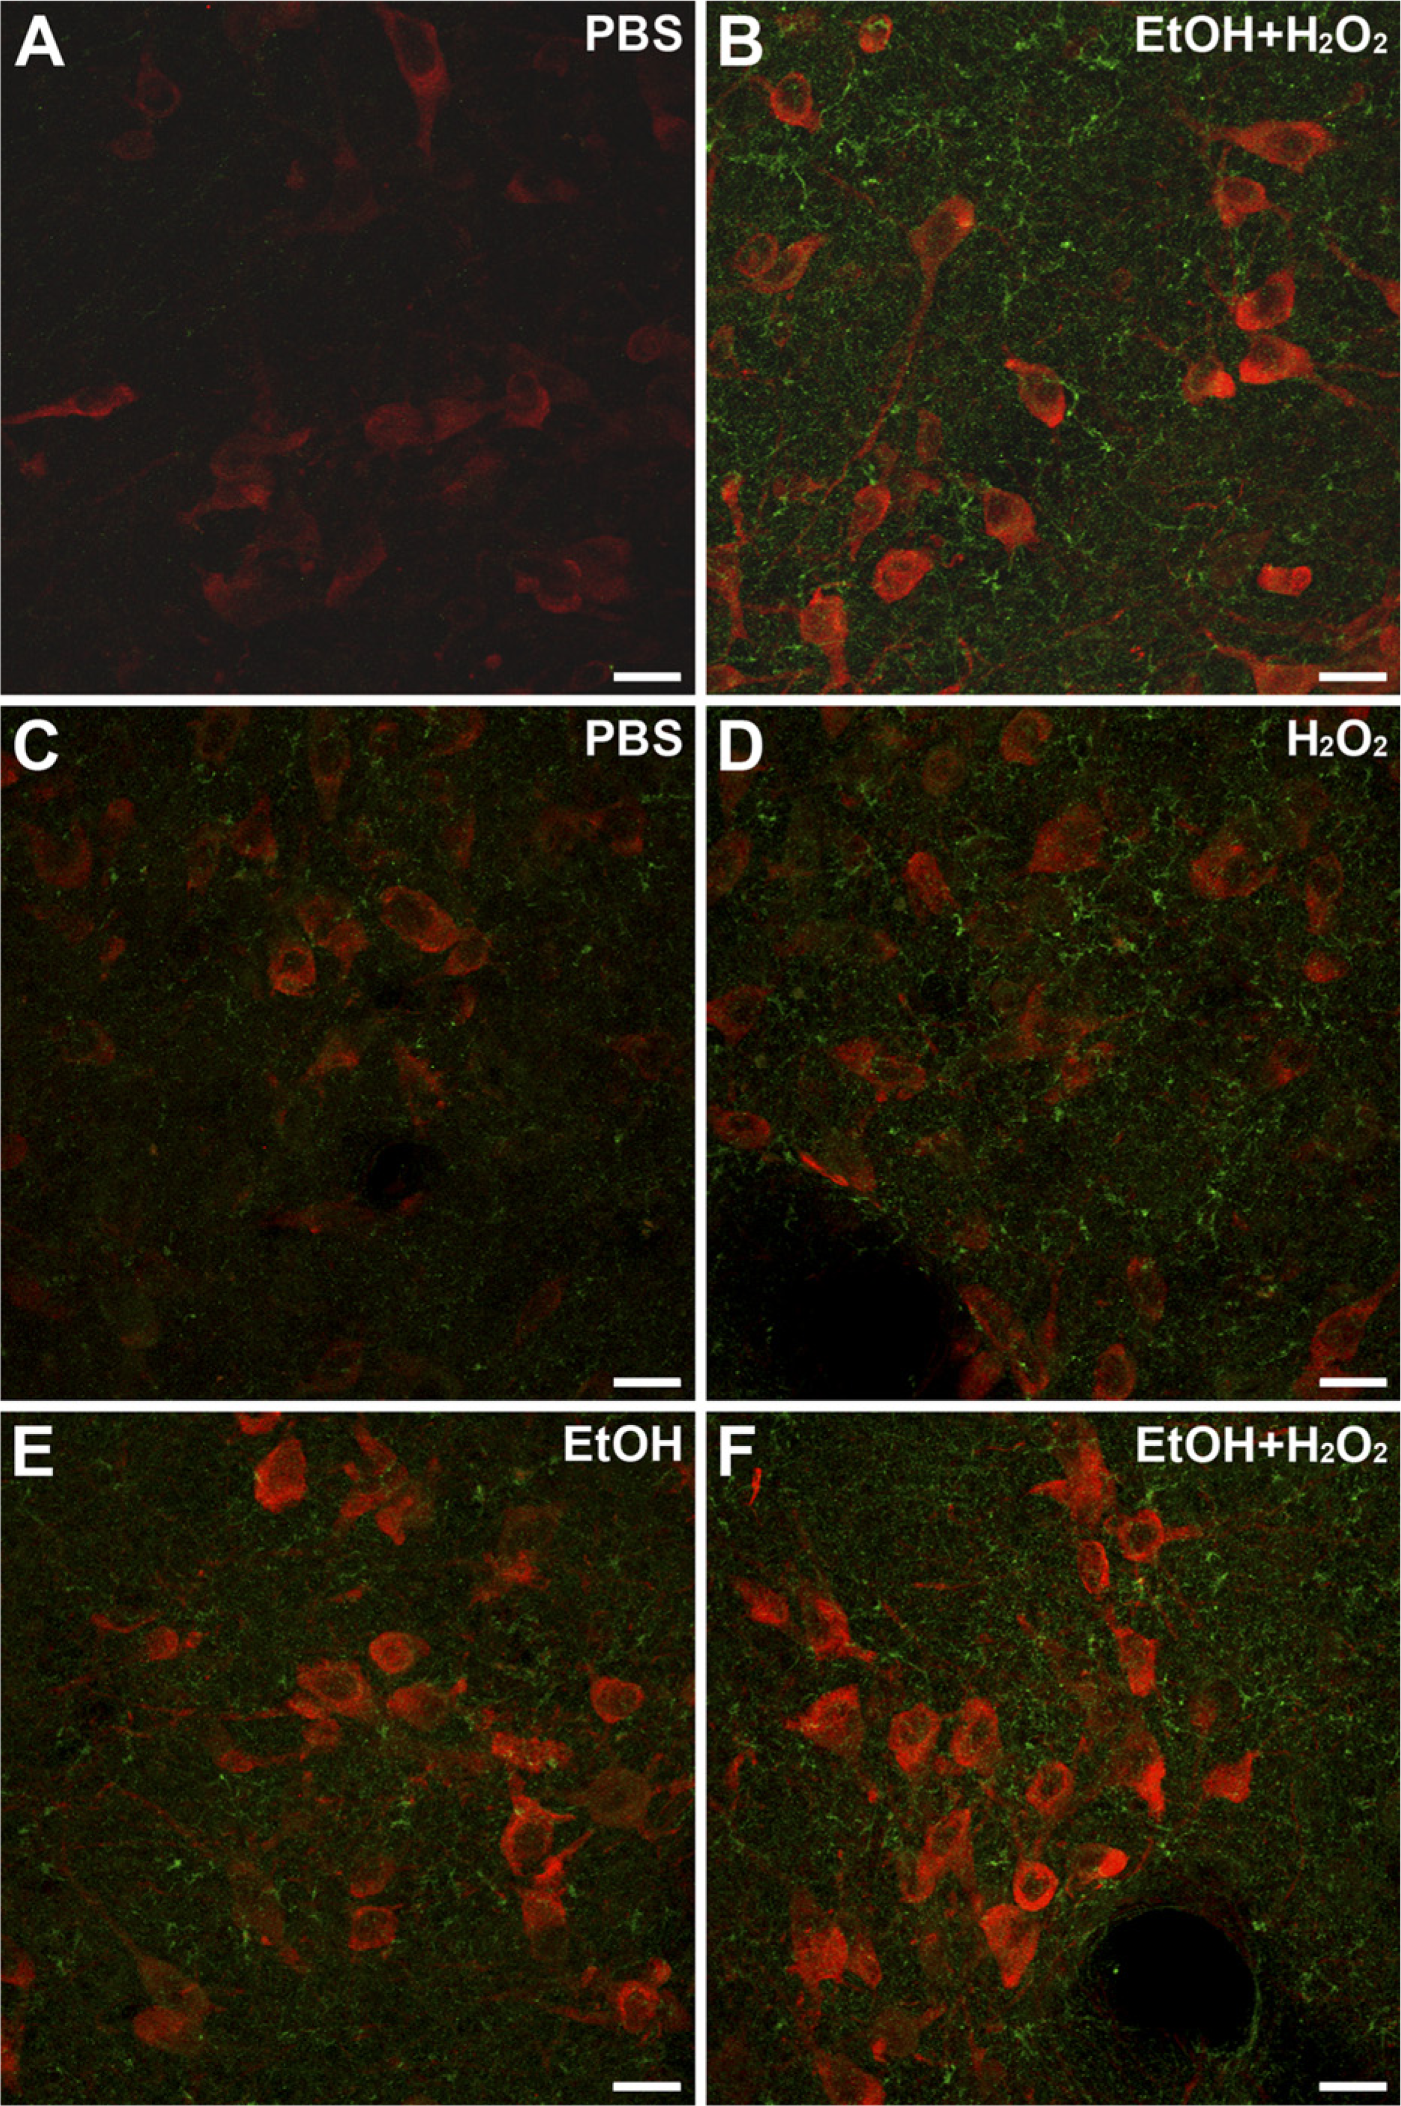
Effects of incubation in ethanol plus H2O2, ethanol only, or H2O2 only, on two-color fluorescence labeling. (
Effect of Sodium Borohydride Pretreatment on Acrolein vs Glutaraldehyde Autofluorescence
Aldehyde fixatives typically give rise to tissue fluorescence (Cande et al. 1977; Weber et al. 1978; Clancy and Cauller 1998), which seems to be due to the formation of conjugated Schiff bases between aldehydes and amino groups of proteins yielding fluorescent compounds (Nascimento and Cilento 1989; Tuma et al. 1991; García Fraile and Teso Vilar 1992; Hoffmann et al. 1993). The use of the aldehyde-reducing agent NaBH4 in aqueous solution (Abdel-Akher et al. 1952; Schachner et al. 1977) has provided modest reductions in tissue fluorescence produced by glutaraldehyde (Weber et al. 1978; Beisker et al. 1987; Hirsch and Helke 1988; Clancy and Cauller 1998; Haraguchi and Yokota 2002; Ngwenya et al. 2005). In addition, conveniently, NaBH4 has also been used frequently during sample processing for EM studies after acrolein fixation (Leranth and Pickel 1989; Mengual and Pickel 2002) but has not been previously tested alone as a single treatment for reducing tissue autofluorescence. In the present study, we used the same protocol (Mengual and Pickel 2002, 2004) and found a dramatic reduction in the autofluorescence induced by acrolein fixation, which enabled fine detection of both cholinergic neurons and BDA-containing fibers. The autofluorescence reduction did not require treatment with sodium metaperiodate prior to NaBH4 treatment, as reported for the single study carried out with brain tissue after acrolein fixation (Hirsch and Helke 1988).
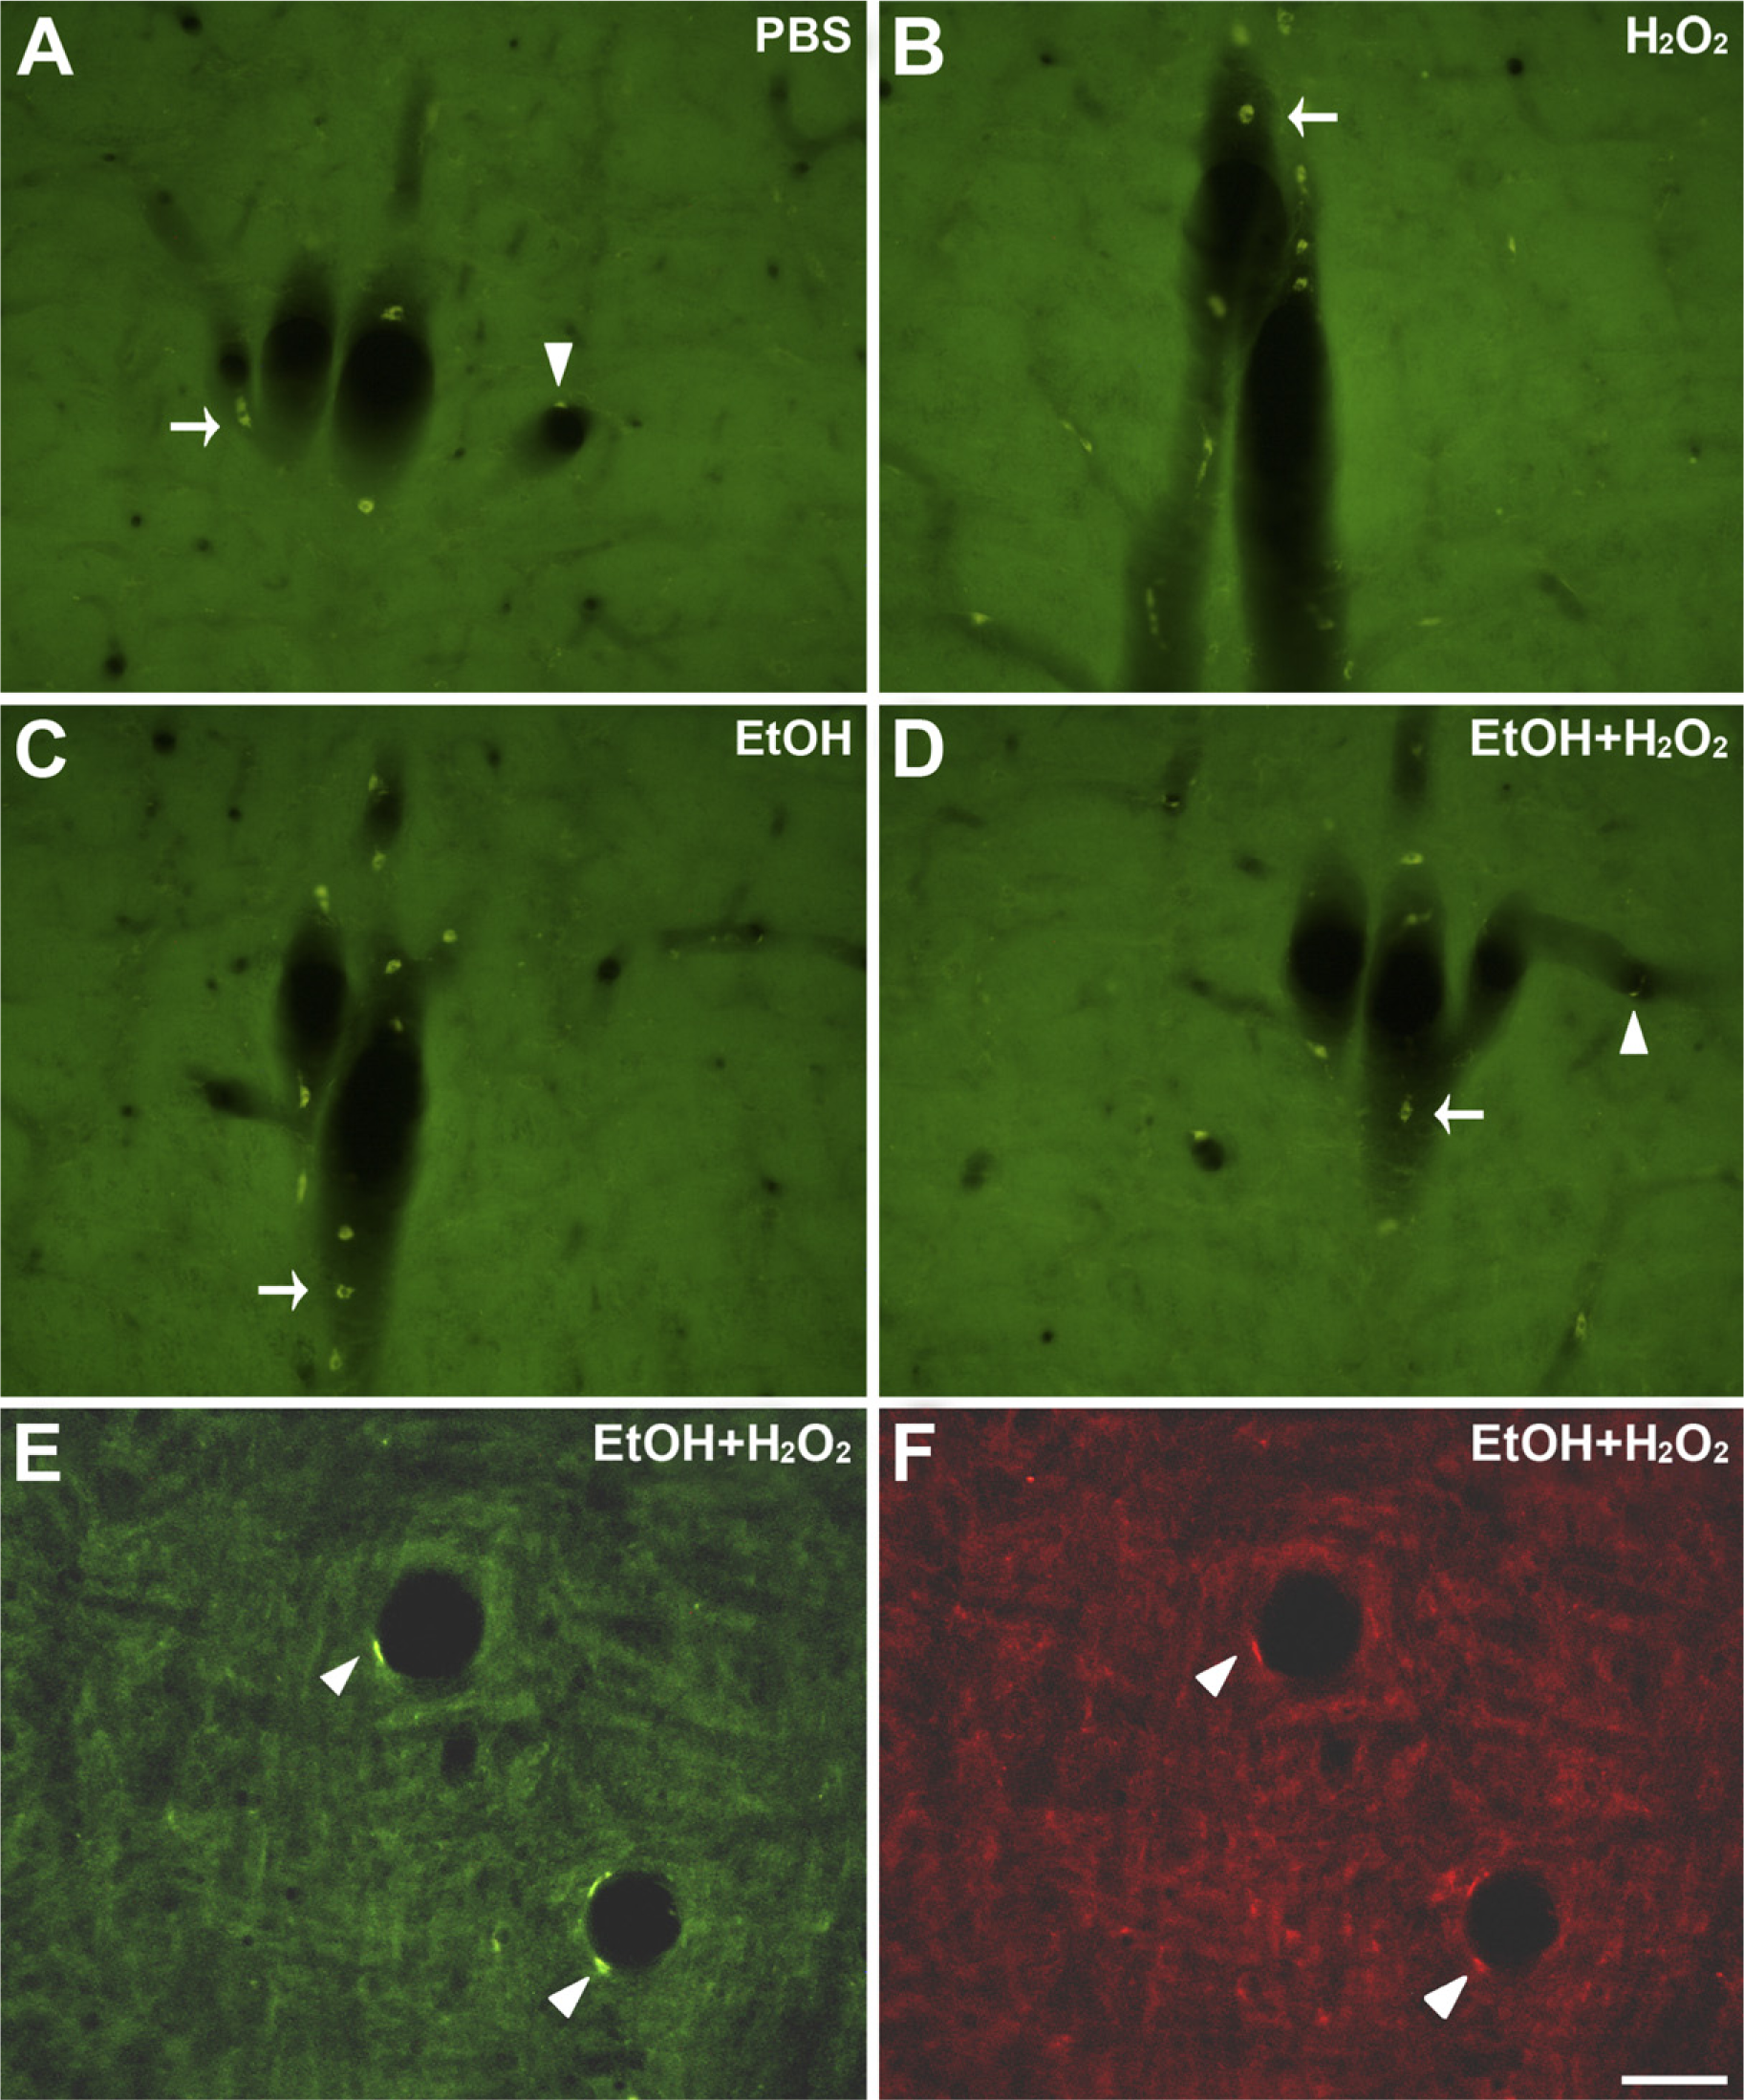
Effect of incubation in ethanol plus H2O2, ethanol only, or H2O2 only, on autofluorescent cells in NaBH4-treated acrolein-fixed sections. (
Autofluorescence is removed by NaBH4 most likely by reduction of Schiff bases formed after reaction of aldehydes with an amino group, which then become non-fluorescent (Beppu et al. 1987); the alternate possibility that NaBH4 instead reduces alkenes is considered unlikely (Morrison and Boyd 1976). However, why NaBH4 is much better at eliminating autofluorescence in acrolein-fixed than in glutaraldehyde-fixed tissue is not known. One possibility is the 2x faster tissue penetration speed of acrolein (Saito and Keino 1976). The longer time needed by glutaraldehyde to stabilize proteins may promote, or be caused by, formation of additional bonds with its free aldehyde group, creating steric impediments for NaBH4 penetration; this would require longer exposure time to the reducing agent, thereby altering the compromise between reduction of autofluorescence and quality of the tissue (Clancy and Cauller 1998; Ngwenya et al. 2005). In addition, since we do not know the amount of reducible Schiff base formed from glutaraldehyde in the tissue, the amount of NaBH4 used could be stoichiometrically insufficient to reduce all susceptible bonds, which would be more abundant in the case of glutaraldehyde (including imine and carbonyl groups). On the other hand, differences in concentrations and volumes of fixative cannot be ruled out. In any case, our observation that acrolein autofluorescence is totally abolished with incubation in 1% NaBH4 without altering the quality of the tissue, whereas glutaraldehyde autofluorescence is not, even with a longer incubation (Clancy and Cauller 1998; Ngwenya et al. 2005), suggests that acrolein may be a more convenient fixative than glutaraldehyde for fluorescence labeling techniques.
Enhancement of the Fluorescence Signal After Incubation in Ethanol and H2O2
We additionally found that sections treated with ethanol prior to fluorescence labeling displayed an enhanced signal in comparison to control sections, in both neuronal bodies and thin fibers. This is consistent with many reports that ethanol and methanol enhance tissue penetration of immunoreagents (Llewellyn-Smith and Minson 1992; Deere et al. 1998; Krutzik and Nolan 2003; Yokouchi et al. 2003; Pearson et al. 2007). Other treatments have also been used to facilitate penetration of immunoglobulins into the tissue, such as preincubation with dimethylsulfoxide (King et al. 1983). The results, however, are not comparable, since only cell bodies, and not fibers, were labeled in the single report that used dimethylsulfoxide on acrolein-fixed tissue (Hirsch and Helke 1988).
Lack of Effect of Ethanol or H2O2 on Artifactual Autofluorescent Cells
Scattered autofluorescent cells could occasionally be observed in close relation with blood vessels in non-treated and in NaBH4-treated sections. This is consistent with a previous study reporting resilient autofluorescence in blood cells, as well as in pial cells, after NaBH4 treatment in glutaraldehyde-fixed tissue (Clancy and Cauller 1998). The present study adds putative endothelial cells to the list of cell types displaying autofluorescence that was not removed with NaBH4 treatment. Moreover, neither ethanol nor H2O2 had any effect on this artifactual fluorescence. Blood cells display autofluorescence that increases after aldehyde fixation (Hoffman and Hansen 1981; Nascimento and Cilento 1989; Stewart and Stewart 2001; Stewart et al. 2007), and endothelial cells are known to contain lipofuscin (Lamar et al. 1980; Monma et al. 1988), a molecule that has a characteristic fluorescence with broad excitation and emission spectra (Mochizuki et al. 1995; Marmorstein et al. 2002). Lipofuscin pigment appears to be the fluorescent end product of a free radical-induced cross-linking of proteins with oxidized lipids (Kikugawa and Beppu 1987). Brain lipofuscin is not eliminated by incubation with either H2O2 or NaBH4 but only by treatment with CuSO4 (Schnell et al. 1999). In our sample sections, endothelial fluorescence was detected in both the green and the red ranges, although less intensely in the last range, consistent with the emission spectrum of lipofuscin.
In summary, we have developed a simple protocol that allows simultaneous detection of two markers by means of two-color fluorescence labeling in acrolein-fixed brain tissue. A pretreatment with 1% NaBH4 for 30 min eliminates the background autofluorescence otherwise produced by acrolein, whereas subsequent incubation in 50% ethanol for 30 min greatly enhances the detection of specific fluorescence labeling. This new protocol enables high-quality detection of markers on acrolein-fixed tissue by using fluorescence labeling, hence, broadening the technical approaches that can be used with acrolein-fixed tissue, which to date has been used almost exclusively for EM studies. Furthermore, the two approaches can be performed in parallel, with different, including adjacent, tissue sections from the same experiment.
Footnotes
Acknowledgements
This work was supported by the Spanish Ministry of Education and Science (MEC, BFU2004-06825), Gobierno de Navarra 2004, and the Unión Temporal de Empresas project CIMA.
The authors thank Pedro Barroso-Guinea for helpful technical comments, Carmen Sanmartín for advice on organic chemistry, and Isabel Pérez-Otaño and John F. Wesseling for critical reading of the manuscript.