
Abstract
Matrix metalloproteinases (MMPs) and tissue inhibitors of metalloproteinases (TIMPs) regulate extracellular matrix turnover throughout the body, including in renal glomeruli. We investigated protein levels of multiple MMPs (MMP-1, MMP-2, MMP-3, and MMP-9) and TIMP-1 in glomeruli and investigated whether disease phenotypes were associated with levels of these proteins. Renal cortex was collected from 100 adult autopsy subjects arrayed across 17 tissue microarrays. Immunohistochemical staining intensity for each MMP and TIMP-1 was determined using quantitative color deconvolution techniques. We observed significantly decreased glomerular MMP-1 and TIMP-1 staining in subjects with diabetes, hypertension, and an estimated glomerular filtration rate <30 ml/min/1.73 m2 in univariate analyses. MMP-1 staining, but not TIMP-1 staining, was inversely correlated with increased glomerular fibrosis (
Despite numerous animal models that describe MMP and TIMP alterations in glomeruli, there have been very few studies in human subjects. We undertook this study to examine glomerular MMP and TIMP protein levels in kidneys taken from 100 adults with a broad range of chronic diseases. We hypothesized that hypertension and diabetes would be associated with lower MMP and higher TIMP protein levels, based on animal data. We used vascular tissue microarrays (TMAs) and color deconvolution techniques to characterize the amount of each protein in the glomeruli and correlated these measures with clinical variables (Cornish and Halushka in press; Halushka et al. in press).
Materials and Methods
Study Population and Tissue Harvesting
One hundred adult autopsies were harvested at The Johns Hopkins Hospital or Bayview Medical Center. Numerous vascular tissues, including renal cortex, were taken from throughout the body, as described (Halushka et al. in press). Renal cortex was fixed in 10% neutral-buffered formalin (Cardinal Health; Dublin, OH) for a minimum of 24 hr, then processed and embedded in paraffin. Demographic and clinical information was collected from a review of patient medical records as described previously in detail (Halushka et al. in press). Glomerular filtration rate (GFR) was estimated from premortem serum creatinine values using the modification of diet in renal disease equation (Prigent 2008). GFR groups were defined as: group 1, >60 ml/min/1.73 m2; group 2, 30–60 ml/min/1.73 m2; and group 3, <30 ml/min/1.73 m2. This study was approved by the institutional review board of The Johns Hopkins Hospital.
Tissue Microarray Creation
Seventeen 99-core TMAs were created from 1683 vascular tissues. Duplicate cores of renal cortex were taken from each individual and placed on the same TMA, and a subset (17) of individuals had a third renal cortex core placed on an additional TMA, as an interslide control. Each core (feature) was 1.5 mm in diameter. Explanation of the creation and validation of the vascular TMAs has been presented previously in detail (Halushka et al. in press).
Immunohistochemistry and Routine Staining
IHC was performed using standard protocols described previously (Maleszewski et al. 2007). Briefly, slides were cut from each TMA block and kept in an airtight container at −20C until use. After deparaffinization and rehydration, slides were washed in PBS and treated with 3% H2O2 for 10 min. Slides were then serum blocked and incubated with MMP-1, MMP-2, MMP-3, MMP-9, TIMP-1, TIMP-2, or TIMP-3 antibodies (LabVision; Fremont, CA) using dilutions and antigen retrieval as described in detail previously (Maleszewski et al. 2007). Slides were then incubated with anti-rabbit secondary antibody (R and D Systems; Minneapolis, MN), followed by incubation with high-sensitivity streptavidin-horseradish peroxidase conjugate, and finally incubated with diaminobenzidine (DAB) chromagen for visualization (R and D Systems). Four-micron sections were cut from each TMA block and stained using Masson trichrome. Briefly, slides were placed in Bouin solution (1 hr at 56C; Richard Allen Scientific, Kalamazoo, MI), then stained with Weigert hematoxylin (10 min; Sigma-Aldrich, St. Louis, MO), followed by Biebrich scarlet-acid fuchsin (5 min; Sigma-Aldrich), phosphomolybdic/phosphotungstic acid solution (10 min; Sigma-Aldrich), and aniline blue (5 min; Sigma-Aldrich).
Digital Slide Scanning and Staining Quantification
Stained slides were digitized using a ScanScope CS (Aperio; Vista, CA) or an Automated Cellular Imaging System II (ACISII; Chromavision, Aliso Viejo, CA) at 200× magnification. Whole-slide images were segmented into separate core images for each tissue. Immunohistochemical staining for each protein was then analyzed using color deconvolution techniques as described (Cornish and Halushka in press). The core images were annotated using ImageJ macros (National Institutes of Health; Bethesda, MD), selecting only the glomeruli as regions of interest (ROI) in each vessel (Cornish and Halushka in press). A minimum of two selectable glomeruli from any given core was necessary for inclusion of the core in the analysis. Color deconvolution was then performed on each core image, separating the red/green/blue (RGB) image into hematoxylin and DAB dye components (Ruifrok and Johnston 2001). A single DAB threshold value of 90, separating background DAB from true staining, was selected empirically from prior usage (Halushka et al. 2009). For each core image, the sum of the intensity values in the ROI pixels above the brown threshold was then divided by the total area of the ROI, producing an average intensity value (“MMP-1 staining” or “TIMP-1 staining”) for each core, which is unitless.
Staining characteristics of MMPs and TIMPs
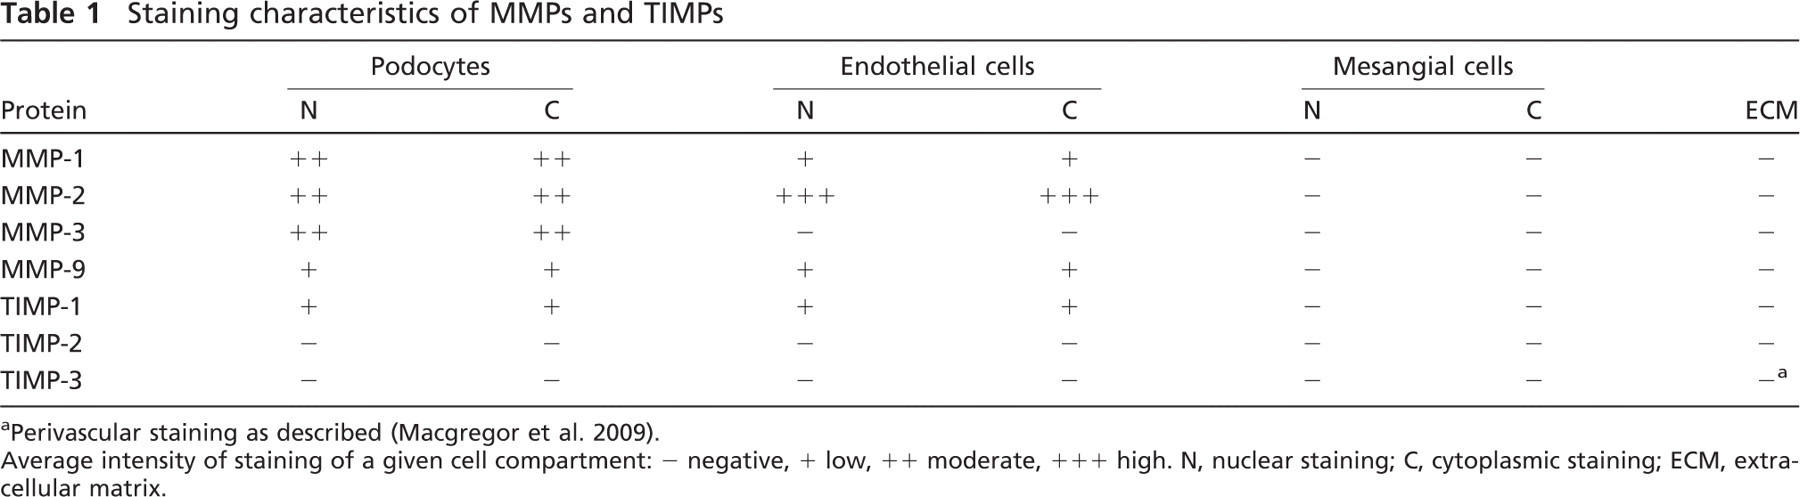
aPerivascular staining as described (Macgregor et al. 2009).
Average intensity of staining of a given cell compartment: - negative, + low, ++ moderate, +++ high. N, nuclear staining; C, cytoplasmic staining; ECM, extracellular matrix.
The Masson trichrome stain was used to determine percent fibrosis of the glomeruli from each subject using the program FrIDA (Cornish et al. 2008). FrIDA utilizes a freehand tool to select the ROI and HSB (hue-saturation-brightness) color space segmentation to select colors of interest. The collagen (fibrosis) area, which stains blue using the Masson trichrome, was captured using appropriate HSB color space ranges to select only “blue” pixels. The amount of tissue in each glomerular ROI was measured by segmenting all non-white pixels. The percent fibrosis in the glomerular ROIs was then calculated as the sum of “blue pixels” (area of fibrosis) divided by the sum of all non-white pixels (area of tissue).
Statistical Analysis
Statistical analyses were performed using
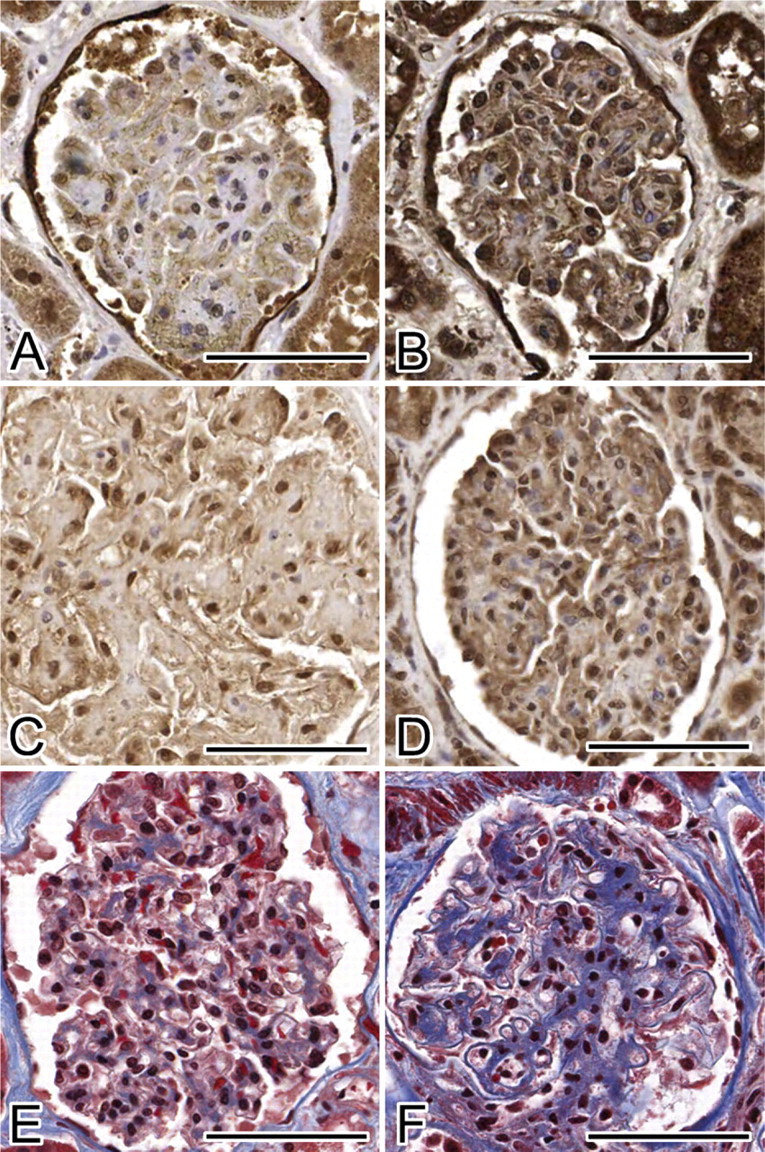
Matrix metalloproteinase-1 (MMP-1), tissue inhibitor of metallo-proteinase-1 (TIMP-1), and Masson trichrome glomerular staining. (
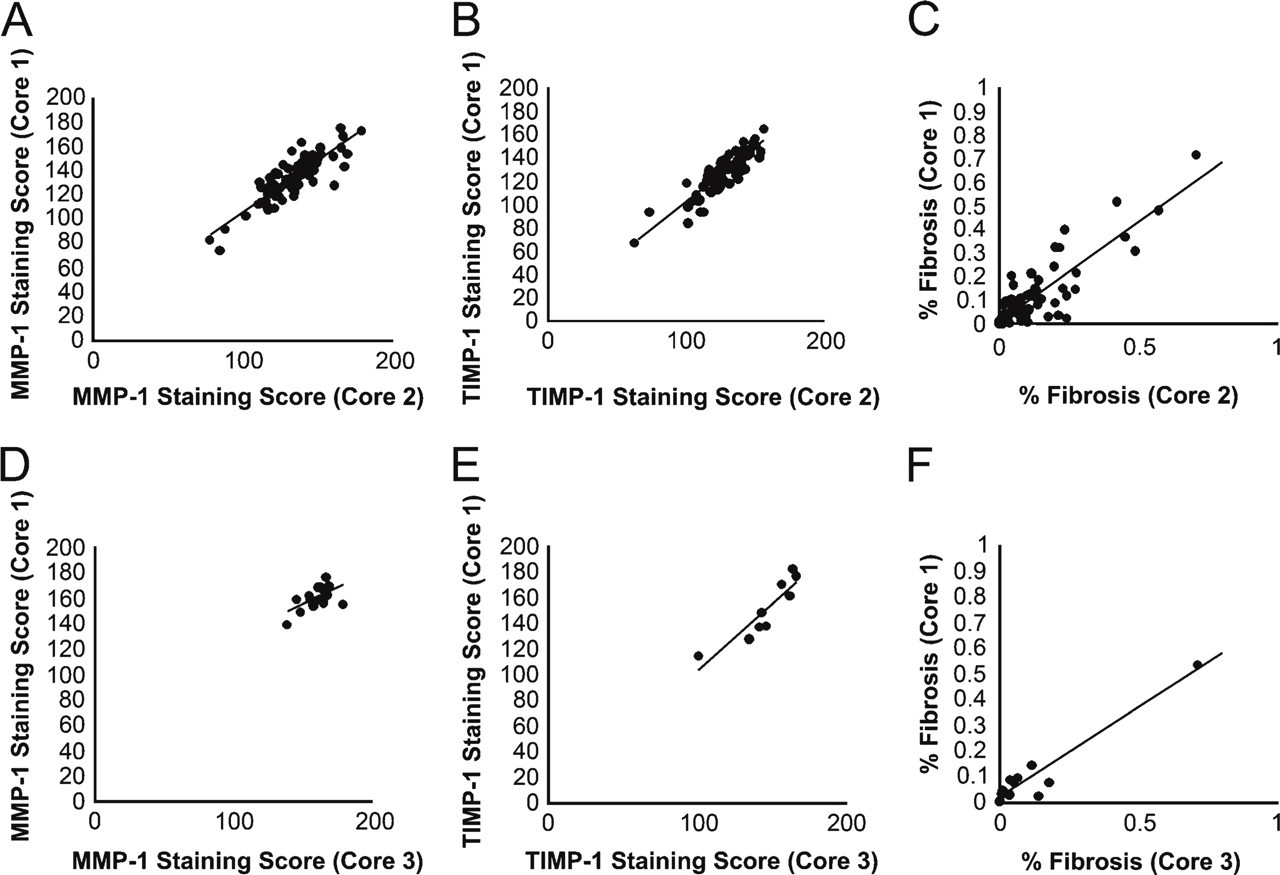
Replicate measures of MMP-1, TIMP-1, and glomerular fibrosis. (
Results
Study Population Characteristics
One hundred autopsy subjects were included in this study. Patients ranged in age from 20 to 101 years of age (mean 64 ± SD 16 years). The average postmortem interval (PMI) was 18 ± 6 hr (range, 4 to 28 h). Seventy-six subjects were Caucasian, 20 subjects were African-American, 2 subjects were Asian, and 2 subjects were Hispanic. Subjects were sequentially chosen based on a PMI of 28 hr or less and excluded if they had known HIV, active tuberculosis, hepatitis B, or hepatitis C infections. Thirty subjects had a previous diagnosis of diabetes (26 type 2 diabetes mellitus subjects, 3 steroid-induced diabetes subjects, and 1 type 1 diabetes mel-litus subject), and an overlapping 62 subjects were hypertensive. The average duration of diabetes was 9. 3 ± 8.0 years. Generally, 2 diabetic subjects, 2 non-diabetic, hypertensive subjects, and 2 non-diabetic, non-hypertensive subjects were placed on a single TMA. Levels of kidney function (based on estimated GFRs) were normal in 54 subjects (group 1), reduced in 27 (group 2), and severely reduced in 9 subjects (group 3). Ten subjects had an unknown estimated GFR.
Glomerular Staining Patterns of Different MMP and TIMP Antibodies
Staining varied by antibody in the different cell types comprising the glomeruli (Table 1) and was consistent with reported characteristics of these proteins (Figure 1) (Uhlen et al. 2005). Owing to a lack of glomerular staining, TIMP-2 and TIMP-3 were excluded from further analysis.
MMP-1 and TIMP-1 Had Robust Immunohistochemical Staining Results
We were able to generate quantitative glomerular staining values using our color deconvolution assay for MMP-1 (92 subjects) and TIMP-1 (87 subjects) (Cornish and Halushka in press). We also determined percent fibrosis values (utilizing Masson trichrome staining) for 94 subjects. The median number of glomeruli analyzed per feature (core) was 5. Because there were duplicated renal core tissues from each individual on one or more TMAs, we were able to correlate the staining between cores. We observed a strong correlation between two adjacent cores from the same individual on the same TMA (intraslide comparison) for MMP-1 (
Univariate analysis of MMP-1 and TIMP-1 glomerular staining by clinical characteristics
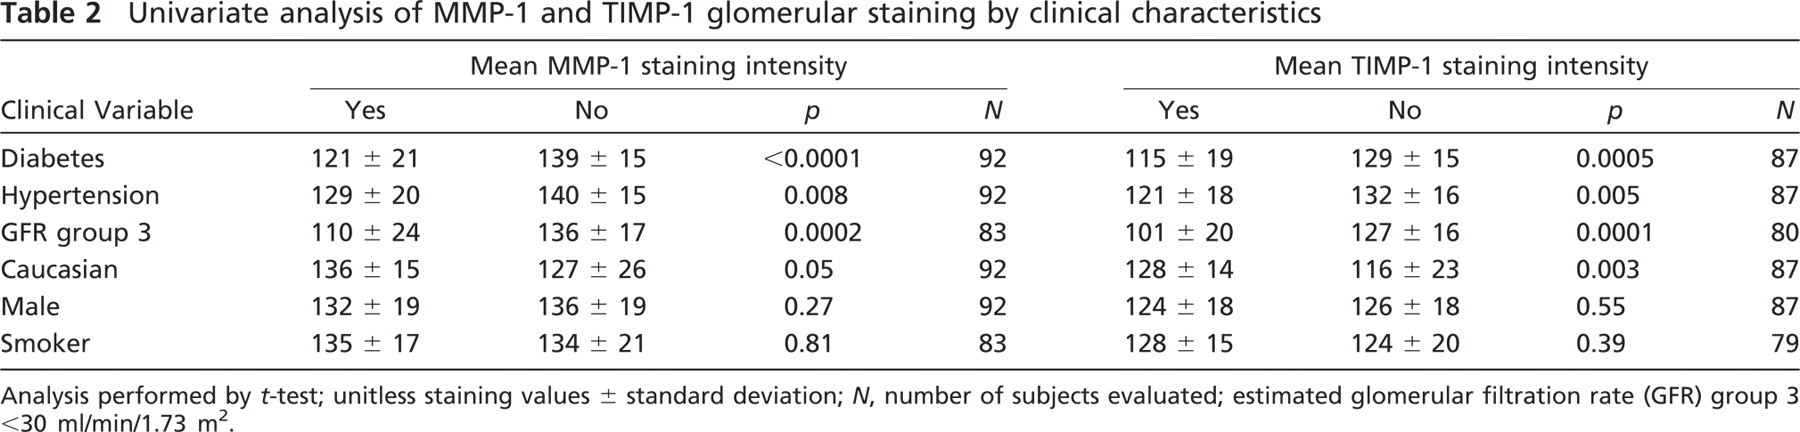
Analysis performed by
Univariate analysis of glomerular fibrosis by clinical characteristics
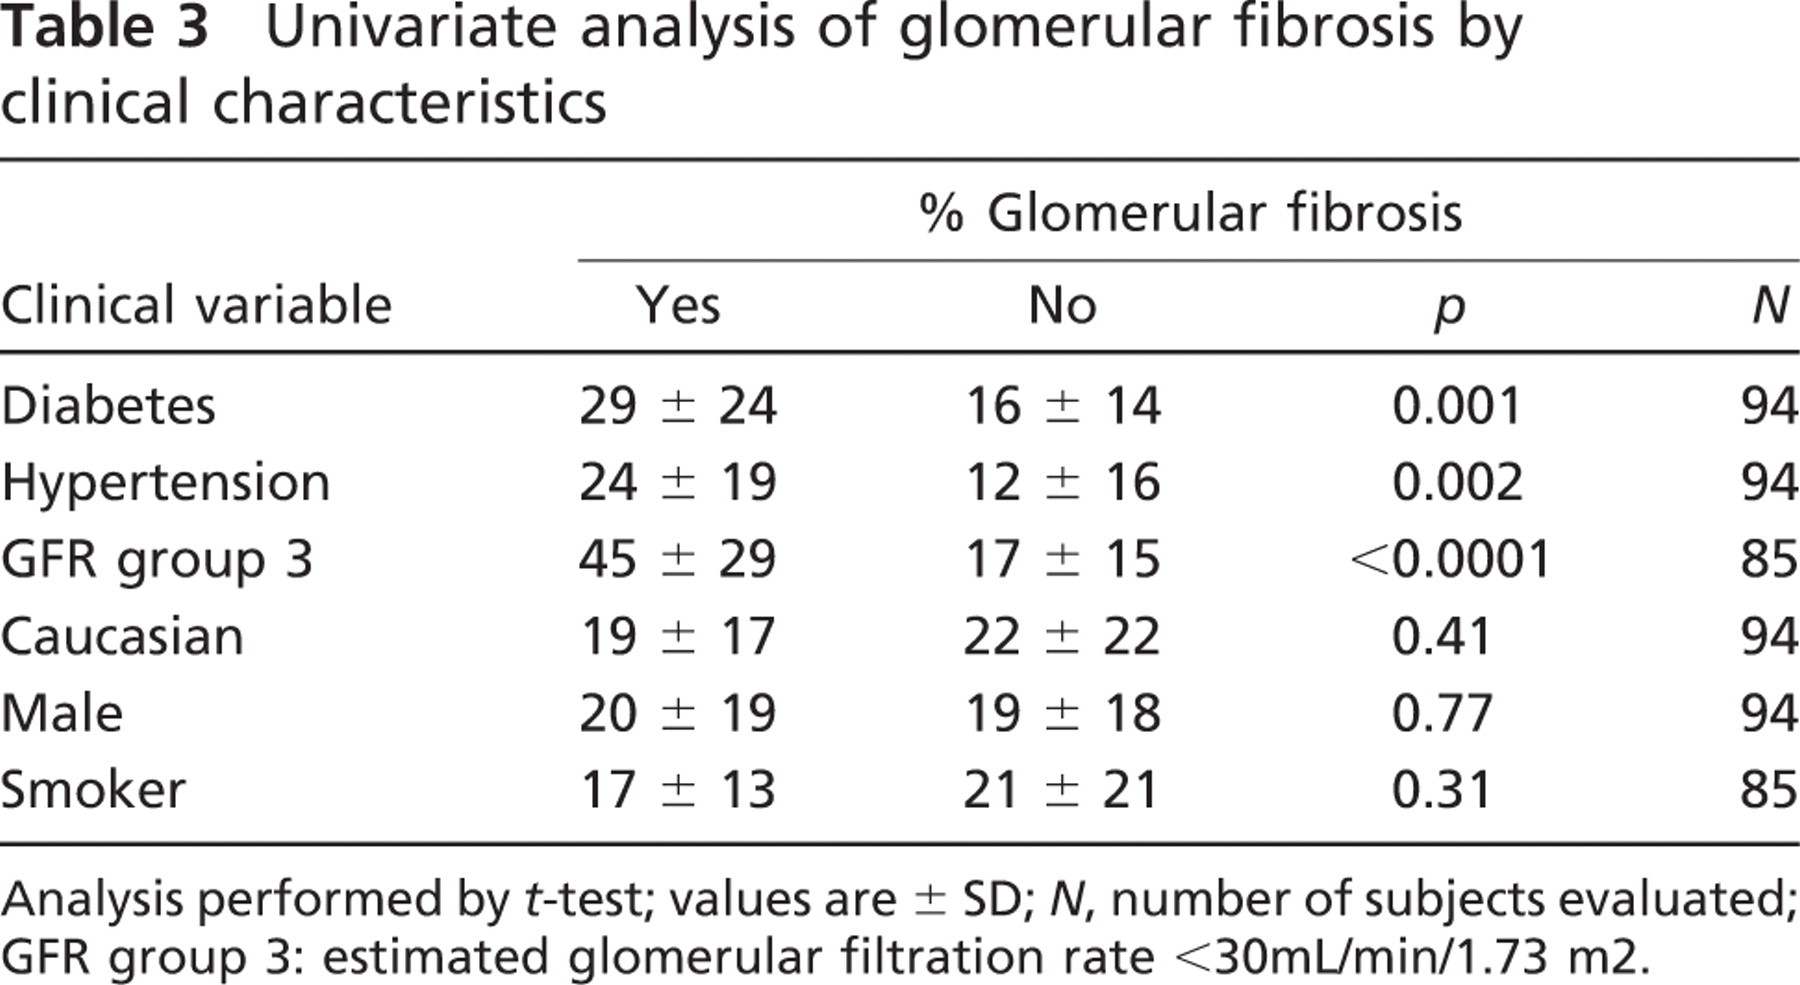
Analysis performed by
MMP-1 and TIMP-1 Staining Was Lower in Disease States
MMP-1 and TIMP-1 glomerular staining was significantly lower in subjects with a history of diabetes, hypertension, or severely reduced renal function (GFR group 3) and in non-Caucasian subjects (Table 2). Also, TIMP-1 glomerular staining was negatively correlated with body mass index (BMI) (
Glomerular Fibrosis Is Associated With Renal Disease
In univariate analysis, glomerular fibrosis was significantly increased in diabetic subjects, hypertensive subjects, and in subjects with severely reduced renal function (Table 3). Glomerular fibrosis was modestly correlated with BMI (
Independent Associations of Clinical Variables With MMP-1 and TIMP-1 Staining
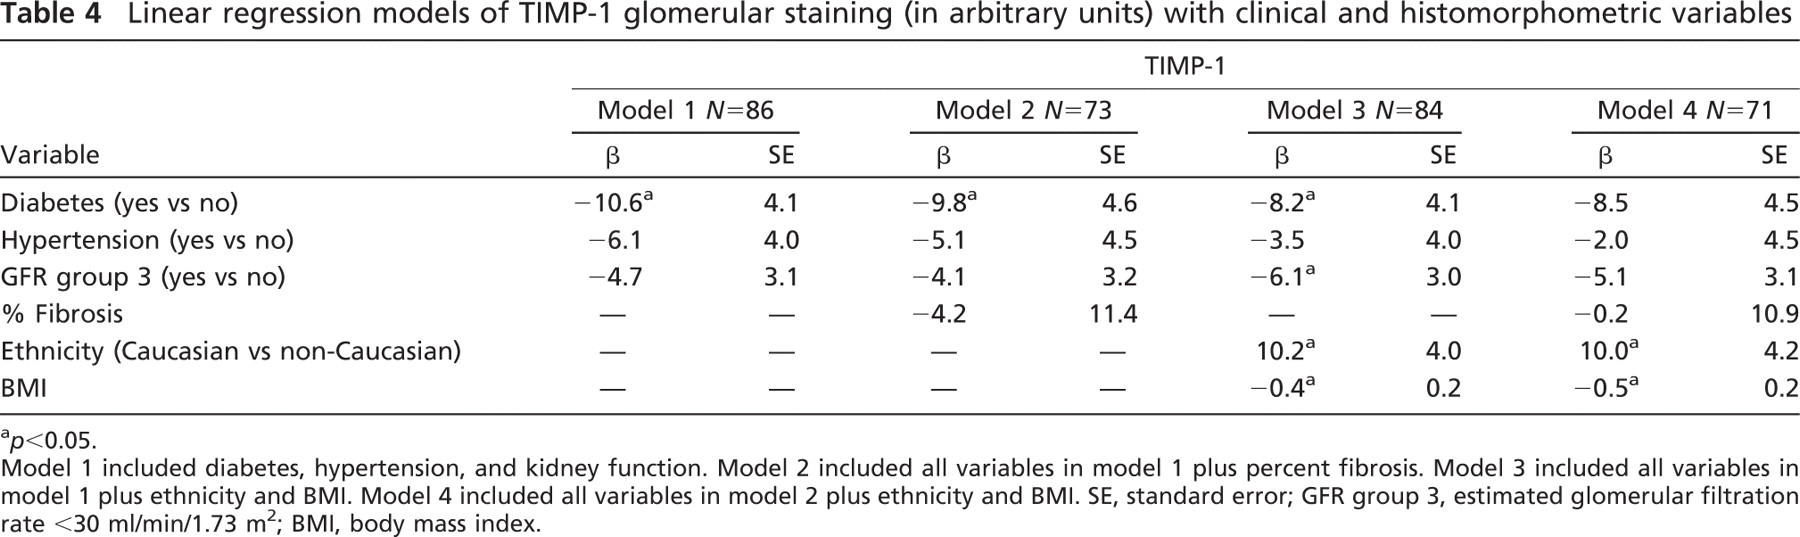
We employed linear regression analyses to assess whether the associations of the phenotypic variables we observed in univariate analysis persisted after simultaneous adjustment. Multivariable analyses are presented in Tables 4 and 5. Model 1 included only diabetes, hypertension, and GFR group 3. Model 2 added the histomorphometric variable “% fibrosis” to model 1. Model 3 included all variables in model 1 plus ethnicity and BMI. Model 4 included all variables in model 3 plus percent fibrosis.
Diabetes was independently associated with decreased TIMP-1 staining in models 1, 2, and 3 (Table 4). Both ethnicity and BMI were independently associated with TIMP-1 staining in models 3 and 4. GFR group 3 was only a significant independent variable in model 3.
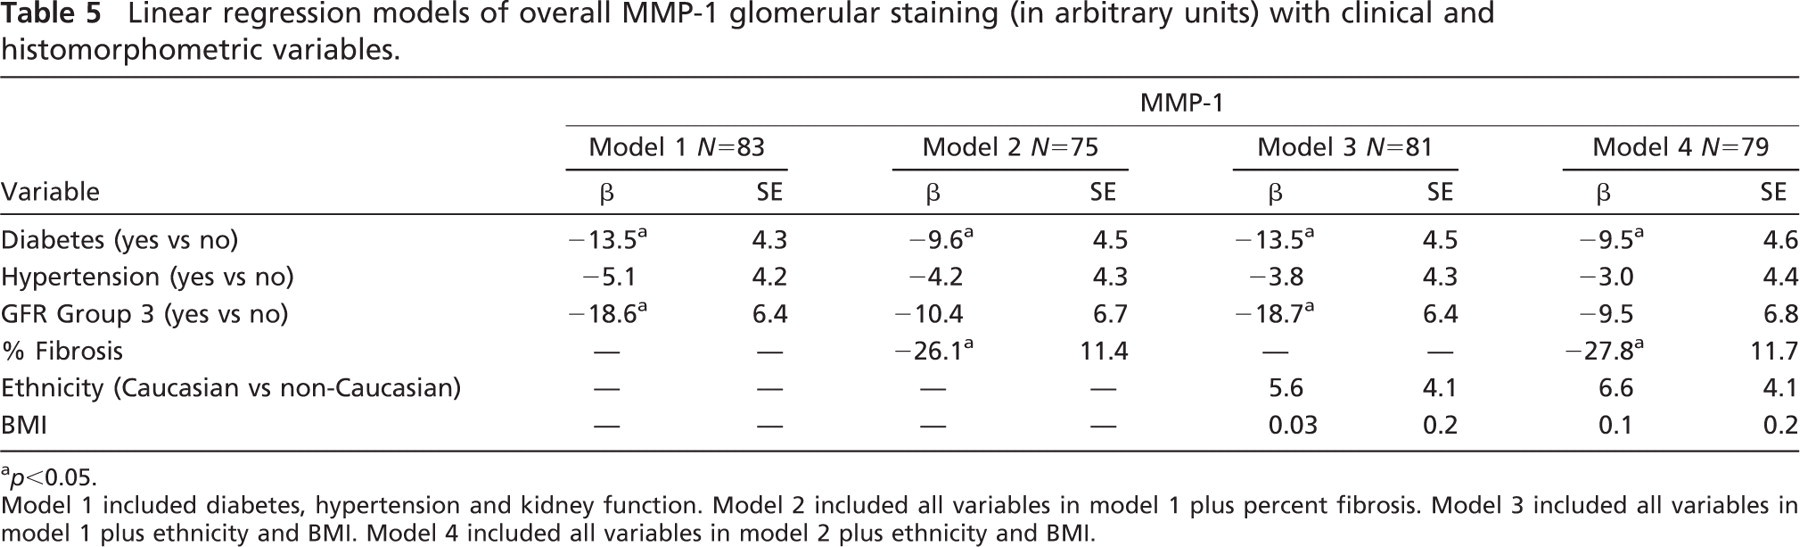
Diabetes was also independently associated with lower MMP-1 staining in all four models (Table 5). In models 1 and 3, severely reduced renal function (group 3) was also independently associated with lower MMP-1 staining. Percent fibrosis was an independent variable in models 2 and 4. Hypertension was not independently associated with either TIMP-1 or MMP-1 in any model.
Linear regression models of TIMP-1 glomerular staining (in arbitrary units) with clinical and histomorphometric variables
a
Model 1 included diabetes, hypertension, and kidney function. Model 2 included all variables in model 1 plus percent fibrosis. Model 3 included all variables in model 1 plus ethnicity and BMI. Model 4 included all variables in model 2 plus ethnicity and BMI. SE, standard error; GFR group 3, estimated glomerular filtration rate <30 ml/min/1.73 m2; BMI, body mass index.
Linear regression models of overall MMP-1 glomerular staining (in arbitrary units) with clinical and histomorphometric variables.
a
Model 1 included diabetes, hypertension and kidney function. Model 2 included all variables in model 1 plus percent fibrosis. Model 3 included all variables in model 1 plus ethnicity and BMI. Model 4 included all variables in model 2 plus ethnicity and BMI.
MMP-2, MMP-3, and MMP-9 Demonstrated Variable Findings in Relation to Disease States
All three proteins demonstrated significantly less staining intensity in patients with severely reduced renal function, but associations with diabetes and hypertension were less robust (Supplemental Table ST2). Also, there was a significant correlation with PMI for all three proteins (one positive and two negative correlations) (Supplemental Table ST1). This confounding variable was added to the multivariable regression models used for MMPs and TIMP-1 and was found to be a significant factor in MMP-2, MMP-3, and MMP-9 staining differences (Supplemental Tables ST3–5).
Discussion
To our knowledge, this is the first large-scale determination of MMP and TIMP levels in glomeruli and their associations with phenotypic information in human subjects. We demonstrated lower MMP-1 and TIMP-1 staining in diabetic subjects, hypertensive subjects, and in subjects with severely reduced renal function. Interestingly, both proteins were higher in Caucasian subjects compared with non-Caucasians in univariate analysis, although after multivariable adjustment, this association was significant only for TIMP-1. Secondary findings include associations of glomerular fibrosis with diabetes, hypertension, and poor renal status, but not patient age, indicating the importance of disease over age on this value in this autopsy population. We also observed significantly lower staining intensity of MMP-2, MMP-3, and MMP-9 in the glomeruli of patients with reduced renal function. In our study, TIMP-2 and TIMP-3 were not present in the glomeruli by IHC, although they demonstrated positive staining in non-glomerular tissues (data not shown; Macgregor et al. 2009).
Because this was an autopsy study, there were some important limitations. We had to rely on available information from medical records and laboratory testing performed premortem for each subject. Serum creatinine values were not available on 10 subjects, preventing us from calculating a GFR; nor did we have measures of glomerular function such as cystatin C. There was heterogeneity of both disease severity and duration for the clinical diagnoses of hypertension and diabetes, which probably impacted on the strength of our findings (Halushka et al. 2009; Halushka et al. in press). Also, the renal tubular epithelial cells autolyzed in a PMI-dependent fashion. Therefore, the protein levels of MMPs and TIMPs in this important part of the kidney could not be evaluated. We also attempted to utilize Western blots to confirm our IHC findings; however, the small amount of frozen tissue saved from each kidney proved insufficient for analysis after isolation of glomeruli was performed (data not shown).
The glomerulus is a collection of unique cell types, and the differences in MMP or TIMP-1 glomerular staining in relation to clinical variables may be interpreted in multiple ways. One interpretation is that more ECM reduces the cellular fraction, reducing the overall intensity of staining. This is partly true, inasmuch as increasing glomerular fibrosis negatively correlated with MMP-1 staining intensity. However, a multivariable model including glomerular fibrosis as a variable demonstrated that diabetes was an independent factor in both MMP-1 and TIMP-1 staining intensity. Second, in certain disease states, the ratio of different cell types (podocytes vs mesangial cells, for example) is altered, which affects overall staining values. A third interpretation is that protein levels decrease in a given cell type in disease states. The difference between these last two options could not be determined in this study, but do not diminish the finding of decreased MMPs and TIMPs in glomeruli.
MMP-1 alterations have been demonstrated in animal models of renal disease. In a 5/6 subtotal nephrectomy model, MMP-1 protein was increased in glomeruli after 17 weeks (Ahmed et al. 2007). Conversely, glomerular MMP-1 mRNA was decreased in mice rendered diabetic by streptozotocin treatment and evaluated at time points up to 24 weeks (Nakamura et al. 1994). Human MMP-1 levels have not been evaluated previously in glomeruli in the setting of hypertension or diabetes. Our human data showing decreased MMP-1 probably reflects later-stage disease progression in an older cohort (average age of 64), well beyond the time points of experimental animal data.
TIMP-1 has been evaluated in both animal and human studies. Ten weeks after streptozotocin administration, diabetic rats showed increased total kidney and glomerular TIMP-1 mRNA (Wu et al. 1997). TIMP-1 protein and activity levels were increased in obese Zucker rats when compared with lean animals at 24 weeks (Schaefer et al. 1997). In a human study, TIMP-1 glomerular mRNA levels decreased with worsening grades of diabetic nephropathy (Suzuki et al. 1997).
The discrepancy between the experimental models and the human data may reflect differences in the MMP and TIMP activity in different stages of the same disease. It may be that early on in hypertensive or diabetic nephropathy, as pathologic ECM alterations are occurring, MMP-1 and TIMP-1 are increased. However, by the time the renal damage is clinically apparent and causing symptoms, MMP-1 and TIMP-1 levels may have decreased. This may be an important distinction for treatments targeting MMPs and TIMPs that may not be effective at later stages in human renal disease.
The findings of this study contradict some reports of MMP and TIMP levels in experimental models of renal disease. This suggests a need for further observational studies of MMPs in renal disease in human subjects. New methods to survey kidneys in high-throughput formats such as that presented here will help better characterize the levels of key proteins over human, not rodent, time courses, as the disease process evolves.
We found the use of TMAs and quantitative IHC scoring to be an ideal high-throughput format for investigating renal disease. We demonstrated strong repro-ducibility of IHC staining within and across TMAs, indicating the relative homogeneity of glomeruli. It is our hope that additional studies can be performed from larger, better-preserved and better-characterized renal tissue collections to evaluate these and other proteins important in progressive renal scarring.
Footnotes
Acknowledgements
This study was supported by a junior faculty award from the American Diabetes Association (1-05-JF-20 to MKH) and by the National Institutes of Health/National Institute of Diabetes and Digestive and Kidney Diseases (Grant K-01 DK-076595 to ES).
References
Supplementary Material
Please find the following supplemental material available below.
For Open Access articles published under a Creative Commons License, all supplemental material carries the same license as the article it is associated with.
For non-Open Access articles published, all supplemental material carries a non-exclusive license, and permission requests for re-use of supplemental material or any part of supplemental material shall be sent directly to the copyright owner as specified in the copyright notice associated with the article.